Transcription
A TUTORIAL ON ACCOUNTING FORCOMPETING RISKS IN SURVIVALANALYSISRebecca Scherzer, PhDPrincipal Research StatisticianKidney Health Research CollaborativeSan Francisco VA Medical CenterUniversity of California at San FranciscoClinical Research Statistical Methods SeminarMay 8th, 2017
2OUTLINE Background When does the problem occur, when does it matter? Methods and illustrations Survival curves and other graphical methods Regression models Number-needed-to-treat (NNT) Interpretation Cause-specific hazard versus sub-distribution hazard: which to use and when? Discussion Best practices and caveats Limitations and research gaps Further reading and resources
3BACKGROUND Clinical research studies often record the timeto more than one outcome: Examples: death, cardiovascular disease (CVD), end stagerenal disease (ESRD) A competing event is one that precludes theoccurrence of the event of interest: Example: after transplant or death, patient is no longer at riskfor primary outcome of interest (ESRD or CVD).
4BACKGROUND, CONTINUED If a patient experiences a competing event,standard survival analysis methods treat thatpatient as censored for the outcome of interest(e.g., ESRD or CVD). Why is this a problem? Kaplan-Meier curves overestimate the incidence of theoutcome over time Cox models inflate the relative differences between groups,resulting in biased hazard ratios
5ALTERNATIVES TO STANDARD METHODS: Survival curves: Cumulative Incidence Function (CIF) Non-parametric CIF Fine-Gray (1999) CIF Inverse probability weighting (IPW) corrected Kaplan-Meier Options for regression models: Sub-distribution hazard ratio (SHR) Fine-Gray (1999) Klein-Andersen (2005) Cause-specific hazard ratio (CHR) Number-needed-to-treat (NNT): Gouskova et al (2014)
6FINE-GRAY (FG) MODEL
7METHODS:PLOTTING THE CUMULATIVE INCIDENCE In each case, we code the event categories as follows: event 0: censored, event 1: outcome of interest, event 2: competing event.Non-parametric:Fine-Gray:SASproc lifetest;time year*event(0) /eventcode 1;run;proc phreg;model year*event(0) x /eventcode 1;run;Statastset year,failure(event 1)stcrreg ,compete(event 2)stcurve, cifstset year, failure(event 1)stcrreg x, compete(event 2)stcurve, cifRlibrary(cmprsk)plot (cuminc (year, event,cencode 0))library(cmprsk)result - crr(year, event, x,failcode 1, cencode 0)plot(predict(result, x))
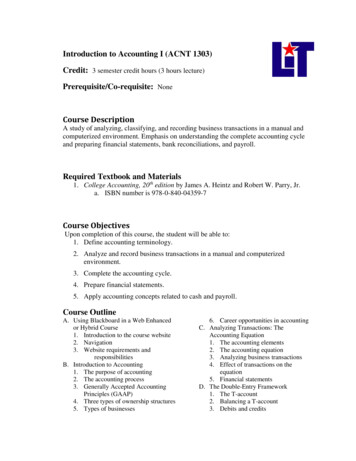
8ILLUSTRATION:NON PARAMETRIC ESTIMATION GIVES VISUAL COMPARISONOF CUMULATIVE RISK OF CVD AND DEATH:
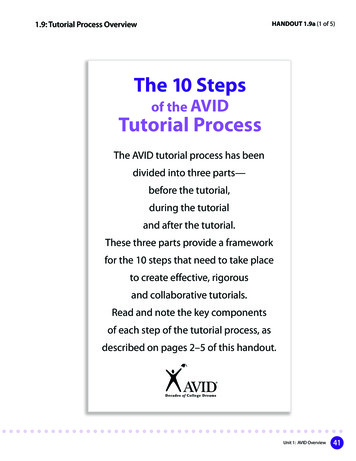
9ILLUSTRATION:COMPARISON OF CUMULATIVE INCIDENCE ESTIMATES BYWALKING SPEED, CVD VS. DEATH:
METHODS:CALCULATION OF SUB-DISTRIBUTION HAZARDRATIO (SHR): Stata: stset year, id(idno) failure (event 1) stcrreg x, compete(event 2) SAS: proc phreg; model year*event(0) x / eventcode 1; run; R: library(cmprsk) crr(year, event, x, failcode 1,censcode 0)10
11METHODS:CALCULATION OF CAUSE-SPECIFIC HAZARD RATIO (CHR) Stata: stset year, id(idno) failure (event 1) stcox x SAS: proc phreg; model year*event(0,2) x / eventcode 1; run; R: coxph(formula Surv (year, event "1") x)
12COMPARISON OF MODELS SHOWS INFLATED HAZARDRATIOS FOR COX CHR VERSUS FG SHR Example 1: slower walking speed and risk of CVDMethodFine-Gray SHRCox CSHHazardRatio1.692.8295% Hazard RatioConfidence Limits1.292.212.123.76P-value0.0001 .0001 Example 2: elevated biomarker and risk of ESRDMethodFine-Gray SHRCox CSHHazardRatio1.151.1895% Hazard RatioConfidence Limits1.091.221.111.25P-value .0001 .0001
13ILLUSTRATION:COMPARISON OF CUMULATIVE CVD INCIDENCE ESTIMATES BYWALKING SPEED, COX VERSUS FINE-GRAY MODEL:
14METHODS:NUMBER-NEEDED-TO TREAT (NNT) NNT is the reciprocal of the absolute risk difference: Example: AR 5% NNT 20, means that treating 20patients would prevent one case of disease In the presence of competing risks, Gouskova et al(2014) define the NNT at time t using the CIF fromthe Fine-Gray model :1NNT (t ) CIF Ctl (t ) CIF Trt (t )
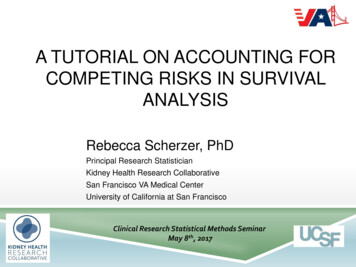
15METHODS:ESTIMATE NNT USING CIF FROM FINE-GRAYMODEL: Example 1: Suppose a drug is available that can increase walkingspeed. How many patients must we treat to prevent CVD, in thepresence of competing risk of death? CIF for slow walkers at year 10 0.38CIF for fast walkers at year 10 0.25 AR 0.38 – 0.25 0.13 NNTat 10 years 8 Example 2: Suppose a drug is available that can reduce biomarkerlevels. How many patients must we treat to prevent ESRD, in thepresence of competing risk of death? CIF for elevated biomarker at year 5 0.117CIF for normal biomarker at year 5 0.102 AR 0.015 NNTat 5 years 67
16ILLUSTRATION:ESTIMATION OF NNT OVER TIME:Example 1: walk speed and CVDExample 2: biomarker and ESRDNNT 67NNT 8
17WHEN DO COX AND FG RESULTSDIFFER? If competing event is frequentIf competing event occurs earlyEffect of censoring proportion Effect of event time correlation
18Adapted from T4, Dignam et al. 2012, Clin Cancer Res
19EFFECT OF CENSORING ON HR:Scenario: 2x CVD rate in Group B vs. Group A, same death rate in both groups4.00Hazard RatioCox CVD2.001.002.001.761.000.69FG CVD2.011.771.782.011.811.001.002.001.000.71Cox Death0.730.79FG Death2.011.861.000.852.021.950.990.920.500102550% of cases censoredAdapted from T3, Dignam et al. 2012, Clin Cancer Res6785
20INDEPENDENT EVENT TIMES:Hazard Ratio: Group B vs. ASCENARIO 1: 33% CENSORING, CVD & DEATH EVENT TIMESUNCORRELATED42Cox CVDFG CVDCox CVD Cox DeathCox CVDFG CVDFG CVD FG Death1Cox DeathCox DeathFG DeathFG Death0.52x more CVD in group B, Same death A & B2x more CVD & Death in group B vs. A2x more CVD &Deathin group B vs. AAdapted from T1, Dignam et al. 2012, Clin Cancer Res2x more CVD group B,2x more CVD, 1.3x more Death in group B vs. A2x more CVD,1.3x moreDeath in groupB vs. A
CORRELATED EVENT TIMES21SCENARIO 2: 33% CENSORING, CVD & DEATH EVENT TIMESCORRELATED (r 0.6)4Hazard Ratio: Group B vs. ACox CVDFG CVDCox CVDCox CVDCox Death2FG CVDFG CVD FG DeathCox Death10.5FG DeathCox DeathFG Death2x more CVD in group B, Same death A & B2x more CVD & Death in group B vs. A2x more CVD &2x more CVD group B, Deathin group B vs. AAdapted from T2, Dignam et al. 2012, Clin Cancer Res2x more CVD, 1.3x more Death in group B vs. A2x more CVD,1.3x moreDeath in groupB vs. A
22Recommendations for Analyzing Competing Risk Survival Data Cumulative incidence functions (CIFs) should be used to estimate theincidence of each of the different types of competing risks. Do not use theKaplan-Meier estimate of the survival function for this purpose. Researchers need to decide whether the research objective is onaddressing etiologic questions or on estimating incidence or predictingprognosis. Use the Fine-Gray subdistribution hazard model when the focus is onestimating incidence or predicting prognosis in the presence of competingrisks. Use the cause-specific hazard model when the focus is on addressingetiologic questions. In some settings, both types of regression models should be estimatedfor each of the competing risks to permit a full understanding of the effectof covariates on the incidence and the rate of occurrence of eachoutcome.Austin et al, 2016
23DISCUSSION Caveats: Interpretation can be difficult: effect of covariate on CSH maybe different (even opposite!) effect on incidence. Still need to check proportional hazard assumption, just aswith ordinary Cox models Non-informative censoring assumption: probability of event should be unrelated to mechanism ofcensoring length of follow-up should not depend on a patient’s medicalcondition Best practices: Do the usual regression checks: check for outliers andinfluential data points, assess linearity, collinearity, etc. Use CIF plots and other visualization to examine covariateeffects for each event type
24DISCUSSION Limitations: When running competing risk models, standard software hasfewer options for stratification, shared frailty, tests of model fit,and variable selection methods. Research and software gaps: Optimal method for reweighting Left or interval censoring and truncation Censoring assumptions: effect of competing risk onsubsequent events (preclude versus change probability)
25FURTHER READING AND RESOURCES Software: rsk.pdf www.stata.com/manuals13/ststcrreg.pdf ompetingrisk2014.pdf nettes/Tutorial.pdfReferences: Peter C. Austin, Douglas S. Lee and Jason P. Fine. Introduction to the Analysis of Survival Data in thePresence of Competing Risks Circulation. 2016;133:601-609, originally published February 8, 2016 Dignam JJ, Zhang Q, Kocherginsky MN. The Use and Interpretation of Competing Risks Regression Models.Clinical Cancer Research. 2012;18(8):2301-2308. Marlies Noordzij, Karen Leffondré, Karlijn J. van Stralen, Carmine Zoccali, Friedo W. Dekker, Kitty J. Jager;When do we need competing risks methods for survival analysis in nephrology?. Nephrol DialTransplant 2013; 28 (11): 2670-2677. Wolbers M, Koller MT, Stel VS, Schaer B, Jager KJ, Leffondré K, Heinze G. Competing risks analyses:objectives and approaches. European heart journal. 2014; 35: 2936-2941. Zhou, Bingqing, et al. “Competing risks regression for stratified data.” Biometrics 67.2 (2011): 661-670. Zhou, Bingqing, et al. “Competing risks regression for clustered data.” Biostatistics 13.3 (2012): 371-383.
BACKGROUND Clinical research studies often record the time to more than one outcome: Examples: death, cardiovascular disease (CVD), end stage renal disease (ESRD) A competing event is one that precludes the occurrence of the event of interest: Example: after transplant or death, patient is no longer at risk for primary outcome of interest (ESRD or CVD).