Transcription
IBM SoftwareBusiness AnalyticsIBM SPSS Neural Networks 20IBM SPSS NeuralNetworksNew tools for building predictive modelsHighlightsExplore subtle or hidden patterns inyour data. Build better-performing models No programming needed Choice of MLP or RBF algorithmsYour organization needs to find patterns and connections in the complexand fast-changing environment you work in so that you can make betterdecisions at every turn. You may be using IBM SPSS Statistics Baseand one or more of its modules to help you do this. If so, you knowthe power and versatility you have at your fingertips. But there’s evenmore you can do.You can explore subtle or hidden patterns in your data, using IBM SPSSNeural Networks. This module offers you the ability to discover morecomplex relationships in your data and generate better performingpredictive models.The procedures in SPSS Neural Networks complement the moretraditional statistics in SPSS Statistics Base and its modules. Find newassociations in your data with SPSS Neural Networks and then confirmtheir significance with traditional statistical techniques.IBM SPSS Neural Networks is available for installation as client-onlysoftware but, for greater performance and scalability, a server-basedversion is also available.Why use a neural network?A computational neural network is a set of non-linear data modelingtools consisting of input and output layers plus one or two hiddenlayers. The connections between neurons in each layer have associatedweights, which are iteratively adjusted by the training algorithm tominimize error and provide accurate predictions.
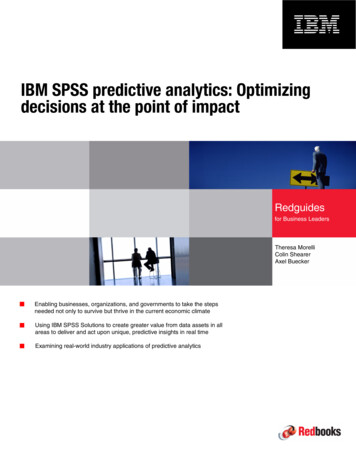
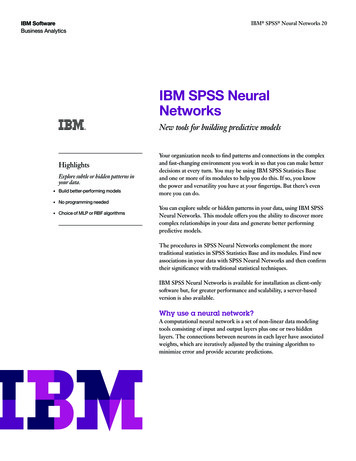
IBM SoftwareBusiness AnalyticsIBM SPSS Neural Networks 20You set the conditions under which the network “learns” andcan finely control the training stopping rules and networkarchitecture, or let the procedure automatically choose thearchitecture for you.You can combine SPSS Neural Networks with other statisticalprocedures to gain clearer insight in a number of areas. In marketresearch, for example, you can create customer profiles anddiscover customer preferences. In database marketing, you cansegment your customer base and optimize marketing campaigns.In financial analysis, you can use SPSS Neural Networks toanalyze applicants’ creditworthiness and to detect possiblefraud. In operational analysis, use this new tool to managecash flow and improve logistics planning. Scientific andhealthcare applications include forecasting treatment costs,performing medical outcomes analysis, and predicting thelength of a hospital stay.Control the process from start to finishWith SPSS Neural Networks, you select either the MultilayerPerceptron (MLP) or Radial Basis Function (RBF) procedure.Both of these are supervised learning techniques – that is, theymap relationships implied by the data. Both use feedforwardarchitectures, meaning that data moves in only one direction,from the input nodes through the hidden layer of nodes to theoutput nodes.In an MLP network like the one shown here, the data feeds forward fromthe input layer through one or more hidden layers to the output layer.From the Multilayer Perceptron (MLP) dialog, you select the variables thatyou want to include in your model.2
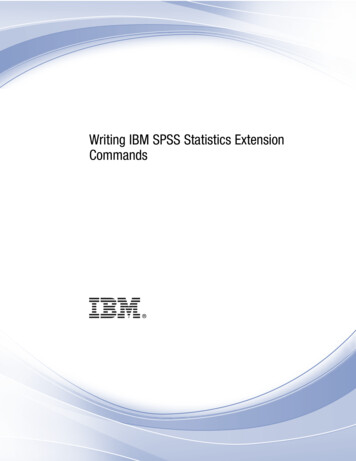
IBM SoftwareBusiness AnalyticsIBM SPSS Neural Networks 20Your choice of procedure will be influenced by the type ofdata you have and the level of complexity you seek to uncover.While the MLP procedure can find more complexrelationships, the RBF procedure is generally faster.With either of these approaches, you divide your data intotraining, testing, and holdout sets. The training set is used toestimate the network parameters. The testing set is used toprevent overtraining. The holdout set is used to independentlyassess the final network, which is applied to the entire datasetand to any new data.You specify the dependent variables, which may be scale,categorical, or a combination of the two. If a dependentvariable has scale measurement level, then the neural networkpredicts continuous values that approximate the “true” valueof some continuous function of the input data. If a dependentvariable is categorical, then the neural network is used toclassify cases into the “best” category based on the inputpredictors.The results of exploring data with neural network techniques can be shownin a variety of graphic formats. This simple bar chart is one of many options.You adjust the procedure by choosing how to partition thedataset, what sort of architecture you want, and whatcomputation resources will be applied to the analysis. Finally,you choose to display results in tables or graphs, save optionaltemporary variables to the active dataset, and export models inXML-file formats to score future data.Gain greater value with collaborationTo share and efficiently distribute assets, protect them in waysthat meet internal and external compliance requirements andpublish results so that a greater number of business users canview and interact with them, consider augmenting IBM SPSSStatistics Developer with IBM SPSS Collaboration andDeployment services. More information about its valuablecapabilities can be found at www.ibm.com/spss/devcentral.3
IBM SoftwareBusiness AnalyticsIBM SPSS Neural Networks 20Features The PARTITION subcommand specifies the method ofpartitioning the active dataset into training, testing, andholdout samples. The training sample comprises the datarecords used to train the neural network. The testing sampleis an independent set of data records used to track predictionerror during training in order to prevent overtraining. Theholdout sample is another independent set of data recordsused to assess the final neural network. You can specify:–– The relative number of cases in the active datasetto randomly assign to the training sample–– The relative number of cases in the active datasetto randomly assign to the testing sample–– The relative number of cases in the active datasetto randomly assign to the holdout sample–– A variable that assigns each case in the active datasetto the training, testing, or holdout sample The ARCHITECTURE subcommand is used to specifythe neural network architecture. You can specify:–– Whether to use the automatic architecture or,if automatic is not used: The number of hidden layers in the neuralnetwork The activation function to use for all units in thehidden layers (Hyperbolic tangent or Sigmoid) The activation function to use for all units in theoutput layer (Identity, Hyperbolic tangent,Sigmoid, or SoftmaxMultilayer Perceptron (MLP)The MLP procedure fits a particular kind of neural networkcalled a multilayer perceptron. The multilayer perceptron is asupervised method using feedforward architecture. It can havemultiple hidden layers. One or more dependent variables maybe specified, which may be scale, categorical, or a combination.If a dependent variable has scale measurement level, then theneural network predicts continuous values that approximatethe “true” value of some continuous function of the inputdata. If a dependent variable is categorical, then the neuralnetwork is used to classify cases into the “best” category basedon the input predictors. Predictors–– Factors–– Covariates The EXCEPT subcommand lists any variables that the MLPprocedure should exclude from the factor or covariate lists onthe command line. This subcommand is useful if the factoror covariate lists contain a large number of variables. The RESCALE subcommand is used to rescale covariates orscale dependent variables–– Dependent variable (if scale):standardized, normalized, adjusted normalized, or none–– Covariates: standardized, normalized, adjustednormalized, or none4
IBM SoftwareBusiness Analytics IBM SPSS Neural Networks 20The CRITERIA subcommand specifies the computationaland resource settings for the MLP procedure. You canspecify the training type, which determines how the neuralnetwork processes training data records: batch training,online training, mini-batch training. You can also specify:–– The number of training records per mini-batch (ifselected as the training method)–– The maximum number of cases to store in memorywhen automatic architecture selection and/or minibatch training is in effect–– The optimization algorithm used to determine thesynaptic weights: Gradient–– descent, Scaled conjugate gradient–– The initial learning rate for the gradient descentoptimization algorithm–– The lower boundary for the learning rate whengradient descent is used with online or mini-batchtraining–– The momentum rate for the gradient descentoptimization algorithm–– The initial lambda, for the scaled conjugate gradientoptimization algorithm–– The initial sigma, for the scaled conjugate gradientoptimization algorithm–– The interval [a0 a, a0 a] in which weight vectors arerandomly generated when simulated annealing is used5 The STOPPINGRULES subcommand specifies the rulesthat determine when to stop training the neural network.You can specify:–– The number of steps n to allow before checking fora decrease in prediction error–– Whether the training timer is turned on or off and themaximum training time–– The maximum number of epochs allowed–– The relative change in training error criterion–– The training error ratio criterion The MISSING subcommand is used to control whetheruser-missing values for categorical variables – that is, factorsand categorical dependent variables – are treated as validvalues The PRINT subcommand indicates the tabular output todisplay and can be sed to request a sensitivity analysis.You can choose to display:–– The case processing summary table–– Information about the neural network, including thedependent variables, number of input and output units,number of hidden layers and units, and activationfunctions–– A summary of the neural network results, including theaverage overall error, the stopping rule used to stoptraining and the training time–– A classification table for each categorical dependentvariable–– The synaptic weights; that is, the coefficient estimates,from layer i 1unit j to layer i unit k–– A sensitivity analysis, which computes the importanceof each predictor in determining the neural network
IBM SoftwareBusiness Analytics IBM SPSS Neural Networks 20Radial Basis Function (RBF)The PLOT subcommand indicates the chart output todisplay. You can display:–– Network diagram–– A predicted by observed value chart for each dependentvariable–– A residual by predicted value chart for each scaledependent variable–– ROC (Receiver Operating Characteristic) curves foreach categorical dependent variable. It also displaysa table giving the area under each curve–– Cumulative gains charts for each categorical dependentvariable–– Lift charts for each categorical dependent variable The SAVE subcommand writes optional temporary variablesto the active dataset. You can save:–– Predicted value or category–– Predicted pseudo-probability The OUTFILE subcommand saves XML-format filescontaining the synaptic eightsThe RBF procedure fits a radial basis function neural network,which is a feedforward, supervised learning network with aninput layer, a hidden layer called the radial basis function layer,and an output layer. The hidden layer transforms the inputvectors into radial basis functions. Like the MLP procedure,the RBF procedure performs prediction and classification.The RBF procedure trains the network in two stages:1. The procedure determines the radial basis functions usingclustering methods. The center and width of each radialbasis function are determined2. The procedure estimates the synaptic weights given theradial basis functions. The sum-of-squares error functionwith identity activation function for the output layer is usedfor both prediction and classification. Ordinary Least Squaresregression is used to minimize the sum-of-squares error6
IBM SoftwareBusiness AnalyticsIBM SPSS Neural Networks 20About IBM Business AnalyticsDue to this two-stage training approach, the RBF network isin general trained much faster than MLP.IBM Business Analytics software delivers actionable insightsdecision-makers need to achieve better business performance.IBM offers a comprehensive, unified portfolio of businessintelligence, predictive and advanced analytics, financialperformance and strategy management, governance, risk andcompliance and analytic applications.Subcommands listed for the MLP procedure perform similarfunctions for the RBF procedure, with the followingexceptions: When using the ARCHITECTURE subcommand, users canspecify the Gaussian radial basis function used in the hiddenlayer: either Normalized RBF or Ordinary RBFWhen using the CRITERIA subcommand, users can specifythe computation settings for the RBF procedures, specifyinghow much overlap occurs among the hidden units SystemrequirementsWith IBM software, companies can spot trends, patterns andanomalies, compare “what if” scenarios, predict potentialthreats and opportunities, identify and manage key businessrisks and plan, budget and forecast resources. With these deepanalytic capabilities our customers around the world can betterunderstand, anticipate and shape business outcomes.System requirementsFor more informationRequirements vary according to platform. For details, seewww.ibm.com/spss/requirements.For further information or to reach a representative pleasevisit ibm.com/analytics.Request a callTo request a call or to ask a question, go to ibm.com/business-analytics/contactus. An IBM representative willrespond to your inquiry within two business days.7
Copyright IBM Corporation 2011IBM CorporationRoute 100Somers, NY 10589US Government Users Restricted Rights - Use, duplication of disclosure restrictedby GSA ADP Schedule Contract with IBM Corp.Produced in the United States of AmericaJune 2011All Rights ReservedIBM, the IBM logo and ibm.com are trademarks of International Business MachinesCorp., registered in many jurisdictions worldwide. Other product and servicenames might be trademarks of IBM or other companies. A current list of IBMtrademarks is available on the Web at "Copyright and trademark information"at www.ibm.com/legal/copytrade.shtml.SPSS is a trademark of SPSS, Inc., an IBM Company, registered in manyjurisdictions worldwide.Other company, product or service names may be trademarks or service marksof others.P26398Please RecycleYTD03119-USEN-00
SPSS Neural Networks 20. IBM SPSS Neural . Networks. New tools for building predictive models. Your organization needs to find patterns and connections in the complex . and fast-changing environment you work in so that you can make better decisions at every turn. You may be using IBM SPSS Statistics Base and one or more of its modules to help .