Transcription
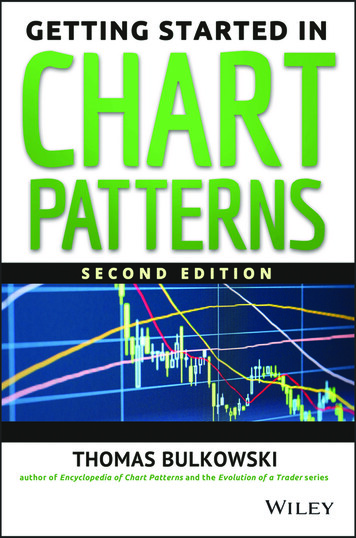
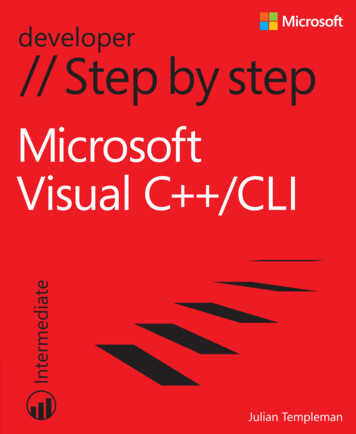
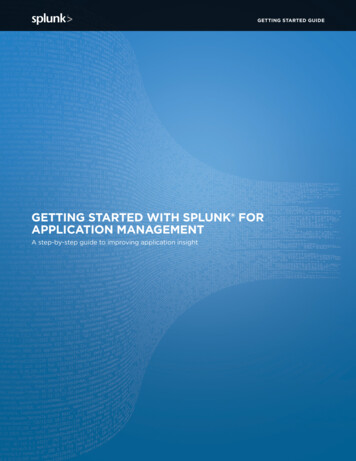
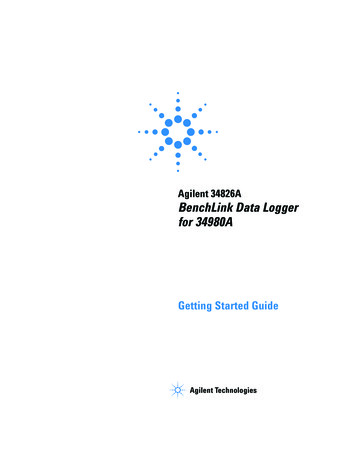
Chapter One: Getting Started With IBM SPSS for WindowsEdward E. NelsonUsing WindowsThe Windows start-up screenshould look something likeFigure 1-1. Several standarddesktop icons will alwaysappear on start up. Note theTaskbar along the bottom,with the Start icon at the farleft. If you're using your ownyour own computer, you cando quite a bit of customizingof your desktop by choosingyour favorite colors andscenes, rearranging andadding icons, moving theTaskbar to a differentlocation, hiding it from view,and so on.Figure 1-1Although Windows makes use of the right-button key on the mouse, we will only use theleft button for now. When we say to click on the mouse button, it will always mean theleft one. A single click will often take you where you want to go, but if one click doesn’tdo anything, try a double click. (Double clicking means to press the left mouse buttontwice in rapid succession. If nothing seems to happen, you probably need to double clickmore rapidly.)Now click on the Start icon and the Start menuwill appear. Your screen should look somethinglike Figure 1-2. This is the basic Start menu. Itcan also be customized by adding your mostoften used programs to it. Without clickinganything yet, move the mouse pointer up anddown the Start menu. As you encounter eachitem, it will become highlighted. Some of theitems on the Start menu have little downwardpointing arrows on the right. If one is present,that means there are more menus for that item.Figure 1-2
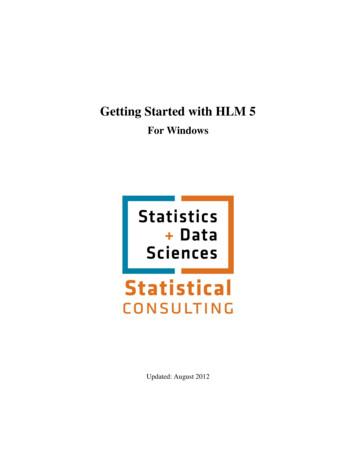
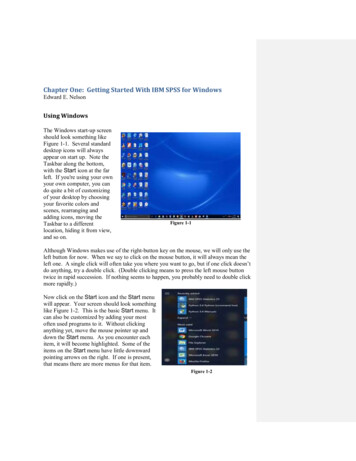
Starting IBM SPSS for WindowsThe IBM SPSS 25 icon should be on the Start menu. If you are using a computer in alab, it is common for the icon to be placed in a folder. If you customize your computer,all you have to do to start IBM SPSS is to point to the IBM SPSS 25 icon on the desktopand double click. Then wait while IBM SPSS loads.After IBM SPSS loads, you may, depending on how IBM SPSS is set up, get a menu thatasks, “What’s new?” at the top. For this tutorial, click Close to get rid of this. Now thescreen should look like Figure 1-3.The Taskbar is probablyvisible at the bottom of thescreen. It shows an IBMSPSS icon. You can alsoclick on this icon to openIBM SPSS.Next, observe the threesmall symbols in theuppermost right-handcorner of the IBM SPSSwindow. The one furthestto the right, with an X in it,is used when you want toFigure 1-3close any program you areusing. Don’t worry if youclick on it accidentally, a dialog box will pop up asking if you want to save anything thatchanged since the last time you saved your work, before it actually lets you exit theprogram.The middle of the three small symbols allows you to expand the window in which youare working so it fills up the whole screen, or to shrink it down to a smaller size. If themiddle square shows two cascading rectangles in it, the window is already as big as it canget—clicking on this square will reduce the window in size. Try this now. In thisshrunken window, the middle button now shows only one rectangle. Click on it to getback to the full screen view.The last symbol, to the left of the other two, has what looks like a minus sign on it. Clickthis and watch what happens. You haven't actually closed IBM SPSS. Click on the iconin the task bar and IBM SPSS will reappear on your screen.Leaving IBM SPSSWe’re not ready to actually use IBM SPSS yet, so let’s close it. There are at least fourways to do this. Move your mouse until the arrow is pointing at the word File in the
upper-left hand corner of the screen and press the left mouse button once. A menu willappear. Move the arrow so it is pointing at the word Exit and press the left mouse button.This should close IBM SPSS.There is a second technique that can do the same thing. (Computers usually have morethan one way to do everything.) Go back into IBM SPSS and move your mouse until thearrow is pointing at the word File in the upper-left corner of the screen and press the leftmouse button once, but this time, don’t release the mouse button. Hold the mouse buttondown and move the mouse down until the word Exit is highlighted. Now release themouse button and IBM SPSS should close. This is called click and drag and is anotherway to use your mouse.The third way to close IBM SPSS is to point your mouse at the IBM SPSS icon in theupper-left corner of the screen. The icon will be just to the left of the words Untitled:IBM SPSS Statistics Data Editor. Move your mouse to the icon and double click on it.This has the same effect as the first two procedures; it closes IBM SPSS.The final and fourth way to close IBM SPSS is to point your mouse at the X in theupper-right corner of the screen and click. IBM SPSS will close.Now you know how to move your mouse around and how to start and close IBM SPSS.We’ll show you more about Windows, but not much more. If you want to learn moreabout Windows, there are a lot of books available. The nice thing about Windows is thatyou don’t have to know much about it to use it.Looking at DataThere are two data files to be used with this tutorial: GSS16A. This is a subset of the 2016 General Social Survey. TheGeneral Social Survey is a large, national probability sample done everytwo years. COUNTRIES. This file includes data on almost all of the world’scountries.You can download these data files from the web by going to IBM SPSS Statistics forWindows 25: A Basic Tutorial. Also, if you are in a computer lab, someone may havecopied one or both of the data files onto your hard drive.Let’s begin by starting IBM SPSS just as you did above. Your screen should look likeFigure 1-3. (If you see a box asking, “What’s new?” click on Close to close this box.)At the very top of the screen, you will see the words IBM SPSS Statistics Data Editor.Just below that line will be the menu bar with the following options: File, Edit, View,Data, Transform, Analyze, Graphs, Utilities, Extensions, Window, and Help. Pointyour mouse at File and press the left mouse button.Comment [e1]: Please add link
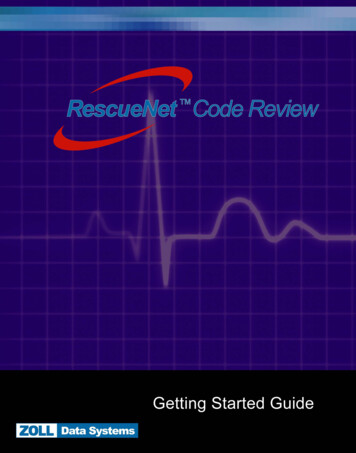
A box will open that is the File menu. Point your mouse at Open and then at Data andclick. (Also, you could have gotten to this point by clicking on the Open Data icon justbelow File on the menu bar.)This opens a larger box called the Open Data box. Here you need to tell IBM SPSSwhere to find the data file to open. In the upper part of the box, you'll see Look in. Findthe folder that contains the data file and click on the file name, GSS16A, to highlight itand then click on Open. In a few seconds, your data matrix will appear.A data matrix is a very important concept. The rows contain the cases and the columnscontain the variables. (If you're familiar with spreadsheets, that's what this is.) Row 1 iscase 1; row 2 is case 2, and so on. The top of each column contains the variable name.In this data set, the variable names are abbreviations like abany and abdefect.Unfortunately, the abbreviations for the variable names don't tell you very much. Weneed some way to find out what these variables are. So try this. On the menu bar at thetop of your screen, you'll see the word Utilities. Point your mouse at Utilities and clickthe left button. This will open the Utilities menu. Point your mouse at Variables andclick again. Your screen should look like Figure 1-4.You'll see a list of all thevariables in your data on theleft side of the little window.(Also, see Appendix A for alist of variables.) Point yourmouse at any of these variablesand click. To the right of theVariable List you'll see a shortdescription of this variable.For example, point your mouseFigure 1-4at the variable abany and pressthe left mouse button. Thisquestion asked if respondents thought that obtaining a legal abortion should be legal for awoman if she wants it for any reason. The possible answers are YES (value 1), NO(value 2), DK or don't know (value 8), NA or no answer (value 9), and IAP or notapplicable (value 0). (Not applicable includes people who were not asked the question.)As you will see, these values are very important.Now you know how to open a preexisting data file in IBM SPSS and how to find outwhat the variables are in the file. We will tell you more about this later, but here we justwant to give you a brief introduction to IBM SPSS.A Brief Tour of IBM SPSSNow that you have the file opened, let's look at some things you can do with IBM SPSS.You're already familiar with the variable abany. Let's find out what percent of peoplesurveyed thought it ought to be legal for a woman to have an abortion for any reason. (If
you have the Variables window open showing the variable labels andvalues, point your mouse at the cancel button and click it.) On themenu bar you will see Analyze. Point your mouse at Analyze andclick it. A box opens that looks like Figure 1-5.This lists the statistical procedures in IBM SPSS. We want to useDescriptive Statistics so point your mouse at DescriptiveStatistics. This opens another box listing the statistical proceduresyou can use to summarize your data. Point your mouse atFrequencies and click it. This opens the Frequencies box. Sinceabany is the first variable in the data, it's already highlighted.1 Pointyour mouse at the right arrow next to the list of variables and click it.The variable abany will move to the box called Variable(s). This ishow you select variables. Point your mouse at OK and click it. In afew seconds, a new screen should appear that looks like Figure 1-6.We are now in a different part of IBM SPSS called the OutputWindow. This is where the results, or output, are displayed.The Output Window is divided into two vertical frames or panes.The left-hand pane contains the outline of the output or informationthat IBM SPSS gives you. This information is in outline form andcan be used to select what you want to view. Simply click on theinformation you want to look at and thatinformation will appear in the right-handpane. You can also collapse and expand theoutline by clicking on the plus and minussigns in the left-hand pane. The plus signindicates that the information is collapsed (orhidden) and the minus sign indicates that it isexpanded (or shown). You can use the scrollbars on each pane to scroll through the OutputWindow.Figure 1-5On the right side, the frequency distributionfor abany is divided into four parts: (1) thetitle, (2) notes on the table (there aren’tFigure 1-6any for this table), (3) the active dataset(i.e., the dataset you are currently using), (4) statistics (a summary of the number ofmissing and valid observations), and (5) the actual table showing the frequencydistribution. Click on Statistics in the left-hand pane and you will see that there were1,825 valid and 1,042 missing cases. Click on abortion—if woman wants for any1Instead of seeing a list of variables, you may see a list of variable labels. You can change this so IBMSPSS displays the list of variables. To do this, click on Edit in the menu bar, then click on Options and onthe General tab. Look for Variable Lists in the General tab and click on Display names. You can put thevariable names in alphabetical order by clicking on Alphabetical just below Display names. Finally, clickon OK.
reason and you will see the frequency distribution. In Figure 1-6, you can see that 819people said yes, 1,006 said no, 49 said they didn't know, 29 didn’t answer the question,and 964 were coded not applicable. (These 964 respondents were not asked this question.In survey research it's very common to ask some, but not all, of the respondents aparticular question. In this case, only 1,903 of the 2,867 respondents were asked thisquestion.) Of those who had an opinion, we want to know what percent of therespondents said yes or no, so we should look at the Valid Percents in the table. About45% of the respondents who had an opinion thought it should be legal, while 55%thought it should be not be legal.It would be interesting to know ifmen or women were more likely tofavor allowing a legal abortionwhen the woman wants it for anyreason. We’re going to use acrosstab to determine this. Pointyour mouse at Analyze and pressthe left mouse button. Then pointyour mouse at DescriptiveStatistics and finally, point yourmouse at Crosstabs and press themouse button. Your screen shouldlook like Figure 1-7. The list ofFigure 1-7variables in your data set is on theleft of the screen. We want to move the variable abany into the box next to the list ofvariables where it says Rows. Click on the variable abany, which will highlight it.Now click on the arrow pointing to theright, which is next to the Rows box.Notice that this moves abany into the Rowsbox. We also need to move the variablesex into the Columns box. You will haveto use the scroll bar in the box containingthe list of variables to find this variable.(You can also click anywhere in this boxand then type the letter S to move to thefirst variable starting with the letter S.)Point your mouse at the down arrow nextto the list of variables and click. If youkeep pressing the mouse button, the list ofFigure 1-8variables will move down and eventually youwill see the variable sex. Highlight it and click on the arrow pointing to the right, whichis next to the Columns box. This moves sex into the Columns box. You screen shouldlook like Figure 1-8.Frequencies by themselves are seldom useful. You’ll need to compute percents. To get
IBM SPSS to compute percentages, point your mouse at the button labeled Cells at theright of the screen and click on it. This will open the Crosstabs: Cell Display box.Find the box called Column Percentages and click on this box.Now click on Continue and you willbe back to the Crosstabs box. To tellIBM SPSS to run the Crosstabsprocedure, click on OK. In a secondyour screen should look like Figure1-9. Use the scroll bar to look at allthe information that IBM SPSS givesyou in the Output Window. Figure1-9 shows the results, or “output.” Itshows, for example, that males andfemales differ very little in theiropinions about a woman obtaining alegal abortion for any reason. Fortyfive percent of the males and 44percent of the females approve of awoman obtaining an abortion for any reason.Figure 1-9You can also examine other items in thesurvey to compare men and women.Who has more education? Is the averageage at birth of first child younger forwomen than for men? Comparing meanswill answer these questions. Click onAnalyze, point your mouse to CompareMeans, and then click on Means. Yourscreen should look like Figure 1-10.Figure 1-10Now put age at birth of first child(agekdbrn) and years of school completed(educ) in the Dependent List box and sexin the Independent List box. By now youhave a good idea how to do this.Highlight agekdbrn in the list of variableson the left of the screen by pointing yourmouse at it and clicking. Then click onthe arrow next to the Dependent List box.Do the same for educ. Now highlight sexand click on the arrow next to theFigure 1-11Independent List box. This should moveagekdbrn and educ into the Dependent List box and sex into the Independent List box andyour screen should look like Figure 1-11. Then click on OK and the output should looklike Figure 1-12.
Women had their first child at an average age of 23.45years, while the average for men is 25.84 years, adifference of a little more than two years. Now look atthe mean years of school completed for men and women.There’s virtually no difference (about 0.11 of a year)between men and women.Another way of examining relationships is to look atPearson Correlation Coefficients. One might hypothesizethat respondents’ education is correlated with theeducational achievements of their parents. ThePearson Correlation Coefficient will tell us thestrength of the linear relationship betweenfather’s education, mother’s education, and therespondent’s education. The closer thecorrelation is to 1, the stronger the linearrelationship, and the closer it is to 0, the weakerthe linear relationship.Figure 1-12Point your mouse at Analyze and press themouse button. Now point your mouse atCorrelate and then click on Bivariate. Yourscreen should look like Figure 1-13.Now move the following three variables into theVariables box: educ, maeduc, and paeduc. Thesevariables refer to the number of years of schoolcompleted by the respondent and the respondent’sparents. Highlight each of these variables andclick the arrow next to the Variables box. Thescreen should look like Figure 1-14. Click on OKand the correlations will appear in your Outputbox.The strongest correlation is between father’s andmother’s education. As we predicted, there is alsoa strong correlation between respondent’seducation and parent’s education.Figure 1-13Figure 1-14Overview of ChaptersChapter 2 will acquaint you with how to enter new data into IBM SPSS using the DataEditor. Chapter 3 explains how to take your data, or preexisting data, and modify it in away that makes it easier to understand. Chapter 4 starts the sections where you really getto see the results of your work. In Chapter 4 you will learn how to look at each variable,
one at a time. We call this univariate analysis. Chapters 5 through 7 will show you howto look at two variables at a time, or what we call bivariate analysis. Chapter 5 will showyou how to create a cross tabulation. Chapter 6 shows you alternative ways of comparingtwo variables and Chapter 7 will show you how to do this using linear regressiontechniques. Chapter 8 shows you how to explore relationships among sets of variablesusing multivariate cross tabulation and multiple regression. This is called multivariateanalysis. Finally, Chapter 9 will show you how to present your data effectively and willinclude charts and tables.
After IBM SPSS loads, you may, depending on how IBM SPSS is set up, get a menu that asks, "What's new?" at the top. For this tutorial, click Close to get rid of this. Now the screen should look like Figure 1-3. The Taskbar is probably visible at the bottom of the screen. It shows an IBM SPSS icon. You can also click on this icon to open .