Transcription
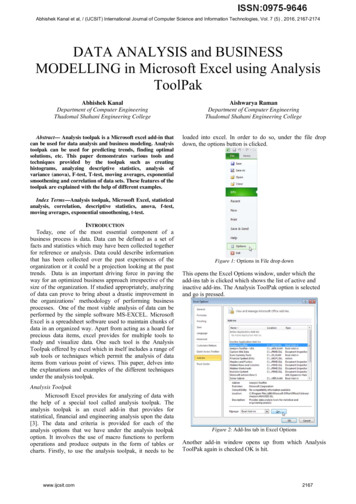
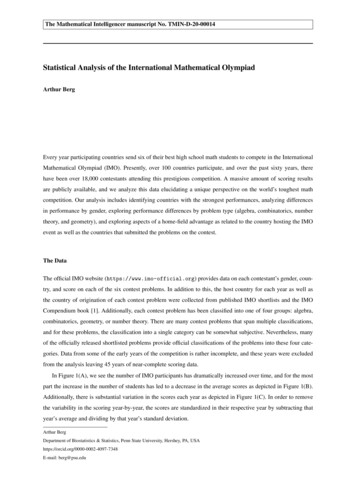
The Mathematical Intelligencer manuscript No. TMIN-D-20-00014Statistical Analysis of the International Mathematical OlympiadArthur BergEvery year participating countries send six of their best high school math students to compete in the InternationalMathematical Olympiad (IMO). Presently, over 100 countries participate, and over the past sixty years, therehave been over 18,000 contestants attending this prestigious competition. A massive amount of scoring resultsare publicly available, and we analyze this data elucidating a unique perspective on the world’s toughest mathcompetition. Our analysis includes identifying countries with the strongest performances, analyzing differencesin performance by gender, exploring performance differences by problem type (algebra, combinatorics, numbertheory, and geometry), and exploring aspects of a home-field advantage as related to the country hosting the IMOevent as well as the countries that submitted the problems on the contest.The DataThe official IMO website (https://www.imo-official.org) provides data on each contestant’s gender, country, and score on each of the six contest problems. In addition to this, the host country for each year as well asthe country of origination of each contest problem were collected from published IMO shortlists and the IMOCompendium book [1]. Additionally, each contest problem has been classified into one of four groups: algebra,combinatorics, geometry, or number theory. There are many contest problems that span multiple classifications,and for these problems, the classification into a single category can be somewhat subjective. Nevertheless, manyof the officially released shortlisted problems provide official classifications of the problems into these four categories. Data from some of the early years of the competition is rather incomplete, and these years were excludedfrom the analysis leaving 45 years of near-complete scoring data.In Figure 1(A), we see the number of IMO participants has dramatically increased over time, and for the mostpart the increase in the number of students has led to a decrease in the average scores as depicted in Figure 1(B).Additionally, there is substantial variation in the scores each year as depicted in Figure 1(C). In order to removethe variability in the scoring year-by-year, the scores are standardized in their respective year by subtracting thatyear’s average and dividing by that year’s standard deviation.Arthur BergDepartment of Biostatistics & Statistics, Penn State University, Hershey, PA, USAhttps://orcid.org/0000-0002-4097-7348E-mail: berg@psu.edu
2Arthur BergFig. 1 (A) Number of IMO participants by year. (B) Mean of the total scores (out of 42 points) by year. (C) Standard deviation of the totalscores by year.All of the raw data and R software code (tested on R version 3.6.3) used to generate the graphics, tables, andanalyses included in this manuscript are available on GitHub at https://github.com/arthurberg/IMO. Any interestedreader can easily reproduce and modify the analyses using freely available and open source software program Rwith various supporting packages.The Hardest and “Easiest” IMO ProblemsThe IMO is a two day contest in which students have 4.5 hours to solve three problems on each of the two days.By design, the first problem for each day (problems 1 and 4) are meant to be the easiest, the second problems(problems 2 and 5) are somewhat harder, and the last problems (problems 3 and 6) are intended to be the hardest.There are a number of ways one might rank the many IMO problems over the years by difficulty. This analysisproceeds by ranking the problems based on standardized scores. After standardization, participant total scores ina given year have a mean of zero and a standard deviation of one. The top 10 easiest and hardest IMO problems,sorted by standardized average scores, are listed in Table 1. Based on this metric, the all-time single most hardestand easiest problems occurred in the same year and even on the same day: day 1 of the 2017 competition. Furthermore, day 2 of that 2017 competition was just as wild with another extremely easy problem (relatively speaking)put together with another extremely hard problem (all-time second hardest problem).
Statistical Analysis of the International Mathematical Olympiad3Easiest IMO ProblemsHardest IMO ProblemsYear#CatPropStd AvgYear#CatPropStd .23Table 1 Ten easiest and hardest IMO problems based on standardized average scores. The table includes year, problem number, problemcategory (algebra, combinatorics, geometry, or number theory), proportion of students who correctly solved the problem (scored 7 points forthat problem), and standardized average score.Problems 1 and 3 of the 2017 contest are included here to give the reader a sense of the difficulty of theall-time easiest and hardest problems. All previous contest problems are provided on the official IMO ), which includes the option to download the problems in nearly sixtydifferent languages. An expansive set of short-listed problems and solutions for the past several years are alsoavailable. Solutions to older contest problems can be found in the IMO Compendium book [1].IMO 2017, Problem 1 (all-time easiest) For each integer a0 1, define the sequence a0 , a1 , a2 , . . . for n 0asan 1 anif an 3otherwise, an is an integer,for each n 0.Determine all values of a0 for which there is a number A such that an A for infinitely many values of n.IMO 2017, Problem 3 (all-time hardest) A hunter and an invisible rabbit play a game in the Euclideanplane. The rabbit’s starting point, A0 , and the hunter’s starting point, B0 , are the same. After n 1 rounds ofthe game, the rabbit is at point An 1 and the hunter is at point Bn 1 . In the nth round of the game, three thingsoccur in order.(i) The rabbit moves invisibly to a point An such that the distance between An 1 and An is exactly 1.(ii) A tracking device reports a point Pn to the hunter. The only guarantee provided by the tracking device isthat the distance between Pn and An is at most 1.(iii) The hunter moves visibly to a point Bn such that the distance between Bn 1 and Bn is exactly 1.Is it always possible, no matter how the rabbit moves, and no matter what points are reported by thetracking device, for the hunter to choose her moves so that after 109 rounds she can ensure that the distancebetween her and the rabbit is at most 100?
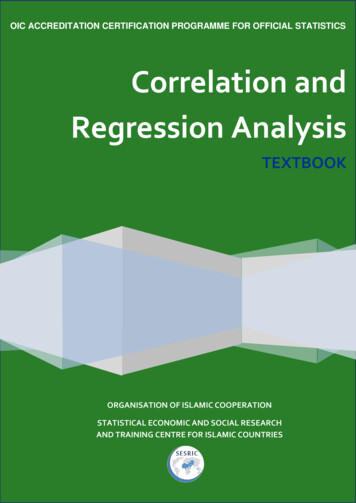
4Arthur BergAnalysis by CountryNow we seek to determine the countries with the best overall scores. Recently, each country may send up tosix student participants to represent their country at the IMO. In the early years of IMO, IMO teams consistedof 8 participants from each country with a relatively small number of countries participating. This analysis onlyconsiders IMO results since 1984 in which a six-member team has been standard.For each year a country-specific standardized score is calculated by averaging the 36 standardized questionscores for each country (6 scores per participant, 6 participants per team). These country or team-based scores arenot calculated for any years a country may have sent fewer than six participants. These scores are then averagedover the years in which the respective teams participated in the IMO. The top 15 countries ranked by overallperformance are listed in Table 2, which also includes the number of years that country was considered in theanalysis as well as the current population of the respective countries. Data from the Soviet Union, which dissolvedin 1991, has been excluded from this analysis. Similarly, data from East Germany, which reunited with Germanyin 1990, is also excluded.Table 2 shows a clear separation between the top three countries – China, Russia, and United States – and therest. It is also noted that Romania, Bulgaria, and Hungary all did quite well given that their populations are allunder 20 million, which suggests a rich tradition of high-level mathematical problem solving in these countries.Std Score# of YearsCurrent Pop (in millions)China11.32331439Russia9.2328146United States9.1836331South Korea7.063251Romania6.803619North raine4.972744Germany4.933684United Kingdom3.963668Table 2 The top 15 countries ranked by overall performance on the IMO.Figure 2 shows country-level performances by year for the top six countries. China has dominated the competition over the past 20 years though in recent years USA has pulled ahead. South Korea has substantially improvedits performance since 1990 and just barely missed first place in 2019 by only one point; USA and China tied forfirst with 227 points each in this most recent contest. This record is particularly impressive when considering thatthe USA and China populations are more than 6 times and 26 times, respectively, that of South Korea.
Statistical Analysis of the International Mathematical Olympiad5North Korea, ranked 6th with only 12 years of data, also demonstrated improved performance since 1990, buttheir record has been marred with various scandals. In particular, their scores were disqualified in 1991 and 2010due to suspected cheating. More recently, in 2017 and 2018, North Korea did not participate in the IMO, whichis presumably in response to the actions of one of their participants in 2016 – Jong Yol-ri – who fled to the SouthKorean consulate while attending the IMO in Hong Kong. Politics and controversy aside, these North Koreanparticipants are surely highly skilled in problem solving.The USA team’s performance in 1994 is of particular interest as all six members scored a perfect score thatyear (hence yielding a team total of 6*6*7 252 points). This is the only time all team members scored perfectscores, and it’s unlikely to be repeated though in 1987 Romania had a near-perfect team with a total score of250. Even though the USA team did so remarkably well in 1994, their performance does not stand out as beingspectacular in Figure 2 as the overall average that year was relatively high. In contrast, although the USA’s teamscore in 1996 was only 185 (placing second that year behind Romania), their relative performance that year waseven higher than in 1994 due to the increased difficulty of the 1996 problems.Fig. 2 Country-level performances by year for the top six countries.Analysis by Problem TypeNow we explore how countries perform relative to the four main problem types: algebra, combinatorics, geometry,and number theory. Figure 3(A) shows the distribution of standardized scores by problem type (algebra, combinatorics, geometry, and number theory), which on the surface suggests that students tend to perform better ongeometry problems; however, this is simply an artifact of Simpson’s paradox. The mosaic plot in Figure 3 showsthat in fact geometry problems tend to occur more frequently among the easiest problems (problems 1 and 4)and less frequently among the hardest problems (problems 3 and 6). Similarly, though it is not quite as extreme,combinatorics problems tend to occur more frequently among the hardest problems and less frequently among theeasiest problems.
6Arthur BergFig. 3 (A) Boxplots and distributions of standardized scores by problem type showing slightly higher scores on geometry problems. (B)Mosaic plot showing geometry problems occur more frequently as the first problem and less frequently as the last problem.In order to give each problem equal weighting, the scores are subsequently standardized by year and problemnumber (as opposed to just year). This normalizes out the varying difficulty among the problems and allows us toexplore if certain countries do better or worse with certain problem types. As in the previous section, here we onlyconsider IMO results since 1984 in which a six-member team has been standard.We used analysis of variance to quantify the overall differences in performance of each country with respect toproblem type. Based on this analysis, we report the 15 countries with the most differing scores based on problemtype in Table 3. This table provides the average standardized score for each problem type and the number ofproblems included in calculating the average. Problem types with the highest and lowest averages are highlightedin blue and orange, respectively, for each country. We notice the rather interesting phenomenon that countries tendto do either really well on geometry problems and poorly on combinatorics problems or the other way around.AlgComGeoNump-valueGreece-0.39 (51)-0.56 (50)0.34 (60)-0.40 (49)4.7e-13Norway-0.66 (49)-0.18 (46)-0.92 (57)-0.44 (46)7.5e-11Finland-0.56 (53)-0.42 (52)-1.00 (62)-0.55 (49)2e-08Azerbaijan-0.49 (32)-1.00 (33)-0.18 (39)-0.25 (28)2.5e-08Vietnam1.20 (53)0.48 (52)1.30 (62)1.00 (49)4.1e-07Tajikistan-0.52 (16)-0.79 (18)0.32 (19)-0.42 (13)4.6e-07Sweden-0.240 (53)-0.049 (52)-0.650 (62)-0.350 (49)2.6e-06Denmark-0.51 (35)-0.18 (35)-0.86 (44)-0.70 (30)6.9e-06Morocco-0.37 (45)-1.00 (44)-0.62 (54)-0.70 (43)8.8e-06Cuba-0.750 (21)-0.710 (23)0.057 (23)-0.540 (17)1.5e-05-0.35 (16)-0.99 (13)0.29 (19)-0.38 (12)2.7e-05UzbekistanIceland-0.91 (33)-0.63 (36)-1.10 (43)-0.96 (32)6.1e-05Peru0.100 (28)-0.390 (33)0.490 (35)0.039 (24)6.9e-05United Kingdom0.75 (53)0.85 (52)0.30 (62)0.77 (49)0.00015Romania1.30 (53)0.79 (52)1.00 (62)1.30 (49)0.00025Table 3 Top 15 countries with the most differing scores based on problem type. Average standardized scores for each problem type isfollowed by the number of problems included in calculating the average in parenthesis. Problem types with the highest and lowest averagesare highlighted in blue and orange, respectively, for each country.
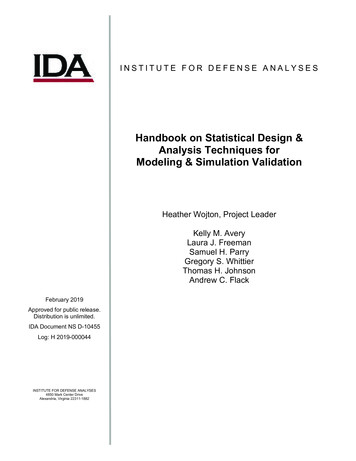
Statistical Analysis of the International Mathematical Olympiad7To delve a little further, we highlight the profiles of three countries – Greece, Norway, and the United Statesof America – and visualize the strengths and weaknesses of these countries over time in Figure 4. Greece’s performance on geometry problems is clearly much stronger than the other problem types, which may be attributed toGreece’s rich heritage in classical geometry having left a lasting influence on the country. Norwegian contestants,on the other hand, consistently perform the best on combinatorics problems. The USA contestants historicallyperformed rather poorly on geometry problems; however, in recent years geometry has been their strength.Fig. 4 Performance over time by problem type for three selected countries.Home Advantage?Each year one of the participating countries serves as the host for the competition, and now we investigate whetheror not there is a home advantage associated with being host. For this analysis, we keep the same standardizationas in the previous section – scores are standardized within each year and problem number.The data is aggregated into a data frame consisting of 2368 rows containing the year, country, standardizedscore, and a binary variable indicating if the country in the given year was also the host country for that year.Equation (1) displays the regression equation that was fit to the data with an adjusted R2 of 0.85.Score Host.Indicator Country (Year Year2 )(1)Based on this model, hosting the IMO was found to increase the host country’s total score (out of 252 possiblepoints), on average, by about 9.4 points or about 9.8%; this effect is statistically significant with a p-value 0.0053.Although statistically significant, there is still substantial variation in which the host country performs considerablybetter some years and considerably worse other years. Figure 5 demonstrates this disparity with three selectedcountries – China, Russia, and the United States – with China having one of its best years as host, Russia havingone if its worst years as host, and the United States having a better-than-average year as host.
8Arthur BergFig. 5 Being host is found, on average, to be associated with higher scores of the host country, but there is substantial variability with thehome-turf advantage.We similarly explore the possibility of a “home advantage” with regard to the country of origination of thecontest problems. That is, we consider whether a given country’s team scores better on contest problems proposedby their country. The data is aggregated into a data frame consisting of 14,208 rows containing the year, country,problem number, standardized score, and a binary variable indicating if the problem was submitted by the countrycorresponding to that row. Equation (2) displays the regression equation that was fit to the data with an adjustedR2 of 0.57.Score Submission.Indicator Country (Year Year2 )(2)Again, a statistically significant “home advantage” is found in that countries that provided the problem scored16% better, on average, than what they would have scored otherwise; the p-value associated with this variable is0.0004.The data is too sparse to attempt to identify a significant home advantage for any particular host country;however, some countries have had several problems included on the IMO, which allows us to explore the effectof a home advantage for these individual countries. Only 14 countries (AUS, BGR, CZE, FRA, GBR, GER, IND,IRN, KOR, NET, POL, ROM, RUS, and USA) had at least 5 problem submissions on the IMO, and we limit thisanalysis to just these countries. For each country we assessed the problem contribution home advantage on eachcountry’s score. As we are conducting 14 tests, we impose a Bonferonni correction on the standard 5% type-1error rate, which leads to 0.05/14 0.0036 as the p-value threshold for statistical significance. Only one country– Bulgaria – was found to have a statistically significant home advantage with a p-value 0.0028; the secondsmallest p-value is 0.093 (not even surpassing the unadjusted 0.05 level of significance). Figure 6 takes a closerlook at Bulgaria’s team scores. This figure demonstrates Bulgaria’s exceptional performance on the two problemsit contributed in 1998 and 2001 (the sixth problem for both years). Bulgaria also had a truly exceptional year in2003 (highlighted in yellow) in which they placed first in the IMO. The second problem on that year’s contest wascontributed by Bulgaria.
Statistical Analysis of the International Mathematical Olympiad9Fig. 6 Bulgaria’s performance on individual problems. Problems that Bulgaria contributed are differentiated. Bulgaria’s first place performancein 2003 is also highlighted.Gender DifferencesAs a final analysis of the IMO data, gender patterns are explored. The proportion of female participants hasbeen gradually increasing over the years, but unfortunately current participation rates are only around 10%. If themathematical sciences are to remain a vibrant choice for our students, the engagement of women at much higherrates is critical.Figure 7 depicts the proportion of female participants by country. The intensity of the colors correspond tothe total number of participants; e.g. many African countries only recently started participating in the IMO asindicated by their less intense colors. Poland (1.5%), Japan (1.7%) and the United States (2.0%) are among thecountries with the lowest proportion of female participants. Countries with a long history of participation in theIMO and that have highest proportions of female participants tend to be from Southern and Northern Europe,including North Macedonia (21%), Bosnia and Herzegovina (19.5%), Slovenia (17%), Latvia (15.2%), Croatia(14.2%), Ireland (13.5%), Estonia (13.5%), and Iceland (13.0%).
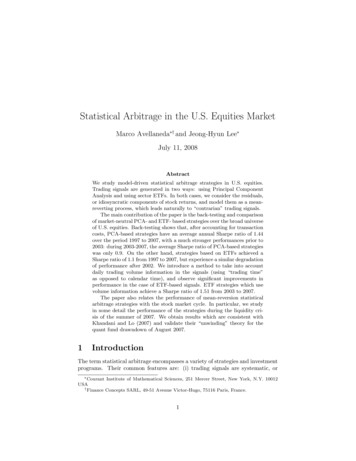
10Arthur BergFig. 7 Countries are colored according to their overall proportion of female participants in the IMO. The opacity of the colors increases as thetotal number of participants decreases.Figure 8 depicts standardized scores stratified by problem category and gender. These scores have been standardized for each problem so that individual problem difficulties have been normalized out. Male scores fallslightly above female scores for each category, but the difference is least pronounced for geometry.Fig. 8 Standardized scores depicted in violin plots with 25%, 50%, and 75% quantiles marked by horizontal lines and stratified by problemcategory and gender. Female participants do much better on geometry problems relative to other problem types.Equation (2) displays the regression equation that was fit to the data with an adjusted R2 of 0.26. Note thattotal contest scores and scores averaged over all players on a team will have less random variation of individual
Statistical Analysis of the International Mathematical Olympiad11question scores, which explains why this adjusted R2 value is somewhat lower than the other model fits.Score Gender Problem.Type Country (Year Year2 )(3)Another model as in (3) was fit but with just additive terms for gender and problem type without an interactionterm. Comparing the two model fits by analysis of variance showed the addition of the interaction term madethe model fit substantially strong with a p-value 7.7 10 6 . As seen in Figure 8, the interaction is dominated bythe geometry problem type – the female participants do much better on these problem types, whereas the maleparticipants also do slightly better but nothing to the degree of the female participants.As a final comment on gender, we take a look at the “Hall of Fame” as published on the imo-official.orgwebsite, which is a ranking of IMO participants by medal count. Although only three female students are amongthe top 100 on this list, one of those students, Lisa Sauermann, sits quite near the top at #3 having the impressiverecord of scoring four gold medals and one silver medal for Germany, including one year with a perfect score.This is certainly an inspirational example to any aspiring mathematics student.DiscussionIn this analysis, we identified some interesting statistics and patterns from IMO contest data. The 2017 problemshad both the easiest and hardest IMO problems of all time, and there seems to be a general trend in the recentyears that the easy problems are a little easier compared to years past and the hard problems are a little hardercompared to years past. We also found that problems 1 and 4, which are generally the easiest problems on the test,are most likely to be a geometry problem. We also showed that countries demonstrated differential performanceby problem type with Greece’s strength in geometry representing one of the most extreme examples. The USAearly on was weaker in geometry compared to the other problem types, but in recent years geometry has been theirforte. China, Russia, and the USA have the strongest teams overall with China being the historic powerhouse butwith the USA edging out in front in the past few years. There does seem to be a home advantage; that is, hostingthe IMO is associated with a slight advantage by improving the host country’s team score by approximately9.4 points on average. Similarly, a problem written by from one’s own country is associated with slightly betterperformance on that problem. Finally, an analysis of gender differences shows that females are underrepresentedin this competition, and they tend to do relatively better on geometry problems compared to other problem types.Acknowledgements The author appreciates the careful and detailed anonymous reviewer comments that led to a much improved manuscript.The author appreciates the efforts of Dr. Huamei Dong who helped with classifying the problems and Angelina Berg who provided editorialsupport.References1. Djukić, Dušan, Vladimir Janković, Ivan Matić, and Nikola Petrović. The IMO Compendium: A Collection of Problems Suggested for theInternational Mathematical Olympiads: 1959-2009 Second Edition. Springer Science & Business Media (2011).
The Mathematical Intelligencer manuscript No. TMIN-D-20-00014 Statistical Analysis of the International Mathematical Olympiad Arthur Berg Every year participating countries send six of their best high school math students to compete in the International Mathematical Olympiad (IMO). Present