Transcription
Victims of Crime ActVictim CompensationFormula Grant ProgramFiscal Year 2015 Data Analysis ReportMarch 2017Prepared forOffice for Victims of CrimePrepared byCSR, IncorporatedThis report was produced by CSR, Inc. under contract number GS-00F-219CA awarded by the Office of JusticePrograms, U.S. Department of Justice.
Victim Compensation Formula Grant Program Fiscal Year 2015 Data Analysis ReportTable of ContentsI. Introduction .2Victims of Crime Act Victim Compensation Formula Grant Program . 2Revising the Victim Compensation State Performance Report . 2Opportunities and Limitations of the Data . 2II. Population Characteristics: Who Sought Victim Compensation? .3Victim Compensation Applicants . 3Victim Demographics. 4Race and ethnicity . 5Gender . 7Age . 8III. The Victim Compensation Application Process .10Application Procedures . 10Victim satisfaction . 10Applications Received. 10Application Outcomes . 12Applications approved . 12Applications denied or closed . 12Sexual Assault Forensic Exams. 14SAFE applications received . 14SAFE expenditures . 15Improving the Process . 15Grantee efforts to improve Victim Compensation . 15IV. Payment Statistics .16Number of Claims Paid by Crime Type . 17Amount Paid by Crime Type . 18Amount Paid by Expense Type . 20Payment Statistics by Crime Type . 21Assault . 21Child abuse . 22Homicide . 23Sexual assault . 24Victimization Types. 25Domestic and family violence . 25Emerging victimization trends . 27Bullying. 27Elder abuse and neglect . 28Hate crimes . 28Mass violence . 28V. Conclusion .29Appendix: Payment Statistics .31March 20171
Victim Compensation Formula Grant Program Fiscal Year 2015 Data Analysis ReportI. IntroductionVictims of Crime Act Victim Compensation Formula Grant ProgramSince its establishment by the Victims of Crime Act (VOCA) in 1984, the Crime Victims Fund hassupported critical victim services nationwide. Through the VOCA Victim Compensation FormulaGrant Program, the Office for Victims of Crime (OVC) administers millions of dollars from theFund for crime victim compensation programs in all 50 states, the District of Columbia, the U.S.Virgin Islands, and the Commonwealth of Puerto Rico. These programs make payments to or onbehalf of crime victims for expenses related to their victimization, such as medical costs, funeraland burial costs, mental health counseling, and lost wages or loss of support.Revising the Victim Compensation State Performance ReportOVC collects performance data from its Victim Compensation grantees to quantify andcommunicate its progress toward meeting its objectives at the national level. In 2013, OVCinitiated a review of its performance measures and processes for collecting and analyzingperformance data for its State Formula Grant programs. With input from VOCA VictimCompensation administrators and other key stakeholders, OVC revised the program’sperformance measures and data collection protocols to better understand the impact of VOCAfunding on crime victims. In March 2015, OVC released the revised State Performance Reportquestionnaire for the Victim Compensation program and launched a quarterly Web-based datacollection process via the Performance Measurement Tool (PMT).Of the 53 recipients of Victim Compensation Formula Grant funds, all but 1—the VirginIslands—submitted performance data for federal fiscal year (FY) 2015. This report analyzes thedata received from those 52 grantees in the inaugural year of data collection using the revisedState Performance Report questionnaire.Opportunities and Limitations of the DataThis new and expanded data collection initiative offers exciting opportunities for betterunderstanding the Victim Compensation program and the people it serves. However, the datagathered for FY 2015 must be interpreted with care. Because the revised questionnaire requiresmore detailed information than the previous questionnaire, many grantees were not yet able toreport all data as requested. Collecting data on demographics and payment statistics proved tobe especially problematic for FY 2015. Some grantees had not been tracking this information atall; others had been tracking it using categories different from those OVC requested. Granteeswho did not track data within the categories the questionnaire provided were permitted toreport that information as “Not Tracked” for FY 2015. This represents a temporary hurdle indata collection, and it is expected that all grantees will eventually be able to report within therequested categories. To prevent outliers from skewing the data, this report excludes from itsanalyses any grantees who did not track the variable in question during the entire year.Additional limitations of the data, specific to each section, are noted throughout the report.March 20172
Victim Compensation Formula Grant Program Fiscal Year 2015 Data Analysis ReportII. Population Characteristics: Who Sought VictimCompensation?In previous years, OVC knew relatively little about the people who applied for victimcompensation. Until now, the agency could not even capture the total count of people whosought benefits—only the number of claims received. OVC knew even less about thecharacteristics of those applicants, tracking only the number of victims who fell within threebroad age groups. In revising the State Performance Report questionnaire, OVC sought first andforemost to better understand the state applicant population. By counting applicants, OVCgains a new way to measure the reach of compensation programs. By counting everyoneincluded on victim compensation applications, not just the people whose victimization was thebasis for those applications, OVC learns more about how victims and their families seek helpafter experiencing crime. And by gathering more detailed demographic data, OVC becomesbetter informed about the diversity of victimcompensation needs.A Note on LanguageVictim Compensation ApplicantsOVC is sensitive to the ways in whichThe most important purpose of victim compensationprograms is to support people directly victimized byviolent crime. Many programs, however, alsocompensate family members, witnesses, and otherswho require support following another person’svictimization. This reflects a fundamental truth aboutvictimization: a single crime can touch many lives. Ahomicide victim may leave behind a family grapplingwith not only the emotional toll of their loss but alsofuneral expenses and medical bills that are even moredifficult to afford with the loss of a financial provider.Children who witness a parent’s ongoing abuse maysuffer profound psychological trauma, even if theythemselves are never physically injured. By extendingfinancial support to victims and others affected by theirvictimization, compensation programs can do a greatdeal to alleviate the far-reaching costs of crime.labels can impact people by affirming orTo better understand how victim compensationprograms serve victims and their families, OVCrequested a count of victims whose victimization wasthe basis for the applications submitted and a count ofall people included on those applications.of any person whose life is touched byMarch 2017diminishing their experiences, and thiscan be especially problematic whendescribing victims of crime. OVCrecognizes that exposure to the traumaassociated with victimization in any formcan have a direct and devastating impacton people’s lives. For this reason, thisreport avoids use of phrases such as“direct and indirect victims” or “primaryand secondary victims” wheneverpossible, except where required forclarity. When using these terms, it is notOVC’s intention to minimize the traumacrime but rather to describe the diversegroup of people whose experiences leadthem to seek victim compensation.3
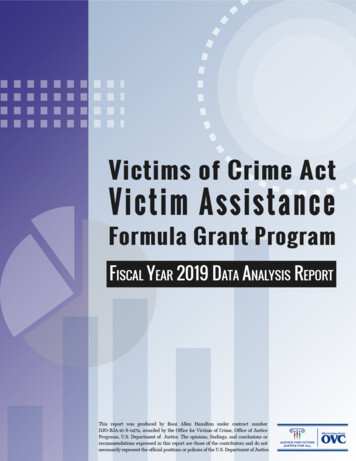
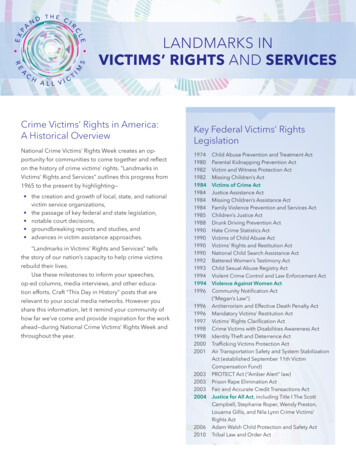
Victim Compensation Formula Grant Program Fiscal Year 2015 Data Analysis ReportFigure 1. Victim Compensation 196,057Others who mayreceive benefitsVictims whosevictimization wasthe basis for theapplicationssubmittedTotal applicants:249,6620As shown in Figure 1, nearly 250,000 people applied forVictim Compensation benefits in FY 2015. Of the 249,662total applicants, 196,057 victims provided the basis forthe applications submitted. The remaining 53,605 peopleincluded family members, witnesses, and survivors whosought support. This group constituted more than 20percent of all victim compensation applicants,underscoring the significance of compensation benefits tothe many people in victims’ lives.Notes on the DataBoth the total count of applicants andthe count of “others who may receivebenefits” are almost certainlyundercounts, as at least one granteecould not yet report all people listed onvictim compensation applications in FYVictim Demographics2015. In reality, this group likelyFor the first time, victim compensation programs havereported extensive data to OVC on the demographiccharacteristics of the victims who applied forcompensation benefits. The revised State PerformanceReport questionnaire captures the race and ethnicity,gender, and age of each person whose victimization wasthe basis for the applications received. These new dataoffer unprecedented insight into the characteristics of thevictim population requesting benefits. With thisknowledge, OVC and its grantees can be better informedabout underserved groups and potential gaps in services.constituted a larger percentage of theAlthough many grantees already tracked demographicdata prior to OVC’s revision of the State PerformanceReport, some were not yet able to report within thecategories requested for FY 2015, and others were unableseparately, making it difficult toMarch 2017applicant pool.Given the realities of the victimcompensation application process, thoseincluded in the count of “victims” maynot exclusively represent people whowere “directly” victimized by a crime. Insome cases, witnesses, family members,and survivors may apply for benefitsaccurately distinguish between victim“types.”4
Victim Compensation Formula Grant Program Fiscal Year 2015 Data Analysis Reportto report any demographic data at all. Each analysis in this section includes only grantees thatwere able to track some or all of the demographic categories OVC requested. Each analysis alsoincludes some victims who chose not to self-report their demographic characteristics. Inaddition, this demographic profile likely excludes many victims who submitted applications forsexual assault forensic exams (SAFE), as grantees who reimburse third-party providers for thoseexams often cannot track the characteristics of the victims who receive them. For thesereasons, the figures presented here probably undercount the true number of victims in eachdemographic category.Because FY 2015 data are preliminary and do not represent the full population of victimsapplying for compensation, it is not yet possible to reach firm conclusions about thedemographic makeup of the victims who applied for benefits. Once all grantees are able toreport victim demographics as requested, OVC will compare these data to other sources ofvictimization data, such as the National Crime Victimization Survey, to determine whethercompensation data might reflect broader trends.Race and ethnicityFY 2015 data provide the first glimpse into the racial andethnic makeup of the victim population applying forvictim compensation benefits. The victims voluntarilyself-report this data on their applications. For FY 2015,these data are rudimentary: race and ethnicityinformation is missing for more than half (52 percent) ofall victims who applied for benefits, either because theydid not self-report (24,011 victims) or because theirstate or territory did not yet track their race or ethnicitycategory as requested (77,586 victims). Efforts areunderway to improve data collection processes, andOVC expects that data gathered in future reportingperiods will be much more comprehensive.Only 11 grantees reported that they could not yet trackany race or ethnicity data at all. These grantees areexcluded from this analysis so as to focus on the trendsthat emerged among the 41 grantees that were able totrack at least some categories in 1 or more quarters. Thismeans, however, that only 61 percent of all victims whoapplied for benefits in FY 2015 and self-reported theirdemographics are represented here, so all observationsare preliminary.Notes on the DataThese demographic data represent thepopulation that sought benefits, not thepopulation that ultimately receivedbenefits. Also, because many granteesare only able to collect demographicinformation on the people whosevictimization is the basis for theapplications received, these data do notreflect all people included on thoseapplications. This is especially significantfor applications involving deceasedvictims. They are captured in thisdemographic profile, but their livingbeneficiaries are not.Although not all of the grantees were able to track all race and ethnicity categories asrequested throughout the year, only a few victims (1,669 victims, or 1.4 percent) fell intocategories that were not tracked. The categories grantees most frequently did not track wereAsian, Native Hawaiian/Other Pacific Islander, Multiple Races, and Some Other Race.March 20175
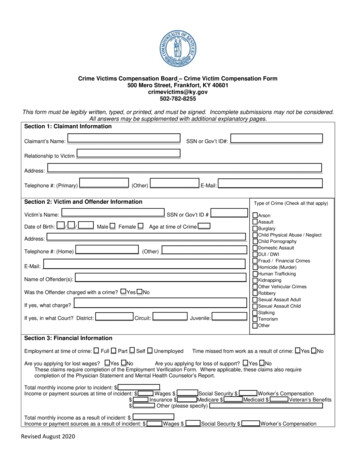
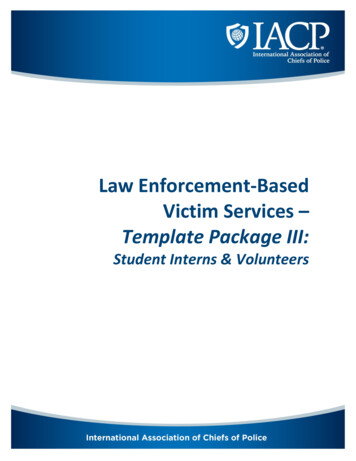
Victim Compensation Formula Grant Program Fiscal Year 2015 Data Analysis ReportHowever, a full 20 percent of all victims included in this analysis did not report their race orethnicity. Although nonreporting affected all but three grantees, it was a much greater problemfor some. Five reported that more than half of their applicants had not self-reported their raceor ethnicity; for two, the proportion was more than 70 percent. Fortunately, nearly half of the41 grantees who tracked race and ethnicity experienced nonreporting rates of less than 10percent. Nonetheless, even low nonreporting rates interfere with data quality, potentiallyobscuring key information about the victim population and preventing compensation programsfrom serving those victims to the best of their ability. It is particularly problematic if certainvictims’ characteristics are preventing them from reporting their race and ethnicity. It may be,for instance, that victims belonging to demographic minorities are hesitant to report their raceor ethnicity for fear of discrimination. It may also be that some victims are submitting outdatedapplications that do not request demographic data because they have limited access to theirvictim compensation office or the Internet. Because these are factors that can be difficult forgrantees to counteract, high nonreporting rates may persist even as grantees improve theirability to track demographic categories as requested by OVC.Figure 2. Race/Ethnicity of Victims Applying for Compensation; N 41White Non-Latino/Caucasian23%32%Black/African AmericanRace Not ReportedHispanic or LatinoSome Other RaceAsian0.3%0.4%20%American Indian/Alaska Native1.4%1.4%Race Not Tracked2%2%18%Multiple Races/EthnicitiesNative Hawaiian and Other Pacific IslanderFigure 2 and Table 1 show that among victims who reported their race and/or ethnicity, WhiteNon-Latinos constituted the largest share, at 32 percent (38,715 applicants). 1 African Americansrepresented the next largest share, at 23 percent (28,031 applicants), and Latinos representedthe third-largest share, at 18 percent (21,381 applicants). Asians, American Indians/AlaskaNatives, and Native Hawaiians/Other Pacific Islanders each constituted less than 2 percent ofthe applicant population. Only 532 applicants—less than 1 percent—self-identified as MultipleRaces/Ethnicities.1Because there is a separate category for “Hispanic or Latino,” all racial categories listed imply “non-Hispanic.”Although “Hispanic or Latino” represents an ethnicity, a victim who self-reports as both Hispanic or Latino and aspecific race is counted in the “Multiple Races” category.March 20176
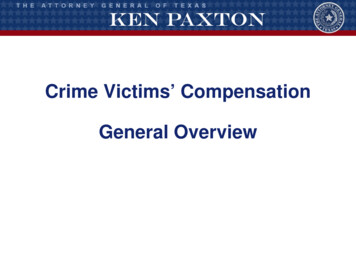
Victim Compensation Formula Grant Program Fiscal Year 2015 Data Analysis ReportTable 1. Number of Victims Applying forCompensation by Race/EthnicityRace/EthnicityVictimsAmerican Indian/Alaska Native1,668Asian1,828Black/African American28,031Hispanic or Latino21,381Native Hawaiian/Other Pacific Islander340White Non-Latino/Caucasian38,715Some Other Race1,965Multiple Races/Ethnicities532Not Reported24,011Not Tracked*1,669TOTAL120,140* Among 41 grantees who tracked race/ethnicity data in 1 ormore reporting periodsGenderIn addition to race and ethnicity, the revised questionnaire captures the number of victims whoself-report as either male or female, illustrated in Table 2.Figure 3. Gender of Victims Applying forCompensation; N Gender Not Reported58%Gender Not Tracked0.9%Table 2. Number of VictimsApplying for Compensation byGenderNot Reported1,422Not Tracked*305TOTAL157,351* Among 44 grantees who tracked genderdata in one or more reporting periods0.2%This analysis omits the eight grantees that were unable to track any gender data as requested inFY 2015; as a result, only 80 percent of all victims who applied for benefits are represented here(reported by 44 grantees). Less than 1 percent of these victims did not report their gender (seeFigure 3).March 20177
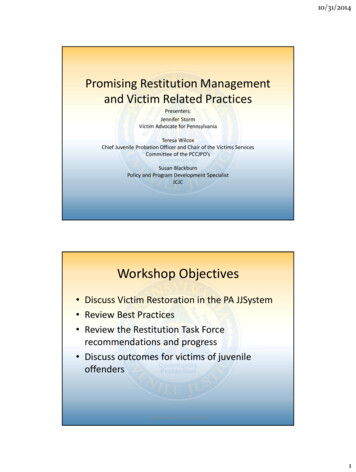
Victim Compensation Formula Grant Program Fiscal Year 2015 Data Analysis ReportAs with race and ethnicity data for FY 2015, these datacan provide only a preliminary look at the gender makeupof the victim population applying for compensation.However, this first glimpse suggests that the majority ofvictims applying for victim compensation are female.Once more comprehensive gender data have beengathered in future reporting periods, much can be learnedby comparing this trend to national trends onvictimization rates by gender for the crime types includedin the questionnaire.Notes on the DataBased on feedback from grantees onthe data available to them, OVC choseto limit its gender categories to“male” and “female.”AgeAlthough the original State Performance Report questionnaire captured some age data, therevised version expands these age categories to capture more meaningful data about thevictims who seek compensation benefits. Previously, OVC could distinguish only betweenvictims aged 17 and younger, aged 18 to 64, and aged 65 and older. Now, the questionnairedistinguishes between children (0 to 12), teens (13 to 17), young adults (18 to 24), adults (25 to59), and elders (60 and older). These categories are consistent with those used by the Office onViolence Against Women and the U.S. Department of Health and Human Services,Administration on Children and Families, Family and Youth Services Bureau, Division of FamilyViolence Prevention and Services2, except for the additional distinction that OVC makesbetween children and teens. “Age” is defined as “age at the time of victimization.” Table 3provides a breakdown of the number of victims applying for compensation by age.Nine grantees who were unable to track any age data as requested in FY 2015 are excludedfrom this analysis, so only 79 percent of all victims who applied for benefits (as reported by 43grantees) are represented in Figure 4.Figure 4. Victims Applying forCompensation by Age; N 435%3% 4%16%11%46%15%Table 3. Number of Victims Applyingfor Compensation by AgeAgeVictims0 to 1225,3210 to 1213 to 1716,15913 to 1718 to 2423,00618 to 2425 to 5971,97525 to 5960 and older7,97060 and OlderNot Reported4,723Age Not ReportedNot Tracked*6,398Age Not TrackedTOTAL155,552* Among 43 grantees who tracked age data inone or more reporting nce-prevention-servicesMarch 20178
Victim Compensation Formula Grant Program Fiscal Year 2015 Data Analysis ReportThese preliminary findings indicate, unsurprisingly, that the largest share of victim applicants(46 percent) fell within the broadest age category, aged 25 to 59. Youth aged 17 and youngerconstituted more than a quarter of the applicant population, and more than half of those youthwere aged 12 and younger. Five percent (7,970 applicants) were aged 60 and older. Only 3percent did not self-report their age.Future analyses may compare these statistics to the known victim population to identifywhether any age groups are under- or overrepresented and whether members of the agegroups most often victimized are those who most often seek compensation.March 20179
Victim Compensation Formula Grant Program Fiscal Year 2015 Data Analysis ReportIII. The Victim Compensation Application ProcessApplication ProceduresLike the original State Performance Report questionnaire, the revised version counts thenumber of new claims received and differentiates between two possible applicationprocedures. Grantees are asked to identify whether a) one application is usually counted percrime or b) victims and indirect victims generally count as separate applications. By a smallmargin, a majority of grantees typically accept separate applications for victims and familymembers or others who may seek benefits (see Figure 5).Figure 5. Victim Compensation Application Procedure40%60%Only one application isusually counted per crimeVictims and indirect victimsgenerally count as separateapplicationsVictim satisfactionGrantees were also asked whether they distribute victim satisfaction surveys. Those who do sowere encouraged to report the number of surveys distributed, the number completed, and thenumber of victims who indicated satisfaction with the victim compensation program that year.Fourteen grantees (27 percent) reported that they distribute victim satisfaction surveys. Twelveprovided survey completion and victim satisfaction rates. Excluding one state that distributedonly two surveys and achieved a 100-percent completion rate, the grantee with the highestcompletion rate was 21 percent. Overall, the completion rate was just 8 percent. Satisfactionrates among the victims who completed surveys ranged from 87–100 percent across these 12grantees, with an overall satisfaction rate of 93 percent. Although this data indicates fairly highvictim satisfaction for victim compensation programs, it represents too small a sample ofvictims served to be trusted as an indicator of program performance.Applications ReceivedLike the original State Performance Report questionnaire, the revised questionnaire asksgrantees to provide the total number of new applications received, which includes all thosereceived since the end of the last reporting period. This offers another way of measuring theMarch 201710
Victim Compensation Formula Grant Program Fiscal Year 2015 Data Analysis Reportvolume of compensation benefits sought by victims, complementing the total count ofapplicants that OVC now also tracks.Although this number does not include applications made solely or primarily for payment ofSAFEs—which are counted in another section of the questionnaire—Figure 6 combines thesetwo numbers to determine the total count of all new applications received in FY 2015.300,000250,000Figure 6. New Applications Received61,846200,000Additional applicationsreceived for sexualassault forensic exams150,000New applicationsreceived100,000216,954Total applications:278,80050,0000The count of applications received is one of the performance measures that may reasonably becompared to previous years, as this information was collected in the past. However, there is noguarantee that this measure gathers precisely the same data as before.The 216,954 applications received through grantees’ standard procedures in FY 2015 representa very slight increase from the 216,759 applications reported in FY 2014. 3 However, the 61,846application count for SAFEs that were received through a separate process is slightly lower thanthe 62,108 application count reported in FY 2014. 4 Overall, the trend with FY 2015’s combinedtotal count of 278,800 applications received is essentially flat when compared against FY 2014’stotal count of 278,867. 5At the end of the fiscal year, grantees were asked to explain any significant change in thenumber of applications received during the reporting period. Thirty grantees reported nosignificant change. Five reported an increase in claims received, and most attributed this to theimplementation of their programs’ expansion and outreach projects. In New Mexico, forinstance, an extensive outreach program led to a 10-percent increase in claims received.3http://ojp.gov/ovc/grants/vocanpr vc14.htmlIbid.5Ibid.4March 201711
Victim Compensation Formula Grant Program Fiscal Year 2015 Data Analysis ReportGrantees also attributed their influx of claims to an expansion of the crime types reported. InConnecticut, sexual assault cases have increased by 52 percent since last year due to anamendment to victim compensation statutes that now permits the agency to conclude that acrime took place if there is documentation that a victim disclosed a sexual assault toprofessionals. Georgia saw a similar increase in applications after it began funding a portion ofthe cost for forensic interviews. Nebraska attributed its increase in applications to improvedcommunication between State Victim Assistance programs.Meanwhile, 17 grantees reported a decrease in claims. Many attributed this largely to theAffordable Care Act and Medicaid expansion. Others suggested it may be the result of adecrease in violent crime.Application OutcomesApplications approvedVictim Compensation programs nationwide app
Victim Compensation Formula Grant Program Fiscal Year 2015 Data Analysis Report March 2017 . 2 . I. Introduction. Victims of Crime Act Victim Compensation Formula Grant Program . Since its establishment by the Victims of Crime Act (VOCA) in 1984, the Crime Victims Fund has supported critical victim services nationwide.