Transcription
Blueprint for Academic Excellencein the University of South CarolinaSchool of Medicine (SOM)2013-201425 February 20131
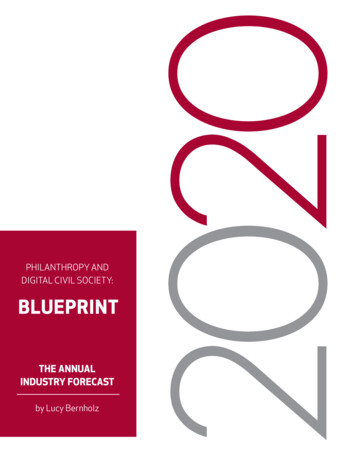
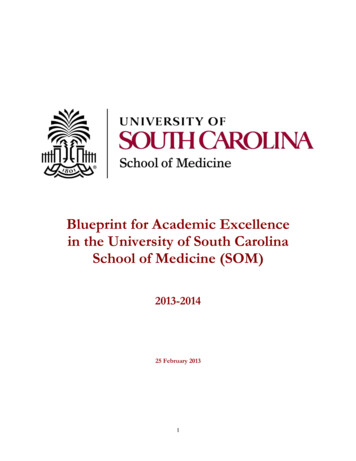
Section I.Executive SummarySchool of Medicine Contributions to Meeting the Academic Dashboard TargetsSince it only enrolls post-baccalaureate students, many of the University Academic Dashboardtargets are inapplicable to the School of Medicine. The School of Medicine proposes to use thefollowing items for its Dashboard (Appendix G).1. MCAT score – The School of Medicine median MCAT score for accepted applicants heldsteady at 29 compared to its peers (30) and its aspirants (33).2. Percentage of Graduates Choosing Primary Care Specialties (Family Medicine, InternalMedicine, Pediatrics) – While the percentage of School of Medicine graduates choosing primarycare specialties (40%) is very close to its peers (43%), this percentage is higher than its aspirants(32%).3. Percentage of Graduates Choosing Primary Care Specialties and SpecialtiesUnderrepresented in South Carolina (OB/GYN, Psychiatry, Emergency Medicine) – Thepercentage of School of Medicine graduates choosing primary care specialties and specialtiesunderrepresented in South Carolina (63%) is very close to its peers (66%) but is significantly higherthan its aspirants (48%).4. United States Medical Licensing Examination (USMLE) Step 2 First Time Percent PassRate - School of Medicine graduates continue to exceed the national average on first time percentpass rate.5. Research Expenditures – School of Medicine extramural funding continued to increase to 46.5million with federal research funding (NIH, NSF, HHS) increasing to over 24 million with halfcoming from NIH awards.School of Medicine Contributions to Key Performance ParametersTeaching Excellence – The School of Medicine has collaborated with other health sciencesschools to expand inter-professional education, has continued to maintain a global presence as aleader in ultrasound education, and increased support for minority scholarships.Research/scholarship reputation and productivity - The School of Medicine has fosteredresearch and promoted collaborations and interdisciplinary research which resulted in extramuralfunding increasing to 46.5 million.Service to state, community, profession and university- The School of Medicine established astronger financial base and infrastructure through its implementation of its electronic health recordand promotion of fiscally sound practices and departmental accountability.Sustainability – The School of Medicine expects patient revenues to be consistent with revenues ofthe prior year, has achieved Stage I Meaningful Use for Internal Medicine, and expects to haveresolution of clinical integration with Palmetto Health by summer of 2013.2
Section II.Meeting the University’s Academic Dashboard TargetsSchool of Medicine Contributions to Meeting the Academic Dashboard TargetsSince it only enrolls post-baccalaureate students, many of the University Academic Dashboardtargets are inapplicable to the School of Medicine. The School of Medicine proposes to use thefollowing items for its Dashboard (Appendix G).Since this dashboard is in the early stages of development, the School of Medicine has not yetidentified targets for the measures. Refinement of dashboard measures and identification of targetsand strategies will be a focus in 2013-14.1. MCAT score – The School of Medicine median MCAT score for accepted applicants held steadyat 29 compared to its peers (30) and its aspirants (33).2013-14 Strategy – Optimize student recruitment strategies. Increase SOM endowment to providefull tuition scholarships for academically gifted students.2. Percentage of Graduates Choosing Primary Care Specialties (Family Medicine, InternalMedicine, Pediatrics) – While the percentage of School of Medicine graduates choosing primarycare specialties (40%) is very close to its peers (43%), this percentage is higher than its aspirants(32%).2013-14 Strategy – Maintain commitment to rural primary care training sites which provide studentswith first-hand experience in rural practice. Continue inclusion of Primary Care Week in curriculum.Encourage faculty participation in the Institute for Primary Care Education and Practice, aninitiative from the South Carolina Area Health Education Consortium.3. Percentage of Graduates Choosing Primary Care Specialties and SpecialtiesUnderrepresented in South Carolina (OB/GYN, Psychiatry, Emergency Medicine) – Thepercentage of School of Medicine graduates choosing primary care specialties and specialtiesunderrepresented in South Carolina (63%) is very close to its peers (66%) but is significantly higherthan its aspirants (48%).2013-14 Strategy – Maintain commitment to rural primary care training sites which provide studentswith first-hand experience in rural practice. Continue inclusion of Primary Care Week in curriculum.Encourage faculty participation in the Institute for Primary Care Education and Practice, aninitiative from the South Carolina Area Health Education Consortium. Investigate feasibility ofexpanding clinical education programs to Florence.3
4. United States Medical Licensing Examination (USMLE) Step 2 First Time Percent PassRate and Mean Score – School of Medicine graduates continue to exceed the national average onfirst time percent pass rate.2013-14 Strategy – Will continue to provide multiple opportunities for formative evaluation ofclinical knowledge through the use of internal and end of clerkship subject exams plus the provisionof a low teaching faculty-student ratio.5. Research Expenditures – School of Medicine extramural funding continued to increase to 46.5million with federal research funding (NIH, NSF, HHS) increasing to over 24 million with halfcoming from NIH awards.2013-14 Strategy – Hire a new Associate Dean for Research and Graduate Education to promotetranslational research efforts at SOM. Renovate Building One research space. Promote researchcollaborations and enable additional VA eligibility for SOM faculty. Develop personal medicineresearch and education components.4
Section III. School of Medicine Goals and their Contribution to the University’s KeyPerformance Parameters2013-2014 Academic Year GoalsGoal 1.Establish a stronger financial base and infrastructure in the SOM.Key Performance Parameters: Service to State, Community, Profession, andUniversity; SustainabilityProgress: Moving forward with PH in clinical integration; addressing meaningful usein newly implemented electronic health record.Plans for Upcoming Year: We continue to have discussions and meetings withvarious University and PH persons on clinical integration. Joint board meetingsstarted February 8, 2013 and are expected to continue over the Spring, as well as,USCSOM Departmental meetings on the matter. We expect to have someresolution of this matter by the Summer of 2013.All clinical operational departments within the USC School of Medicine Trust andPractice Plan have fully implemented the Cerner EMR/EHR/PM, excludesOphthalmology and Neurosurgery. Stage I Meaningful Use has been achieved forInternal Medicine, and we expect most of the Other Departments to qualify thathave adequate Medicare and or Medicaid populations. Federal funding for Stage I tobe received in Calendar 2013. Although productivity and collections are impacted byimplementation of new patient and electronic medical systems, we expect our totalpatient revenues to be consistent or near overall patient driven revenues of the prioryear; this is significant as most hospitals and providers have 30-40% drops inrevenues for one to two years during implementation of significant electronic patientsystems. Stage II planning and work is underway for 2013-2014.Goal 2.Continue to collaborate with other health science schools to expand interprofessional education.Key Performance Parameters: Teaching ExcellenceProgress: Inter-professional seminar was established between medical students andcollege of pharmacy students.Plans for Upcoming Year: Expand existing inter-professional seminar to includenursing students.Goal 3.Continue to maintain a global presence in medical education as a leader in ultrasoundmedical education.Key Performance Parameters: Teaching Excellence; Services to State, Community,Profession, and University5
Progress: Provided leadership, infrastructure, and web-based learning modules forSociety of Ultrasound in Medical Education. Grant submitted to FullertonFoundation for video production studio and Letter of Intent to AMA AcceleratingChange in Medical Education. Five ultrasound-related patents in process.Plans for Upcoming Year: Host Second World Congress on Ultrasound in MedicalEducation. Partner with American Institute of Ultrasound in Medicine on 2013: Yearof Ultrasound campaign. Participate in AAMC’s Global Health LearningOpportunities (GHLO) pilot program with focus on global ultrasound education.Establish memorandum of understanding with University of Santo Tomas inPhilippines and the University of Sharjah in the United Arab Emirates.Goal 4.Foster research and promote collaborations and interdisciplinary research.Key Performance Indicators: Research/Scholarship Reputation and ProductivityProgress: SOM funded five innovative and exploratory grant applications or bridgefunds totaling 90,000. This included one proposal to support the USC COBRECenter for Colon Cancer Research. Last year’s Research Development Fundfunding of 5 investigators yielded five NIH grant applications.Additional SOM faculty became VA-eligible and multiple VA Merit Awardapplications were submitted resulting in two funded VA Merit Awards. A joint VAShared Equipment Evaluation Program (ShEEP) award requested large equipmentto be housed in the IRF through joint efforts and underutilized VA laboratory spaceis becoming available to SOM faculty.Plans for Upcoming Year: Hire a new Associate Dean for Research and GraduateEducation to promote translational research efforts at SOM. Renovate BuildingOne research space. Promote research collaborations and enable additional VAeligibility for SOM faculty. Develop personal medicine research and educationcomponents.Goal 5.Increase the SOM endowment to provide full tuition scholarships forunderrepresented minority and academically gifted students.Key Performance Parameters: Service to state, community, profession anduniversity; SustainabilityPlans for Upcoming Year: Work with Development Office to investigate fundingstreams and devise a fundraiser. Engage alumni and minority physicians, businessand political leaders in strategy development.Five-Year GoalsGoal 1.Pursue new clinical opportunities that align service, education, and research.6
Key Performance Parameters: Service to State, Community, Profession, andUniversity; SustainabilityForm an integrated clinical practice with Palmetto Health. Actively pursue newpractice opportunities centered on healthcare technology, telehealth, the MedicalHome/Medical Neighborhood Concept, multidisciplinary teaching/learningexperiences, and outcomes research.Goal 2.Establish a Master’s in Physician Assistant ProgramKey Performance Parameters: Teaching Excellence; Service to State, Community,Profession, and University; SustainabilityPlan to establish a Master’s in Physician Assistant program with a target date ofsummer 2017 for the first entering class.Goal 3.Develop a progressive interdisciplinary research agenda as part of SOM StrategicPlan.Key Performance Parameters: Research/Scholarship Reputation and Productivity;Service to State, Community, Profession, and UniversitySOM faculty will collaborate with researchers across the university, the state, thenation, and globally in targeted areas of strength, need, and funding promise such asinflammation, stroke, heart disease, regenerative medicine, neuropsychiatric diseases,technology in medicine, and health care delivery. Faculty will actively pursue fundingopportunities such as COBRE and USAID.Goal 4.Explore options for potential clinical campus in Florence.Key Performance Parameters: Teaching Excellence; Service to State, Community,Profession, and UniversityThe SOM will investigate the feasibility of expanding its clinical education programsto Florence.Goal 5.Strengthen infrastructure for educational programs.Key Performance Parameters: Teaching Excellence; Services to State, Community,Profession, and University; SustainabilityInitiate planning and fund raising for renovation of space for Objective StructuredClinical Examinations (OSCE), media production studio in Building 3 andtechnology-enabled smart classroom on second floor of Library.7
Section IV.Appendices8
Appendix A. Resources NeededGoal 1 - Foster research and promote collaborations and interdisciplinary research.Type of ResourceExistingAdditional:StrategyState sourceFiscalE-fundsVP ResearchProvide researchers with bridge and seedProvostfunding to catalyze proposals and supportnew Associate Dean for Research &Graduate Education with neededresourcesGoal 2 - Increase SOM endowment to provide full tuition scholarships for underrepresentedminority and academically gifted students.Type of ResourceExistingAdditional:StrategyState sourceFiscalEndowment Contributions toDevise a fundraiser to increaseendowmentcontributions to endowmentGoal 3 – Establish a Master’s in Physician Assistant ProgramType of ResourceExistingAdditional:StrategyState sourcePersonnelProvost andWork with Provost and pursue grantgrantsopportunitiesGoal 4 – Strengthen infrastructure for educational programsType of ResourceExistingAdditional:StrategyState sourceFiscalE-funds/Donors, grants,Pursue funding campaigns and namingPhilanthropyProvostopportunities, grants, and work withProvost on funding for media productionstudio and technology-enabled classroom9
Appendix B. Benchmarking InformationTop 10 Medical Schools (Primary Care) 2013 US News & World Report: University ofWashington, University of North Carolina-Chapel Hill, Oregon Health and ScienceUniversity, University of California-San Francisco, University of Colorado – Denver,University of Nebraska Medical Center, University of Massachusetts-Worcester, Universityof Michigan-Ann Arbor, University of Minnesota, University of California-Los Angeles5 Peer Institutions (Teague-Cranston Act Medical Schools): East Carolina, East Tennessee State,Marshall, Texas A&M, Wright StateTraditionally, the School of Medicine has used the medical schools established through theTeague-Cranston Act as its peers. Given the growth in the School of Medicine and theUniversity, the time has come to revisit this issue and consider other factors in choosing peermedical schools. This will be an area of focus during 2013-14.10
Appendix C. School of Medicine’s Top Strengths and Important AccomplishmentsStrengths Strong, fully-accredited educational programs.Largest physician and provider practice in the Midlands.Faculty who are dedicated and committed to the educational programs.Very good facilities (classrooms, laboratory, instrumentation resource facility, research andclinical space).Important Accomplishments Recruited a Chair for Department of Surgery. Appointed a Vice Dean for Innovative HealthCare Technologies and a Chief Medical Officer.Focused growth in research (neuroscience, inflammation, cardiovascular, healthcare delivery, andultrasound). Extramural funding continued to increase from 26M in 2005 to 46.5 million in2012, with federal research funding (NIH, NSF, HHS) increasing to over 24 million in 2012with half coming from NIH awards.Annual external funding per tenured/tenure-track faculty member is 155,000.Additional SOM faculty became VA-eligible and three SOM faculty are now VA-funded.COBRE Center for Dietary Supplements and Inflammation established with 10 million NIHaward.Department of Family and Preventive received grant for establishment of Disability Researchand Dissemination Center which will funnel 28 million in CDC funding to support disabilityresearch in the next five years.Department of Neuropsychiatry & Behavioral Science received 2.7 million telehealth grant.Diversity efforts continue and three out of four newly hired tenure–track assistant professorswere women, and 50% of matriculants in the Integrated Biomedical Sciences Graduate programwere underrepresented minorities.Implemented Electronic Health Record/Electronic Medical Record/Practice ManagementReporting System with Palmetto Health (PH).Increased support for minority scholarships through 200,000 four year pledge from TheRegional Medical Center of Orangeburg and Calhoun Counties for two minority scholarships.First year payment made in 2012.Established first NCQA recognized Patient Centered Medical Home practice in South Carolina.The Office of Continuous Professional Development and Strategic Affairs along with PalmettoHealth received the 2012 Alliance for Continuing Medical Education award for OutstandingEducational Collaboration.Department of Neurology faculty were instrumental in helping Palmetto Health establish thefirst Joint Commission accredited Primary Stroke Center in the Midlands.Hosted highly successful First World Congress on Ultrasound in Medical Education in 2011.M.D. program received a full 8-year accreditation by the LCME in 2009, and Masters in NurseAnesthesia program received a full 10-year accreditation and expanded to a second primarytraining site in Greenville, SC; the Masters in Rehabilitation Counseling program received fullaccreditation in 2012 by the Council on Rehabilitation Education.11
Appendix D. School of Medicine’s Weaknesses and How They are Being AddressedWeaknesses Loss of substantive financial support from the state.Lack of minority faculty members and studentsLack of scholarship monies to support medical educationPlans to address weaknesses Develop an integrated clinical practice with PH, continue to pursue new revenue streams(i.e., corporate medicine, international medicine (Philippines, India, Brazil, United ArabEmirates), expand/develop revenue generating clinical practices, encourage entrepreneurialactivity. Seeking additional endowments for minority scholarships and institutional support throughdonors, grateful patients, and health systems.12
Appendix E. Statistical Data for School of Medicine1. Number of entering freshman for Fall 2009, Fall 2010, Fall 2011 and Fall 2012 classesand their average SAT and ACT scores. Not applicable to SOM2. Freshman retention rate for classes entering Fall 2009, Fall 2010, and Fall 2011.Not applicable to SOM3. Sophomore retention rate for classes entering Fall 2008, Fall 2009, and Fall 2010.Not applicable to SOM4. Number of majors enrolled in Fall 2009, Fall 2010, Fall 2011 and Fall 2012 by level:undergraduate, certificate, first professional, masters, or doctoral (headcount)Fall 2009CertificateFirst 201251360102435565. Number of entering first professional and graduate students: Fall 2009, Fall 2010, Fall2011, and Fall 2012 and their average GRE, MCAT, LSAT, etc.First ProfessionalFall 2009NumberMCAT7928.1Fall 2010Number MCAT9027.4Fall 2011Number MCAT9228.3Fall 2012NumberMCAT9428DoctoralFall 2009NumberGRE171205Fall 2010NumberGRE151178Fall 2011NumberGRE151153Fall 2012NumberGRE16109413
6. Number of graduates in Fall 2011, Spring 2012, summer 2012 by level (undergraduate,certificate, first professional, masters, doctoral)CertificateFirst ProfessionalMastersDoctoralTotalFall 2011118313Spring 20122472421139Summer 2012207211PlacementTerminal MastersTerminal DoctoralTotalFall 20117310Spring 201240141Summer 20127187. Four-, Five- and Six-Year Graduation rates for the three most recentapplicable classes (undergraduate only). Not applicable to SOM8. Total credit hours generated by your unit regardless of major for Fall 2011, Spring2012 and Summer 2012.Credit HoursFall 20113,136Spring 20123,393Summer 20125409. Percent of credit hours by undergraduate major taught by faculty with a highestterminal degree. Not applicable to the SOM10. Percent of credit hours by undergraduate major taught by full-time faculty. Notapplicable to SOM11. Number of faculty by title (tenure-track by rank, non-tenure track (research orclinical) by rank) as Fall 2010, Fall 2011, and Fall 2012 (by department whereapplicable).Tenure-Track FacultyProfessorAssociate ProfessorAssistant ProfessorLibrarianResearch FacultyProfessorAssociate ProfessorAssistant ProfessorInstructorFall 2010Fall 2011Fall 2012272410728231072621117Fall 2010Fall 2011Fall 2012*64514 (26)5 (4)22 (10)1 (1)4 (1 )5 (2 )15 ( 3 )1 (1)14
Fall 2010Fall 2011*Clinical FacultyProfessor8320 (149)Associate Professor19947 (158)Assistant Professor65883 (566)Instructor4811 (42)Librarian11*Includes all salaried and (unsalaried) faculty. 2010 numbers reflect salaried faculty only.Fall 2012*23 ( 103 )49 ( 136 )83 ( 649 )13 ( 39 )112. Current number and change in the number of tenure-track and tenured faculty fromunderrepresented minority groups from FY 2011.FY201124Currently3015Change 6
Appendix F. Statistical Research Data for School of Medicine1. The total number and amount of external sponsored research proposal submissionsby funding source for FY2012.TOTALNumber ofApplicationsSubmittedAmount(First 51527261442 60,376,312 54,085,623 1,472,146 1,736,807 1,800,134 598,822 682,7802. Summary of external sponsored research awards by funding source for FY2012.Total extramural funding processed through Sponsored Awards Management (SAM)in FY2012, and Federal extramural funding processed through SAM in FY2012.(Available http://sam.research.sc.edu/awards.html.) Amount of sponsored researchfunding per faculty member in FY2012 (by rank, type of funding; e.g., federal, state,etc., and by department if applicable).TotalExtramuralFunding 46,488,723Commercial 740,045Total Extramural FundingFY 2012 46,488,723Federal 24,121,140Local 250,000Other 60,000Total Federal Extramural FundingFY 2012 24,121,140** Includes funding from PHR16Private(PHI) 19,755,701State 1,561,836Total NIH FundingFY 2012 12,150,016
SCHOOL OF MEDICINE - BLUEPRINT 2012Question 2C. Amount of sponsored research funding per faculty member in 2012 (by rank, type of funding, and by department if applicable).ASSISTANT PROFESSOR:TOTALTOTALFUNDEDBY DEPTSTATEPHIcheckRANKCOMMOTHERIN 00--55,250--621,7501040%155,438FAMILY RNAL OUNTFUNDEDINDEPARTMENTPER RANK-LOCAL% FACULTY AMOUNT FUNDEDIN RANK WITHIN DEPARTMENTIN RANK19FEDERAL# FACULTYCBATotalTotal FundingTOTAL250,00084,200250,000PER RANK** NOTE: PPN Assistant Professor Norma Frizzell's grants are still listed under Exercise Science in USC database (start date 8-2011)*Of the 109 Assistant Professors, 9 are on tenure-track.Spreadsheet has been collapsed to only show those funded.ASSOCIATE PROFESSOR:TOTAL# FACULTY% FACULTYIN RANKWITHcheckIN 91,0199,285,7068131%371,428TOTALFUNDEDBY DEPTIN 86,306INTERNAL IAL PROJECTS1Associate7,500Total25Total FundingFED 805,200-9,285,7067,175,032*Of the 81 Associate Professors, 21 are on tenure-track or tenured.807,700PHI445,039-151,95560,000Spreadsheet has been collapsed to only show those funded.PROFESSOR:TOTALTOTALFUNDEDIN RANKRANKCBABY ,3084,640,782PPN2Professor745,558745,558--FAMILY NAL DEAN'S OFFICETotal30Total FundingFED NIH3,343,59133,627,573STATELOCAL--13,972,895*Of the 56 Professors, 24 are on tenure-track or tenured.checkIN 1983,325,000-564,389TOTALFUNDEDBY DEPTIN RANKRANKLIBRARY1LibrarianTotal1PER RANKSpreadsheet has been collapsed to only show those funded.TOTALLIBRARIAN% FACULTY AMOUNT FUNDEDIN RANK WITHIN DEPARTMENT2,496,144-COMM# FACULTY-639,526PHITOTALTotal FundingFED NIHFDTNTOTAL# FACULTYcheck% FACULTY AMOUNT FUNDEDIN RANK WITHIN DEPARTMENTSTATELOCALCOMMOTHERIN RANK*RESEARCH8,2278,227-----8,227714%PER RANK8,2278,2278,227-----8,227714%8,227*All Librarians are on tenure-track or tenured.TOTALTOTALINSTRUCTORSFUNDEDDEPTTOTAL# FACULTY% FACULTY AMOUNT FUNDEDIN RANK WITHIN DEPARTMENTIN RANKRANKTotal FundingFED NIHSTATELOCALFDTNCOMMOTHERcheckIN RANK*RESEARCHPER RANKOB/GYN0Instructor00000000400FAMILY 0000200INTERNAL %---17-*None are on tenure-track or tenuredTOTAL SOM75ALL 46,428,718 24,061,135 1,561,836 250,000- 19,755,702- 740,045- 60,000- 46,428,71826728%- 619,050
3. Total sponsored research expenditures per tenured/tenure-track faculty for FY 2012,by rank and by department, if applicable.FundingFY 2012 9,508,929TotalTenured/Tenure-Track FacultyFY 201261Funding perTenured/Tenure-Track FacultyFY 2012 155,884Assistant Professors:FY2012 850,544TotalTenured/TenureTrack FacultyFY20123Funding perTenured/Tenure TrackFacultyFY2012 283,515 597,6484 149,412 99,567 1,547,75929 49,784 171, 973FundingDepartmentCell Biology & AnatomyPathology, Microbiology &ImmunologyPharmacology, Physiology &NeuroscienceAll Assistant ProfessorsAssociate Professors:DepartmentCell Biology & AnatomyFamily & Preventive MedicinePathology, Microbiology &ImmunologyPharmacology, Physiology &NeuroscienceAll Associate ProfessorsFY2012 1,078,612 97,782Total Tenured/TenureTrack FacultyFY201282Funding perTenured/Tenure TrackFacultyFY2012 134,827 48,891 9,6833 3,228 1,114,568 2,300,645821 139,321 109,555Funding18
Professors:FY2012 1,513,212 697,251 0 0 122,313Total Tenured/TenureTrack FacultyFY201253121Funding perTenured/Tenure TrackFacultyFY2012 302,642 232,417 0 0 122,313 797,312 021 398,656 0 1,774,606 051 354,921 0 747,604 0 5,652,2982124 373,802 0 235,512DepartmentFundingMedical LibraryAll LibrariansFY2012 8,227 8,227Total Tenured/TenureTrack FacultyFY201277Funding perTenured/Tenure TrackFacultyFY2012 1,175 1,175DepartmentCell Biology & AnatomyFamily & Preventive MedicineGeneticsInternal MedicineNeurologyNeuropsychiatry & BehavioralScienceOphthalmologyPathology, Microbiology &ImmunologyPediatricsPharmacology, Physiology &NeuroscienceSurgeryAll ProfessorsFundingLibrarians:4. Number of patents, disclosures, and licensing agreements in fiscal years 2010, 2011and 2012.Fiscal Year2010InventionDisclosures1ProvisionalPatent Applications5Non-ProvisionalPatent Applications4201154320121121*Non-provisional patent applications include only newly filed US Utility and PCT applications.19Issued patents140
Appendix G. School of Medicine Academic DashboardAcademic Dashboard Measures for School of Medicine1. MCAT Score2. Percentage of Graduates Choosing Primary Care Specialties (Family Medicine, InternalMedicine, Pediatrics)3. Percentage of Graduates Choosing Primary Care Specialties and Specialties Underrepresented inSouth Carolina (Ob/Gyn, Psychiatry, Emergency Medicine)4. United States Medical Licensing Examination (USMLE) Step 2 First Time Percent Pass Rate5. Research Expenditures20
No. 1: MCAT ScoreMCAT Score343332USC Cola31Peers30Aspirants29282720102011Source: Association of American Medical Colleges/Medical School AdmissionRequirements, 2013.21
No. 2: Percentage of Graduates Choosing Primary Care Specialties (Family Medicine,Internal Medicine, Pediatrics)Percentage of Graduates Choosing Primary Care Specialties(Family Medicine, Internal Medicine, Pediatrics)5045403530USC Cola25Peers20Aspirants15105020102011Source: Association of American Medical Colleges/Medical School Admission Requirements, 2013.National Graduate Medical Education Census.22
No. 3: Percentage of Graduates Choosing Primary Care Specialties and SpecialtiesUnderrepresented in South Carolina (Ob/Gyn, Psychiatry, Emergency Medicine)Percentage of Graduates Choosing Primary Care Specialties andSpecialties Underrepresented in South Carolina(Ob/Gyn, Psychiatry, Emergency Medicine)80706050USC Cola40Peers30Aspirants2010020102011Source: Association of American Medical Colleges/Medical School Admission Requirements, 2013.National Graduate Medical Education Census.23
No. 4: USMLE Step 2 Clinical Knowledge Examination First Time Percent Pass RateUSMLE Step 2 Clinical KnowledgeExamination First TimePer
Underrepresented in South Carolina (OB/GYN, Psychiatry, Emergency Medicine) – The percentage of School of Medicine graduates choosing primary care specialties and specialties underrepresented in South Carolina (63%) is very close to its peers (66%)