Transcription
OUTLIERS:MAPPING THE BEST STOCKSMAP PrincipalsJason Bodnerjbodner@mapletter.comLucas Downeyldowney@mapletter.comMAP Researchers/Cornell School of FinancialEngineering- MFE CandidatesYiheng Xiaoyx426@cornell.eduJohn Zhongcz379@cornell.eduLeqi Zhaolz469@cornell.eduYi Shenys852@cornell.eduYi Wangyw889@cornell.eduXin Tongxt87@cornell.eduRuyu Kongrk742@cornell.edu
ABSTRACTMAP’s quantitative stock research identifies the biggest winning stocks early on.In this paper we will show the following: Including back-tested data, MAP’s COMPASS 20 buy list has beaten the market for thepast 28.5 years. If you bought the Compass top 5, top 10 or all 20 stocks, you beat themarket over 1, 3, 6, 9, and 12 month holding periods.MAP’s strongest COMPASS 20 signals can be traded in a simple, low turnover, equalweighted strategy rebalancing every six months, greatly outperforming the S&P 500.MAP’s COMPASS 20 buy list identified, on average, half of the top 25 performing stocksin the S&P 500 each year since January 1, 1990 - capturing a majority of their returns forthe year.MAP identified the FANG stocks (Facebook, Amazon, Netflix, Google (Alphabet) – andlater FAANG with Apple) before Jim Cramer even coined the acronym. This basket ofstocks trounced the market.MAP’s own FAANG is DANNN, (DPZ, ALGN, NFLX, NVDA, NTES) which easily beat thefamous FAANG’s returns.The bottom line is that MAP offers a process that is completely unique in its approach. We lookfor the best stocks likely being bought and sold unusually by big institutions. Obviously, wecan’t know if an institution is building a position without being on a trading desk, however thefounders of MAP collectively spent decades handling large institutional stock order flow andbuilt an algorithm to look for the telling signs they witnessed day-in and day-out for years. MAPhas a stellar track record of identifying the market’s most explosive high-quality stocks. Thesestocks are given to MAP’s clients each week with stunning results.The research contained in this paper simply would have not been possible without the tirelessand thorough work of Yiheng Xiao, John Zhong, Leqi Zhao, Yi Shen, Yi Wang, Xin Tong, and RuyuKong. A very special thank you is in order for you all. Our gratitude also goes out to Cornell’sSchool of Financial Engineering, to Louis Navellier, Michael Garaventa, and all those at Navellier& Associates who graciously agreed to help us. Last but certainly not least, we’d like to thankthe team at FactSet: Lunara Fairhurst, Nick Samoyedny, and Courtney Osgood.The data in this paper was largely sourced from FactSet. All data sources include: FactSetBloombergMoney.net Yahoo FinanceIEXQuandlRead on to find out how two average guys figured out how to MAP out the best stocks outthere Copyright 2018 Mapsignals.com
INTRODUCING THE OUTLIERDid you ever notice that some winners just keep winning?We all want to win. When we play games, we want to win. I can’t think of many people whosettle in to play a game in hopes of losing. Renowned football coach Vince Lombardi famouslysaid, “Show me a good loser and I will show you a loser.”Sports is all about winning as Lombardi also nailed with: “winning isn’t everything, it’s the onlything!”And while it's no sport.investing, let’s face it .is all about winning.The thing is, for most of us, winning doesn’t come naturally. It takes hard work, dedication, andpassion. Most people like a good game of cards or basketball or picking a stock every now andthen. But only a rare few have the passion and focus required to become a professional card orball player, or investor. It takes way more time and commitment than most people have to give.But for those professionals who put in the time and dedication, even then, they may notbecome masters. They may never become outliers.Source: WordpressMalcolm Gladwell wrote in the book Outliers: The Story of Success, that 10,000 hours is themagic number. He basically said that it takes 10,000 hours to achieve outlier greatness. 10,000hours to become a chess grandmaster, a violin virtuoso, or a wizard in a chosen field. “’Theemerging picture from such studies is that ten thousand hours of practice is required to achievethe level of mastery associated with being a world-class expert—in anything,’ writes theneurologist Daniel Levitin. — p. 40.” 10,000 hours corresponds to about 10 years of practice,commitment, and effort. Copyright 2018 Mapsignals.com
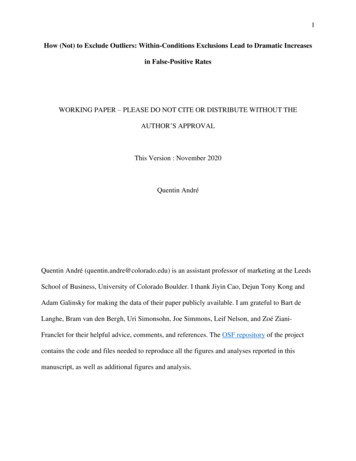
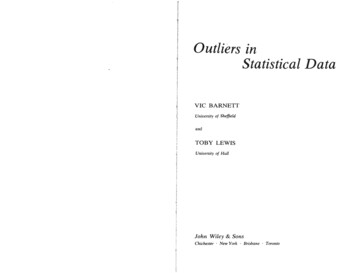
Gladwell isn’t just talking about pro-level people here. He is talking about the best of the best.The outliers. The ones in their field who dominate and leave an indelible mark forever. We allknow them. They are the ones whose stats shatter everyone else’s.In basketball, one name towers above the rest: Michael Jordan. He may someday be joined byLeBron James, but for now, Jordan is all over the NBA archives. For hockey, Wayne Gretzkybasically re-wrote the record books. Babe Ruth still ranks #1 on many lists of Baseball’s bestplayers of all-time.Let’s see what real outliers look like:Jordan towers above everyone for trophies. Source: Business InsiderEspecially in salary. Source: blog.minitab.com Copyright 2018 Mapsignals.com
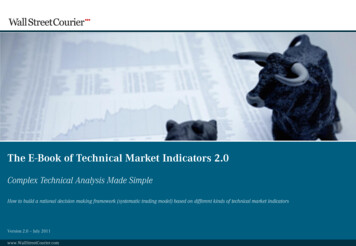
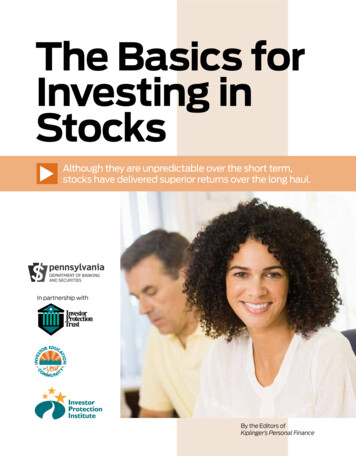
Wayne Gretzky is literally almost off the chart. Source: medium.comBabe Ruth skewed homeruns for nearly a century. Source: fangraphsOf course, there are outliers in everything, not only sports. They exist in entertainment,business, and investing. I only need to mention Warren Buffett’s name to make my point.Outliers also exist in the stock market.ALGN is an outlier stock, up 1620% since MAP identified it in April 2011. Source: MAP Copyright 2018 Mapsignals.com
They are the stuff of investment legend. The unicorns. The stocks that increase in valuethousands of percent over the market. They are the holy grail of stock-picking.Anyone can identify them after the fact. So, then the all-important question becomes “canoutlier stocks be found before they shoot higher?”We not only believe the answer is yes, but we have the data to back it up.In this paper: We will analyze the success rate for MAP’s method of picking stocks.We will go into detail how MAP’s stock selection compares to the overall market.We will construct a simple trading strategy to demonstrate our market-beating stocks.We will analyze how early MAP was in identifying the most storied stocks of this decadethe FAANG stocks. (FB, AMZN, AAPL, NFLX, GOOGL)We will demonstrate how MAP identified stocks that beat FAANG.So how did two average guys end up mapping the best stocks out there? As the more than10,000 hours documented below, prove: they became masters at it.MAP opened its doors as a business in July of 2014. Since then, we have been providing topclass quantitative research on the best stocks likely being accumulated by big institutions in anunusual way. We have been pointing out the top leading stocks to our clients consistently inone form or another since 2007.Seven years prior to MAP’s birth, its two co-founders met each other: A former bookkeeperfrom Louisiana and a former musician from Florida. We ended up spending over three decadescombined on Wall Street trading floors, some of that time running trading desks, asking a ton ofquestions and honing our stock picking techniques.The time led us to be able to find the biggest and best outlier stocks. It also adds up to tens ofthousands of hours.MAP devotes all its time and energy identifying outlier stocks. In a way, our process is an outlierin that we only focus on outliers.Join us as we show you how we map out the best outlier stocks of the market.MAP the best stocks with us.But first let’s go over exactly what we do and how we do it Copyright 2018 Mapsignals.com
A QUICK INTRODUCTION TO THE MAP PROCESSAt MAP we specifically look for unusual trading activity in stocks that are likely beingaccumulated by institutions. We believe many of the smartest institutional investors in theworld can spot the best stocks out there. We want to be along for the ride. We believe that ourmethod stacks the odds of success in our favor and exploits these foot prints over time.So, how does MAP do it?Our system is a sophisticated process of filters upon filters. We look at: Mechanics which are things like: abnormal trading volume, buying/selling pressure,price ranges, and volatility.Analysis of Fundamentals deals with the health of a company: sales and earningsgrowth, debt, and company guidance to name a few.Positioning deals with abnormal trading activity in shares (likely institutional buying).Once we rank our stocks based on score, we then filter the list to 20. This list is our bestguess to stocks we believe institutions are building positions in.We sift through nearly 5,000 U.S. stocks each day to find those that institutions can traderegularly without impacting the price. We avoid low-liquidity stocks while searching forabnormal patterns in price and volume relationships.Our goal is to isolate when we believe an institution starts getting into a stock. When the signalflags our system, it receives an unusual institutional—or UI—buying signal. This tells us unusualinstitutional buying is likely. Our next big winner stock is hiding in this list.Every day, our models scan nearly 5,000 actively traded U.S. stocks. Every morning, we pull120 data points for each stock. This includes basics like volume, price, and fundamentals andmore complex data. We then rank each stock using our MAP scores.The algorithms we use were crafted, then tested and perfected. This took place years ago andthe process is the same one we use today to identify winners. Remember, we sift throughthousands of stocks to find the ones we think institutions are buying. When a stock meets ourcriteria and shows the signals, it goes into a pool of stocks. We get an average of 500 unusualsignals per week. We remove duplicate tickers and are typically left with approximately 300stocks per week. From there we rank them from highest to lowest by MAP score. We thenhighlight the Compass 20 as the twenty stocks with the highest probability of future priceappreciation. Copyright 2018 Mapsignals.com
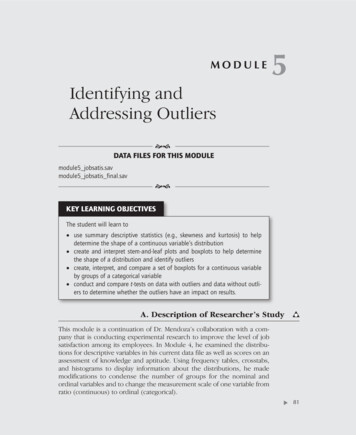
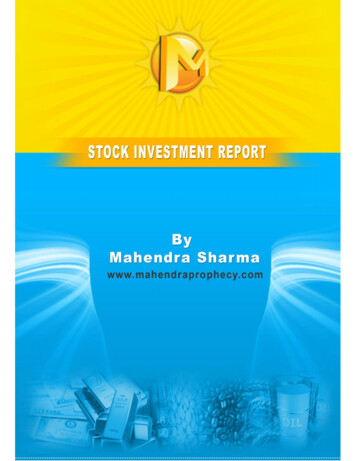
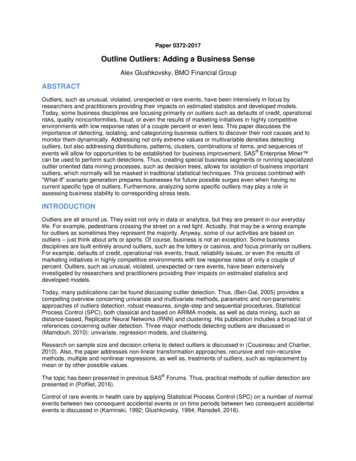
COMPASS 20/10 April 11, 2017COMPASS Top 20 and bottom 10 Stocks for the week prior.Prepared by Macro Analytics for Professionals on 04/11/2017 based on closing prices for the previous DRFPRXANFALDRCVENAMEINDUSTRY SUBGROUPPRIOR CLOSE COMPASS SCORETECHNICALAlign Technology, Inc.Health Care Supplies114.7393.194%Arista Networks, Inc.Communications Equipment133.2793.194%ILG, Inc.Hotels Resorts & Cruise Lines21.3389.794%Skyworks Solutions, Inc.Semiconductors101.5386.291%Qorvo, Inc.Semiconductors70.6486.294%Amazon.com, Inc.Internet & Direct Marketing Retail907.0484.591%Cirrus Logic, Inc.Semiconductors64.6984.594%Akorn, Inc.Pharmaceuticals32.582.885%salesforce.com, inc.Application Software84.2481.085%Wix.com Ltd.Internet Software & Services76.379.391%Jazz Pharmaceuticals PlcPharmaceuticals152.8879.382%Baxter International Inc.Health Care Equipment52.8479.385%Sabra Health Care REIT, Inc.Health Care REITs28.2777.688%Select Comfort CorporationHomefurnishing Retail25.6377.685%Teradyne, Inc.Semiconductor Equipment31.7677.694%Darden Restaurants, Inc.Restaurants82.777.694%Apollo Global Management, LLC ClassAssetA Management & Custody Banks25.5175.985%CareTrust REIT IncHealth Care REITs17.5175.985%SolarEdge Technologies, Inc.Semiconductor Equipment16.475.971%Alliance Data Systems Corporation Data Processing & Outsourced Services247.6675.988%Intrexon CorporationBiotechnology20.1931.026%Hertz Global Holdings, Inc.Trucking1629.318%Nutanix, Inc. Class AInternet Software & Services18.5829.324%R.R. Donnelley & Sons CompanyCommercial Printing11.8429.321%New York Community Bancorp, Inc. Thrifts & Mortgage Finance13.729.326%DDR Corp.Retail REITs12.4127.621%Five Prime Therapeutics, Inc.Biotechnology33.8427.626%Abercrombie & Fitch Co. Class AApparel Retail10.9327.626%Alder Biopharmaceuticals, Inc.Biotechnology19.5525.918%Cenovus Energy Inc.Integrated Oil & Gas11.2625.918% Copyright 2018 38%29%29%38%38%INITIAL 4/20171/31/2017NEW BUY3/7/2017NEW BUY3/28/20173/14/2017NEW BUYNEW BUYNEW BUYNEW BUYNEW BUYNEW BUYNEW BUYNEW BUY1/31/20171/24/20174/4/20173/28/2017NEW SELL2/21/2017NEW SELL1/31/2017NEW SELL2/14/2017INITIAL PRICE 113.23 119.06 20.57 89.90 61.85 891.51 60.52 82.50 146.9852.30 21.0020.9318.1511.35 14.28 11.08 .09%z1.37%z16.02%
CAN MAP BEAT THE MARKET?Does the MAP stock picking process work? The answer comes from looking at history.and theanswer is an undeniable “yes.”As mentioned above, MAP came into being in 2014. The algorithms we use today were appliedacross exhaustive back testing. We accessed a high-level professional database to test this dataas accurately and precisely as possible. We enlisted the help of our friends at Navellier &Associates and FactSet to conduct this extremely precise test.We looked back at every trading day from January 1st, 1990 until May 2nd, 2018. That timelinerepresents 10,348 calendar days or 7,140 trading days. Over the more than 28.3-year periodtested, we generated an average of 85.5 unusual institutional activity signals each day. Now, astime wore on, daily signals increased. This is logical due to increased trading volumes overtime. In short, we had 610,836 stock signals to test over a period of nearly thirty years. 58% buysignals were generated leaving 42% sell signals. This is in-line with current observations for our4 years of live data.The 85.5 stocks per day worked out to an average of 428 stocks per week. After removingduplicate tickers (stocks making more than one unusual signal each week), we arrived atroughly 280 stocks per week. This is consistent with our expected average of 300 unusualinstitutionally active stocks per week. That’s what we observe in our current research. We thenscored and ranked these stocks using the same method we currently employ. This was doneaccording to historical data. This means we conducted our back test so that our currentalgorithms would function precisely as they would have done on that day in time.Once our average 280 stocks per week were scored and ranked, we constructed the 20-stockbuy list using the same sorting criteria we currently employ to generate the Compass 20/10report. We then tested various combinations of buying different quantities of these stocksaccompanied with different holding periods. The results were very impressive across allcombinations. Whether you bought the top Compass stock, top 5, top 10 or all 20, you beat themarket over 1, 3, 6, 9, and 12 month holding periods. Copyright 2018 Mapsignals.com
Here is a summary: Buying all Compass 20 stocks and holding them for only one month almost doubled thereturn of the S&P 500. This however, resulted in excess volatility as you can see in thedrawdown chart. Buying the top 5 Compass 20 stocks and holding them 3 months offered the best returnyet exhibited similar and even slightly more volatility than the S&P 500. Copyright 2018 Mapsignals.com
Buying the Compass 20 and holding for 12 months offered the highest risk-adjustedreturn. That is - the return was the highest with the least volatility of the configurationstested.As we can also see below, buying all Compass 20 stocks and holding for a period of 9-monthsoffered an excellent risk-adjusted return profile. This means it beat the market with lessvolatility than the market. Copyright 2018 Mapsignals.com
BUT I’M NOT A HEDGE FUNDI know what you’re thinking: “It’s not realistic to buy 20 stocks every week.” That is totally true.The average individual investor may have 20 stocks in their portfolio at any given time. Wewould certainly not expect an average investor to buy 1,040 stocks in a year! So, our researcherYiheng Xiao devised an ingenious and simple trading strategy. The results blew the doors off theS&P 500, and it’s one that any investor could practically do.Here’s how it works:Let’s start January 1st, 1990. We observe the Compass 20 buy reports that come out weekly. OnJuly 1st we begin trading. We buy the 20 strongest signals of the previous 6 months equallyweighted. These are the stocks that appeared most frequently on the weekly Compass 20report for 6 months. We hold those for 6 months and rebalance the account every 6 months.We do this by closing all positions and buying the strongest 20 signals from the most recent 6months.It sounds pretty simple: You hold 20 stocks for six months and replace them with 20 new onesfor another six months and on and on. The investor only ever holds 20 stocks at one given timeand trades twice a year. Yiheng constructed a back test using these exact assumptions. Lookwhat it shows us:In case you’re worried about those first ten years on the left chart where the lines don’t seemto diverge at all, the chart on the right is a zoom in to show you that outperformance beganwithin a year or so. What this really tells us is that if we invested 1 in this Strongest 20Portfolio beginning July 1, 1990 and rebalanced every 6 months, at the end of 2017 we wouldhave 5,188.87. That’s a return of over 500,000%. In contrast, if we just invested 1 in the S&P500 beginning July 1, 1990, we would end up with 7.46 at the end of 2017. Copyright 2018 Mapsignals.com
That’s phenomenal! But what if we just look at the top 5 Compass stocks? Basically, let’s drilldown on the 20 stocks to the top 5. You can see that picking the top 5 Compass stocks had a 9month annualized return of 18.07% vs 11.38% for the market. That’s nearly a 60% beat on themarket!COMPASS stocks general performance between 1990 – 2017 58.7% Copyright 2018 Mapsignals.com
What if you picked only the top stock for the Compass? Picking the top 1 stock from theCompass and holding for 9 months nearly doubled the market! It’s an astounding 87% beat ofthe market!Annualized return comparison (1990 – 2017)So, can MAP beat the market? You bet we can! Copyright 2018 Mapsignals.com
CAN MAP IDENTIFY THE TOP STOCKS OF THE MARKET EARLY ON?If MAP can beat the market, this suggests that we can identify the top performing stocks beforethey become the top performing stocks, right? Well, one can beat the market in many ways.One can buy poor quality stocks bouncing off lows. One can trade high frequency strategies oreven short the market. At MAP, as we are focused on outlier stocks, we seek to pick the biggestwinners of tomorrow, today. How would that have worked for us over the past nearly thirtyyears?What our MAP researchers found was astonishing, and really cool: MAP identifies nearly half ofthe top performing stocks of the S&P 500 year in - year out.We started again on January 1, 1990. We then identified the top 25 stocks of the S&P 500 byyear. We wanted to see how much of the top 5% of the S&P 500 MAP could identify. What welearned is that the Compass-20 buy list could help us pick out nearly half of the top 25 stockseach year. On average, the Compass-20 identified 12.25 of the 25 leading names of the indexevery year since 1990.This result is significant. Many years, the market’s best performing stocks may have been theprior year’s worst performers. For instance, there may have been a sector out of favor likeFinancials' stocks in the height of the housing crisis. In subsequent years, stocks with poorfundamentals might have risen immensely. Remember, we are looking for the highest qualitystocks with positive sales and earnings growth, superior technicals, and most importantly theunusual institutional activity signal. When we are this choosy, it is even more meaningful to beable to identify half of the leading 25 stocks of the S&P 500 each year.As we can see in the above chart, on average we found half of the top 25. But, in addition torare years in which we found fewer than half, there were outlier years as well. In 1998, MAPfound over 70% of the top 25. In 2007 MAP found 80% of the top 25. Most recently, in2015, MAP found 75% of the top 25. Copyright 2018 Mapsignals.com
Even in a year like 2017 when the market had abnormally high returns, the percentage was60%. The following table illustrates this. Not only did MAP identify 15 out of the top 25 S&P 500stocks of 2017 (60%), but we also had amazing timing. The stocks highlighted in yellow, in thetable below, show that MAP caught a majority of the return for the year on those stocks. Inother words, not only did we identify them, but we did it early on. Copyright 2018 Mapsignals.com
The COMPASS-20 buy list actually beat the comparison S&P 500 Index an astounding 95.65% ofthe time during 2017. 14 of the top 25 stocks of 2017 appeared in the COMPASS 20. The graphbelow shows that several names appeared many times throughout the year:The takeaway here is that even in a standout year with abnormally high returns like 2017, MAPstill found the best and biggest stocks. In other words, in a major bull year, we found the stocksthat enabled us to crush the market. And we did it early on. Copyright 2018 Mapsignals.com
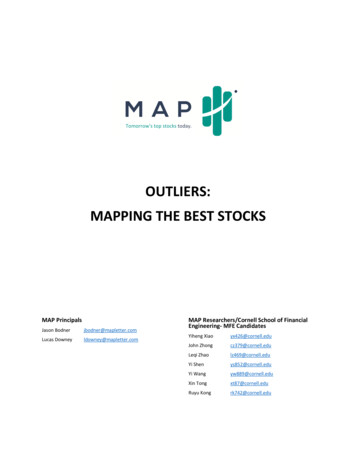
WHAT ABOUT THE FAANG STOCKS- DID MAP CATCH THOSE?You may be thinking that identifying the leading stocks of the market means FAANG. Facebook,Apple, Amazon, Netflix, and Google (Alphabet) have captivated the investing public for yearsnow. They have accounted for an impressive percentage of market gains and have become athermometer of the market. There is no disputing that FAANG stocks have been major marketleaders for a long time now. When, then, did MAP find them? When did they first appear onthe COMPASS-20 buy list? What did the returns look like?These are the questions we sought to answer. When dealing with the most talked about stocksin decades, we wanted to see when they would have showed up on our radar had MAP existedthen. Here’s what we found: The following 5 graphs plot the price of each of the FAANG stocks.The red vertical lines and accompanying dots represent each time the stocks appeared on theCOMPASS-20 buy list. Copyright 2018 Mapsignals.com
We can clearly see that the COMPASS-20 profiled each of them as buys very early in theirgrowth cycle. In fact, when we calculate returns for each stock starting from the first instanceof when our model would have recommended it on the COMPASS 20 list, we see very positivereturns.MAP debuts FANG before it’s called FANG (and FAANG).Not only did we see big returns, we would have caught most of the available returns as well.For FB, AMZN, NFLX, and GOOGL, MAP would have captured an astounding average of nearly95% of the available gains: Copyright 2018 Mapsignals.com
So in this hypothetical back-test, if one had invested in FAANG when they first appeared on theCOMPASS 20, the investor could have earned 87 times their initial capital. This compares withthe less than 3 times for the S&P 500 during the same period.Cumulative returns of FAANG vs. S&P 500The MAP process clearly would have identified the FAANG stocks before anyone was eventalking about them. But that doesn’t mean that FAANG stocks were the best MAP stocks.That’s a whole other story altogether. Copyright 2018 Mapsignals.com
MEET MAP’S NEW FRIEND: DANNNWe wanted to know what a basket of MAP’s top 5 stocks would have looked like over thetesting period. What we found was this nice guy named DANNN. He may seem quiet and easygoing, but he’s a killer. In fact, DANNN crushed FAANG.DANNN is our acronym for Domino’s Pizza, Align Technologies, Nvidia, NetEase, and Netflix. Asyou can see below, the aggregate return of the basket of DANNN Compared to FAANGamounted to nearly 1.5 x the already monstrous return of FAANG.DANNN of course dwarfed the return of the broader stock market over the same time:Again, MAP caught these stocks early in their growth cycle and captured a lion’s share ofthe available gains: Copyright 2018 Mapsignals.com
A MAP FOR THE FUTUREWhat we have here is an immense body of statistically valid, undeniable proof that boils downto one thing: MAP shows how important it is to pay attention to how a stock trades. We justshowed you with exhaustive research that: MAP’s COMPASS 20 buy list beats the market with some or all stocks over many holdingperiods.We can trade MAP’s strongest signals every six months and beat the market over thelong haul.MAP identifies nearly half of the top 5% best performing S&P 500 stocks in the marketon average every year.As back-tested, MAP was early on the FAANG trade well before the acronym was evencoined, and these early signals easily beat the market from when we found them.MAP’s back-tested DANNN tickers had much higher returns than FAANG – by a longshot.Two average guys met each other on Wall Street. They each showed up with a truckload ofquestions. After years of hunting, reading, living, breathing, tweaking, and being in the markets,they came up with an effective way to find the leading stocks of tomorrow. They spent anotherfew years perfecting their process. Then they went out on their own to form MAP.MAP lives its life for the outliers. Malcolm Gladwell said it takes 10,000 hours to become amaster at anything. Jason and Luke have spent close to 100,000 hours on this process tobecome masters. All those hours were spent with one singular goal. To find the best stocks thatthey bet the biggest institutions are buying up. They are the outlier stocks.MAP is the outlier research firm looking for the outlier stocks. They are the ones that changeportfolios and lives.If you want the outlier stocks, you need a MAP. Copyright 2018 Mapsignals.com
Malcolm Gladwell wrote in the book Outliers: The Story of Success, that 10,000 hours is the magic number. He basically said that it takes 10,000 hours to achieve outlier greatness. 10,000 hours to become a chess grand