Transcription
Outliers inStatistical DataVIC BARNETTUniversity of SheffieldandTOBY LEWISUniversity of HullJohn Wiley & SonsChichester - New York - BrisbaneToronto
PrefaceCopyright @ 1978 by John Wiley & Sons Ltd.Reprinted February 1979Reprinted June 1980All rights reserved.No part of this book may be reproduced by any means, nortransmitted, nor translated into a machine language without the written permission of the publisher.Library of Congress Cataloging in Publication Data:Barnett, Vic.Outliers in statistical data.Barnett/Lewis(Wiley series in probability and mathematicalstatistics)Bibliography: p.Includes index.1. Outliers (Statistics) I. Lewis, Tobias, joint author. II. Title,QA276.B2849519.577-21024ISBN 0 471 99599 1Typeset by The Universities Press, Belfast, Northern IrelandPedan byoheuninvrea Press, BeproposedPrinted and bound in Great Briiainat The Pitman Press, BathThe concept of an outlier has fascinated experimentalists since the earliestattempts to interpret data. Even before the formal development of statisticalmethod, argument raged over whether, and on what basis, we should discardobservations from a set of data on the grounds that they are 'unrepresentative', 'spurious', or 'mavericks' or 'rogues'. The early emphasis stressed thecontamination of the data by unanticipated and unwelcome errors or mistakes affecting some of the observations. Attitudes varied from one extremeto another: from the view that we should never sully the sanctity of the databy daring to adjudge its propriety, to an ultimate pragmatism expressing 'ifin doubt, throw it out'.The present views are more sophisticated. A wider variety of aims arerecognized in the handling of outliers, outlier-generating models have beenproposed, and there is now available a vast array of specific statisticaltechniques for processing outliers. The work is scattered throughout theliterature of the present century, shows no sign of any abatement, but hasnot previously been drawn together in a comprehensive review. Our purposein writing this book is to attempt to provide such a review, at two levels. Onthe one hand we seek to survey the existing state of knowledge in the outlierfield and to present the details of selected procedures for different situations.On the other hand we attempt to categorize differences in attitude, aim, andmodel in the study of outliers, and to follow the implications of suchdistinctions for the development of new research approaches. In offeringsuch a comprehensive overview of the principles and methods associatedwith outliers we hope that we may help the practitioner in the analysis ofdata and the researcher in opening up possible new avenues of enquiry.Early work on outliers was (inevitably) characterized by lack of attentionto the modelling of the outlier-generating mechanism, by informality oftechnique with no backing in terms of a study of the statistical properties ofprocedures, and by a leaning towards the hardline view thatoutliers should be either rejected or retained with full import. Even today
viPrefacesufficient attention is not always paid to the form of the outlier model, or tothe practical purpose of investigating outliers, in the presentation ofmethods for processing outliers. Many procedures have an ad hoc, intuitively justified, basis with little external reference in the sense of the relativestatistical merits of different possibilities. In reviewing such techniques wewill attempt to set them, as far as possible, within a wider framework ofmodel, statistical principle, and practical aim, and we shall also consider theextent to which such basic considerations have begun to formally permeateoutlier study over recent years.Such an emphasis is reflected in the structure of the book. The openingtwo chapters are designed respectively to motivate examination of outliersand to pose basic questions about the nature of an outlier. Chapter 1 gives ageneral survey of the field. In Chapter 2 we consider the various ways inwhich we can model the presence of outliers in a set of data. We examinethe different interests (from rejection of unacceptable contamination,through the accommodation of outliers with reduced influence in robustprocedures applied to the whole set of data, to specific identification ofoutliers as the facets of principal interest in the data). We discuss thestatistical respectability of distinct methods of study, and the special problems that arise from the dimensionality of the data set or from the purposeof its analysis (single-sample estimation or testing, regression, analysis ofdata from designed experiments, examination of slippage in multisampledata, and so on).Chapter 3 examines at length the assessment of discordancy of outliers insingle univariate samples. It discusses basic considerations and also presentsa battery of techniques for practical use with comment on the circumstancessupporting one method rather than another.Chapter 4, on the accommodation of outliers in single univariate samples,deals with inference procedures which are robust in the sense of providingprotection against the effect of outliers. Chapter 5 is concerned withprocessing several univariate samples both with regard to the relativeslippage of the distributions from which they arise and (to a lesser extent) inrelation to the accommodation of outliers in robust analysis of the whole setof data.Chapters 6 and 7 extend the ideas and methods (in relation to the threeinterests: rejection, accommodation, identification) to single multivariatesamples and to the analysis of data in regression, designed experiments, ortime-series situations. Chapter 8 gives fuller and more specific attention tothe implications of adopting a Bayesian, or a non-parametric, approach tothe study of outliers. The concluding Chapter 9 poses a few issues forfurther consideration or investigation.The book aims to bring together in a logical framework the vast amountof work on outliers which has been scattered over the years in the variousprofessional journals and texts, and which appears to have acquired a newPrefaceviilease of life over the last decade or so. It is directed to more than one kindof reader: to the student (to inform him of the range of ideas and techniques), to the experimentalist (to assist him in the judicious choice ofmethods for handling outliers), and to the professional statistician (as aguide to the present state of knowledge and a springboard for furtherresearch).The level of treatment assumes a knowledge of elementary probabilitytheory and statistical method such as would be acquired in an introductoryuniversity-level course. The methodological exposition leans on an understanding of the principles and practical implications of testing and estimation. Where basic modelling and demonstration of statistical propriety arediscussed, a more mathematical appreciation of basic principles is assumed,including some familiarity with optimality properties of methods of constructing tests and estimators and some knowledge of the properties of orderstatistics. Proofs of results are formally presented where appropriate, but ata heuristic rather than highly mathematical level.Extensive tables of appropriate statistical functions are presented in anAppendix, to aid the practical worker in the use of the different procedures.Many of these tables are extracted from existing published tables; we aregrateful to all the authors and publishers concerned, and have made individual acknowledgement at the appropriate places in our text. Other tableshave been specially produced by us. The whole set of tables has beenpresented in as compact and consistent a style as possible. This has involveda good deal of selection and re-ordering of the previously published material; we have aimed as far as possible to standardize the ranges of tabulatedvalues of sample size, percentage point, etc.Copious references are given throughout the text to source material andto further work on the various topics. They are gathered together in thesection entitled 'References and Bibliography' with appropriate page references to places of principal relevance in the text. Additional referencesaugment those which have been discussed in the text. These will of courseappear without any page reference, but will carry an indication of the mainarea to which they are relevant.It is, of course, a privilege and pleasure to acknowledge the help of others.We thank Dave Collett, Nick Fieller, Agnes Herzberg, and David Kendallfor helpful comments on early drafts of some of the material. We areparticularly grateful to Kim Malafant who carried out the extensive calculations of the new statistical tables in Chapter 3. Our grateful thanks co also toHazel Howard who coped nobly with the typing of a difficult manuscript.We are solely responsible for any imperfections in the book and should beglad to be informed of them.July, 1977VicBARNETTrToBy LEWIS
ContentsCHAPTER 11.11.21.31.41.51Human error and ignorance 6Outliers in relation to probability models 7Outliers in more structured situations 10Bayesian and non-parametric methods 15Survey of outlier problems 16CHAPTER 22.12.22.32.42.52.6INTRODUCTIONWHAT SHOULD ONE DO ABOUT OUTLYING OBSERVATIONS? 18Early informal approaches 18Various aims 22Models for discordancy 28Test statistics 38Statistical principles underlying tests of discordancy 41Accommodation of outliers: robust estimation and testing 46CHAPTER 3DISCORDANCY TESTS FOR OUTLIERS IN UNIVARIATE SAMPLES 523.1 Statistical bases for construction of tests 563.1.1 Inclusive and exclusive measures, and a recursive algorithm forthe null distributionof a test statistic 613.2 Performance criteria of tests 643.3 The multiple outlier problem 683.3.1 Block procedures for multiple outliers in univariate samples 713.3.2. Consecutive procedures for multiple outliers in univariate samples 733.4 Discordancy tests for practical use 753.4.1 Guide to use of the tests 75ix
xContentsContents3.4.2 Discordancy tests for gamma (including exponential)samples 763.4.3 Discordancy tests for normal samples 893.4.4 Discordancy tests for samples from other distributions 115CHAPTER 4 ACCOMMODATION OF OUTLIERS IN UNIVARIATESAMPLES: ROBUST ESTIMATION AND TESTING 1264.1 Performance criteria 1304.1.1 Efficiency measures for estimators 1304.1.2 The qualitative approach: influence curves 1364.1.3 Robustness of confidence intervals 1414.1.4 Robustness of significance tests 1424.2 General methods of accommodation 1444.2.1 Estimation of location 1444.2.2 Performance characteristicsof location estimators 1554.2.3 Estimation of scale or dispersion 1584.2.4 Studentized location estimates, tests, and confidence intervals 1604.3 Accommodation of outliers in univariate normal samples 1634.4 Accommodation of outliers in exponential samples 171CHAPTER 5 OUTLYING SUB-SAMPLES: SLIPPAGE TESTS1745.1. Non-parametricslippage tests 1765.1.1 Non-parametric tests for slippage of a single population 1765.1.2 Non-parametrictests for slippage of several populations: multiple comparisons 1835.2 The slippage model 1865.3 Parametric slippage tests 1875.3.1 Normal samples 1885.3.2 General slippage tests 1975.3.3 Non-normal samples 2015.3.4 Group parametric slippage tests 2045.4 Other slippage work 205CHAPTER 6 OUTLIERS IN MULTIVARIATE DATA6.1 Outliers in multivariate normal samples 2096.2 Informal detection of multivariate outliers 2196.2.1 Marginal outliers 2206.2.2 Linear constraints 2216.2.3 Graphical methods 2216.2.4 Principal component analysis method 2236.2.5 Use of generalized distances 2246.2.6 Fourier-type representation 227208xi6.2.7 Correlation methods 2276.2.8 A 'gap test' for multivariate outliers 2296.3 Accommodation of multivariateoutliers 231CHAPTER 7 OUTLIERS IN DESIGNED EXPERIMENTS, REGRESSION AND IN TIME-SERIES 2347.1 Outliers in designed experiments 2387.1.1 Discordancy tests based on residuals 2387.1.2 Residual-based accommodation procedures 2467.1.3 Graphical methods 2477.1.4 Non-residual-based methods 2497.1.5 Non-parametric, and Bayesian, methods 2517.2 Outliers in regression 2527.2.1 Outliers in linear regression 2527.2.2 Multiple regression 2567.3 Outliers with general linear models 2577.3.1 Residual-based methods 2577.3.2 Non-residual-based methods 2647.4 Outliers in time-series 266CHAPTER 8 BAYESIANACHES 269ANDNON-PARAMETRIC8.1 Bayesian methods 2698.1.1 Bayesian 'tests of discordancy' 2698.1.2 Bayesian accommodation of outliers 2778.2 Non-parametric methods 282CHAPTER 9 PERSPECTIVE286APPENDIX: STATISTICAL TABLESREFERENCES AND BIBLIOGRAPHYINDEX357289337APPRO-
CHAPTER 1IntroductionFrom the earliest gropings of man to harness and employ the informationimplicit in collected data as an aid to understanding the world he lives in,there has been a concern for 'unrepresentative', 'rogue', or 'outlying'observations in sets of data. These are often seen as contaminating the data:reducing and distorting the information it provides about its source orgenerating mechanism. It is natural to seek means of interpreting orcategorizing outliers-of sometimes rejecting them to restore the proprietyof the data, or at least of taking their presence properly into account in anystatistical analysis.What are outliers and what is the outlier problem? To quote fromFerguson (1961a),the general problem . is a very old and common one. In its simplest form it may bestated as follows. In a sample of moderate size taken from a certain population itappears that one or two values are surprisingly far away from the main group. Theexperimenter is tempted to throw away the apparently erroneous values, and notbecause he is certain that the values are spurious. On the contrary, he willundoubtedly admit that even if the population has a normal distribution there is apositive although extremely small probability that such values will occur in anexperiment. It is rather because he feels that other explanations are more plausible,and that the loss in the accuracy of the experiment caused by throwing away a coupleof good values is small compared to the loss caused by keeping even one bad value.The problem, then, is to introduce some degree of objectivity into the rejection ofthe outlying observations. (Copyright @ 1961 by Regents of the University ofCalifornia; reprinted by permission of the University of California Press)In the light of developments in outlier methodology over the last 15 years,Ferguson's formulation is unduly restrictive in various ways, as we shall see;for example, outlying values are not necessary 'bad' or 'erroneous', and theexperimenter may be tempted in some situations not to 'throw away' thediscordant value but to welcome it as an indication of, say, some unexpectedly useful industrial treatment or agricultural variety. However, the passage brings out most of the essentials of the outlier situation, and will serveas a basis for discussion.
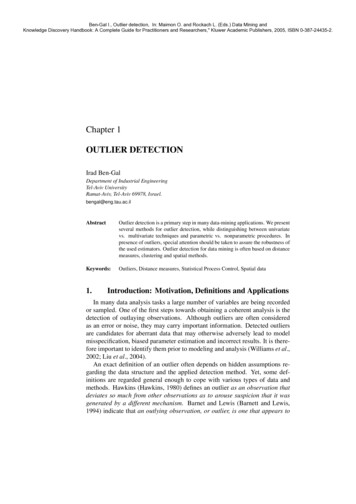
2Outliers in statistical dataThe first point to make is that the problem, as well as being a 'very oldand common one', is an unavoidable one. It is all very well to say, as somestatisticians do, that one should not consider dealing with outlying observations unless furnished with information on their prior probabilities. Somewill not even admit the concept of an outlier unless there is some obviousphysical explanation of its presence! But the fact is that experimentalscientists and other people who have to deal with data and take decisionsare forced to makeN 01 v.10'01 ON'enh enN 00 00 en 0 a,.000 c n o'1 C0CP e0\T90N1 1N'NoON9,MlogIrn ")4judgments about outliers-whether or not to includebook in current use (Calvin et al., 1949, reprinted in 1960) advises itsreaders to use Chauvenet's method: 'Any result of a series containing n .observations shall be rejected when the magnitude of its deviation from theNbM'N('(them, whether to make allowances for them on some compromise basis, andso on. Sometimes this is done in what appears, by modern standards, to bean unnecessarily naive or inefficient way. For example, a chemistry textM 1:31 ('(O N 0 a'(( O, 0o'- It VQ0the 25 grain yields along the southern boundary of the field, results (in lb)C ;, ;) kr N;,-1((rQN00IT enN'Ifor 'outliers'. But even at the time of their work (1912) there were availablebetter methods than Chauvenet's for detecting outliers. Wright's rule(1884), for example, rejected any observation distant more than 3.37estimated standard deviations from the sample mean.What happens if we apply Chauvenet's, or Wright's, method to the 25southern edge grain yields? The sample mean is m 3.95 and the estimatedstandard deviation s 0.463. Neither Chauvenet nor Wright distinguishedbetween s and the population measure o. For rejecting the observation5.09 on the Chauvenet principle we need 5.09-mi/s to exceed 2.33. But(5.09-3.95)/0.463 2.46, so that on this basic there would be some causefor concern about the value 5.09. The opposite conclusion is reached onWright's principle!With the development during this century of more formal approaches tothe statistical analysis of data, objectives have become clearer, principlesoUen0N'InO oo1)tNo tNoN1i.".je?no'?,n01t0oPt"Pis part of the original table given by Mercer and Hall. (Upright numerals areOn these figures alone one might be rather worried about the value 5.09for grain yield in the fourth plot from the western edge. Mercer and Hallwere not concerned only with the edge yields, nor were they on the look out-41)8are found as shown in the second row from the bottom in Figure 1.1, whichgrain yields; italic, straw yields.)Nk1nOV%(nendeviations as large or larger is less than 1/2n'. This rather strange method isone of the earliest extant for dealing with outliers, and dates from themiddle of the nineteenth century (Chauvenet, 1863). We return to it infit to normal distributions. If one is concerned with edge effects and looks at10IcM'0no'Mnomean of all measurements is such that the probability of occurrence of allSection 2.1.Some data which have attracted much interest among statisticians over theyears are the results given by Mercer and Hall (1912) on yields of wheatgrain and straw for 500 similar-sized plots of soil planted with wheat over arectangular field. Both grain yields, and straw yields, seem to provide a good'(-00rn TR40INO4R4R4'.b4t4No01'It00rn00NoNo0 0Noe'n NoMen No't00''-'.It00otr'enRml N'(No\000 'n0r, Itcc -tQN NN0NNo(' No'01
4Outliers in statistical datamore rigorously defined, and a vast array of sophisticated methodology hasbeen constructed. Practical situations are commonly represented in terms ofdifferent possible families of probability models often characterized by somesmall number of parameters. General considerations of situation structure,past experience of similar circumstances, and mathematical tractability, allcombine to suggest one particular family of probability distributions whichmight reasonably be expected to represent the prevailing situation. Sampledata may be analysed to assess the validity of the prescribed model, and toestimate or test hypotheses concerning relevant parameters. This greatersophistication in the design and use of statistital methods makes it no lessimportant to be able to assess the integrity of a set of data. However, thereis some tendency to give greater regard to the processing of data forparameter estimation or testing on the assumption that such and such amodel applies, than to investigating whether the data give added support tothe general considerations which have promoted the model.This is a somewhat dangerous principle. What is known to be a goodstatistical procedure for estimating the mean of a normal distribution may bemost inefficient if the distribution is not normal. The actual data beinganalysed can sound a warning for us! Perhaps one or more observations looksuspicious when the data are considered as a sample from a normaldistribution: they may have been incorrectly recorded (or measured), ofcourse, or they may be a genuine reflection of the basic impropriety ofassuming an underlying normal distribution,Clearly such considerations are vitally important for proper statisticalpractice. We need a battery of techniques for assessing the integrity of a setof data with respect to an assumed model. As a particular aspect of this weneed methods for assessing, rejecting, or making allowances for, outlyingobservations. Such methods do exist, but they tend to appear in a scatteredform throughout the statistical literature. The aim of this book is to bringthem together and to present a unified discussion of ways of handlingoutliers in statistical data, in relation to the nature of the outliers and to theaims of the investigation.At this stage we must make clear what we mean by an outlier. We shalldefine an outlier in a set of data to be an observation (or subset ofobservations) which appears to be inconsistent with the remainderof that set ofdata. The phrase 'appears to be inconsistent' is crucial. It is a matter ofsubjective judgement on the part of the observer whether or not he picksout some observation (or set of observations) for scrutiny. What reallyworries him is whether or not some observations are genuine members ofthe main population. If they are not, they may frustrate his attempts to drawinferences about that population. Any small number of spurious observations in the midst of the data may not be conspicuous in any case: they areperhaps unlikely to seriously distort the inference process. But what characterizes the 'outlier' is its impact on the observer (it appears extreme in someIntroduction5way). Should such observations be foreign to the main population they may,by their very nature, cause difficulties in the attempt to represent thepopulation: they can grossly contaminate estimates (or tests) of parametersin some model for the population. Accordingly the outlier problem takes thefollowing form. We examine the data set. We decide that outliers exist (inthe sense described above). How should we react to them? What methodscan be used to support rejecting the outlying observations, or adjusting theirvalues, prior to processing the principal mass of data? Clearly, the answerdepends on the form of the population; techniques will be conditioned by,and specific to, any postulated model for that population. Thus, methods forthe processing of outliers take on an entirely relative form. It may be, ofcourse, that we do not go beyond the rejection stage in some cases. Ourinterest rests in identifying foreign observations as matters of major concern: they indicate particular matters of practical interest.One conceptual difficulty needs to be recognized at the outset. Opinion isdivided on precisely when it is justifiable to scrutinize outliers. There is littledispute that it is reasonable when outliers exist in the form of errors ofobservation, or mis-recording, that is, when they can be substantiated bypractical considerations such as the sheer impossibility of a recorded value,or an obvious human error. It is sometimes claimed (as remarked above)that these are the only genuine 'outliers' and that if no such tangibleexplanation can be found for apparently unreasonable observations thentheir rejection, or accommodation by special treatment, is invalid. However,two factors lead us to reject this nihilistic attitude. In the first place a varietyof methods have been proposed for dealing with 'non-tangible' outliers;these are used by statisticians and it seems desirable to present them in aclassified manner for their better understanding and application. Secondly,and more fundamentally, the examination of an outlier must have proprietyif viewed in relative terms. Suppose we think that a sample arises from anormal distribution but one observation seems intuitively unreasonable (it isan outlier); an appropriate statistical test confirms its unacceptability. Itseems to beg the question to say that the unreasonable observation shouldnot have been regarded as an outlier, on the grounds that it would not haveappeared unreasonable if we had had in mind, say, a log-normal distribution, as a model for explaining the data. Be this as it may, the rogueobservation did appear as an outlier relative to our original model, whichpresumably had some basis as an initial specification. Examination of theoutlier allows a more appropriate model to be formulated, or enables us toassess any dangers that may arise from basing inferences on the normalityassumption. This is very much the way in which outliers have been discussedin the statistical literature, and seems a fruitful avenue of enquiry.We shall consider in subsequent chapters the various methods availablefor dealing with outliers in different situations, including some of thedifficulties that inevitably arise.
6Outliers in statistical dataIntroductionIn the following sections of this chapter some practical examples arediscussed briefly, to illustrate the ways in which the outlier problem maypresent itself. These also serve to motivate the different forms of statisticalanalysis considered in detail throughout the book.1.1 HUMAN ERROR AND IGNORANCEThere is a class of situations where outliers are readily handled, where themanner of dealing with them is obvious and non-controversial. Such is thesituation when human errors lead to blatantly incorrect recording of data,orwhere lack of regard to practical factors results in serious misinterpretation.In a study of low-temperature probabilities throughout the winter monthsin the British Isles, Barnett and Lewis (1967) analysed extensivedata onhourly temperatures over several years and various geographical sites. In themain, temperatures were recorded in degrees Fahrenheit. Among extensivedata for Wick in northern Scotland the following hourly temperatureswerefound for the late evening of 31 December 1960 and early morningof 1January 1961:43, 43, 41, 41, 41, 42, 43, 58, 58, 41, 417been, perhaps, 2.05 kg. This conclusion is supported by biological considerations, and by the overall pattern of results for a large sample of birds.Whilst one cannot be one hundred per cent certain of the interpretation of1.55 in this last example, some instances arise where recorded values areabsolutely impossible. In a recent student exercise records were kept of thenumbers of times a six occurred in ten throws of ten dice. One studentreturned the results:rnth results:2,0,3,12,2,0,1,1,3Clearly the value 12 cannot be genuine. Furthermore, since ten observationswere asked for, it would seem merely that a comma has been omittedin asequence of numbers which should have read:2,0,3,1,2,2,0,1,1,3These examples all illustrate the effect of non-statistical factors attributable, to a greater or lesser extent, to lack of care in the recordingorpresentation of data. Processing of outliers (or spurious values of any sort)insuch cases is not a matter of statistical analysis, but of native wit! Correctaction also raises no difficulties in most cases. In the examples which follow,however, we will be very much concerned with statistical factors which affectmidnightThe values 58, 58 for midnight and 1.00 a.m. stand out in severe contrastto the others in this time-series section, and initially give one grounds forconcern as to whether or not they are genuine-it seemed very warm atmidnight for New Year in northern Scotland. On further enquiry, however,they were found to be perfectly reasonable! At midnight the MeteorologicalOffice changed its recording unit from degrees Fahrenheit to ' oC, so that indegrees Fahrenheit the values appear as follows (to the nearest degree):43, 43, 41, 41, 41, 42, 43, 42, 42, 39, 39Tmidnightthe occurrence and treatment of outliers.An interesting area of statistical enquiry is the manner in which foodstuffsand general household products are purchased. Table 1.1 shows a frequencydistribution for the number of packets of a particular brand and packet sizeof breakfast cereal (Chatfield, 1974) bought over a given period of time,One aspect which stands out in these data are the two single instances ofpurchases of 39 and 52 packets, which seem somewhat out of line with otherobservations. How should we react to these outliers? There are variouspossibilities.These are much more satisfactory; so much for the 'outliers' 58 and 58!In his Presidential address to the Royal Statistical Society, Finney (1974)gives an interesting example of the way in which recording errors mayappear as outliers in a set of data. He reports on measurements takenon thegrowth of poultry. For one bird, the weights (in kg) for successive weighingsat regular intervals were shown as:1.20, 1.60, 1.90, 1.55, 2.20, 2.25From the manner in which the weights were determined and recorded it wasclearly possible to commit recording errors of 0.50 kg or 1.00 kg. It seemshighly likely that the fourth reading is a mis-recording of what should haveTable 1.1Frequency distribution for numbers of packets of cereal purchased over13 weeks by 2000 customersNo. of packetsFrequency0123456781149 199 129 87 71 43 49 46 44No. of packetsFrequency191No. of packetsFrequency37 380 02029 10 11 12 13 14 15 16 17 1824 4522 23 33821 22 23 24 25 26 27 28 29 30 31 32 330 0 1 0 1 3 2 01 1 0 0 027234 35 360 0 039 40 41 42 43 44 45 46 47 48 49 50 51 52 531 0 0 0 0 0 0 0 0 0 0 0 0 103
8Outliers in statistical dataIntroduction(1) We might be interested in identifying out-of-the-ordinary patterns ofpurchasing behaviour-perhaps due to institutional rather then personalshopping, or indicating hoarding of products in times of potential shortageor expected price rises. The observations 39 and 52 (possibly others) thenbecome of prime interest. We might try to fit some probability distributionto represent the majority of the data, relating to 'reasonable private purchase', and then attempt to consider the outliers relative to that distribution.An appropriate method might lead us to conclude that the observations 39and 52 are anomalous and might cast doubt i
4.2.3 Estimation of scale or dispersion 158 7.3 Outliers with general linear models 257 4.2.4 Studentized location estimates, tests, and confidence inter- 7.3.1 Residual-based methods 257 vals 160 7.3.2 Non-residual-based methods 264 4.3 Accommodation of outliers in univariate normal sam