Transcription
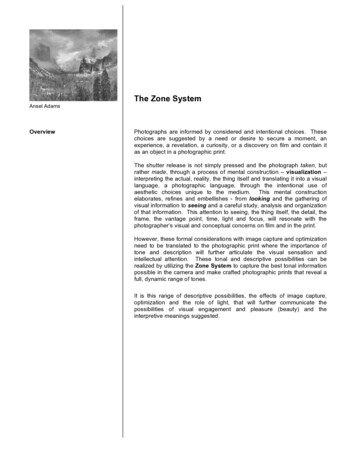
The Zone SystemAnsel AdamsOverviewPhotographs are informed by considered and intentional choices. Thesechoices are suggested by a need or desire to secure a moment, anexperience, a revelation, a curiosity, or a discovery on film and contain itas an object in a photographic print.The shutter release is not simply pressed and the photograph taken, butrather made, through a process of mental construction – visualization –interpreting the actual, reality, the thing itself and translating it into a visuallanguage, a photographic language, through the intentional use ofaesthetic choices unique to the medium. This mental constructionelaborates, refines and embellishes - from looking and the gathering ofvisual information to seeing and a careful study, analysis and organizationof that information. This attention to seeing, the thing itself, the detail, theframe, the vantage point, time, light and focus, will resonate with thephotographer’s visual and conceptual concerns on film and in the print.However, these formal considerations with image capture and optimizationneed to be translated to the photographic print where the importance oftone and description will further articulate the visual sensation andintellectual attention. These tonal and descriptive possibilities can berealized by utilizing the Zone System to capture the best tonal informationpossible in the camera and make crafted photographic prints that reveal afull, dynamic range of tones.It is this range of descriptive possibilities, the effects of image capture,optimization and the role of light, that will further communicate thepossibilities of visual engagement and pleasure (beauty) and theinterpretive meanings suggested.
The Zone SystemDeveloped in 1940 by Ansel Adams with the cooperation of Fred Archer(an instructor at Art Center in Pasadena), the Zone System is a methodfor measuring and controlling the various luminance’s (tonal values) of asubject as visualized to be represented in the final photographic print,whether that representation is literal or a departure from reality.The Zone System divides an image into 11 zones of tonal values from thedarkest value (Zone 0 – black) to the lightest (Zone X – white). Zone Vrepresents 18% middle gray, commonly used as a gray card (18% gray).While the full range of tones is measured within the 11 zones, thedynamic range (Zone I – Zone IX) represents those tonal values that canreveal descriptive qualities in the print, including shadow and highlightdetail. Visualization and using the Zone System with careful attention toimage exposure and image optimization provides the photographer theability to visualize how tonal values will appear in the photographic print.Image Capture andthe Dynamic Tonal RangePutting the Zone System into practice, it is important that light meterreadings are done carefully and consistently when visualizing the subjectvalues and their relationship to the exposure zones that will produce thedesired dynamic tonal range in a print. The light meter needs to be able tomeasure the brightness range of different areas of the subject and relatethe different values to one-stop exposure intervals or exposure values(EV). Exposure values are calibrated within the light meter and refer tospecific shutter speed/aperture combinations. Each increase or decreasein exposure value is equal to twice or half as much light measured. It ishelpful to measure areas that are more or less uniform in tone.The procedure of reading zones with the light meter can be easily utilizedbased on the understanding of middle gray (Zone V) in relationship toother zones. After measuring the range of exposure values of the subject,it is common to set the exposure to a value in the middle of the range. It isnecessary to consider the ASA setting when determining exposure values.
For example, using 400 ASA film, a Zone I reading may have an EV of 8(125 @ f/64) and a Zone IX reading an EV of 16 (125 @ f/4), the desiredZone V value would have an EV of 12 (125 @ f/16) and provide for a fulldynamic tonal range in the print. However, if it is necessary to shift theluminance and brightness to Zone VI to reveal additional descriptiveinformation, one-stop additional exposure can be used, 125 @ f/11, so asto place that luminance in Zone VI and subsequently shift the EV valueswith twice as much light.ExposureEVCharacteristic Curve125@f/648125@f/16125@f/41216The characteristic curve provides a visual profile of tonal information inthe photographic image as recorded on film, paper or a digital file.The toe of the characteristic curve represents the low luminance areas(shadow detail) of the subject and low densities of the negative, or Zones0 – III. This is the film’s first sensitivity to light or its threshold of sensitivity.The straight line of the characteristic curve represents the middleluminance areas of the subject and middle densities of the negative, orZones IV – VII. The ratio between increased exposure and increaseddensity is uniform on this part of the curve.The shoulder of the characteristic curve represents the high luminanceareas (highlight detail) of the subject and high densities of the negative, orZones VII-X. As the maximum possible density is approached, thesteepness of the curve falls off which means that increasing exposureresults in a diminishing increase in density.
Zone Systemand Adobe PhotoshopIn looking at the histogram of the digital file (image), the Curves or Levelscommands or the Histogram palette can be utilized to view all of the tonalvalues and zones. With the Curves command, the brightness of a specifictone or tonal zone can be altered. Using the Eyedropper tool, any part ofthe image can be measured and the value will show up on the curve as asmall circle.Zone IV 102Zone X 255Zone II I 77Zone IX 230Zone II 51Zone VII I 204Zone IZone VII 179 26Zone 0 0Shadow Value 0Zone VIZone V 128 153Highlight Value 255Zone 0 0Zone X 255Zone IZone IX 230 26Zone II 51Zone VII I 204Zone II I 77Zone VII 179Zone IV 102Zone VIShadow Value 0Zone V 128 153Highlight Value 255With the use of the Levels command, to move the values in Zone V towardZone IV in order to make the image brighter, the Brightness/Contrastslider would be moved towards the left on the histogram and vice versa inorder to make the image darker.
Example of the Zone Systemand Adobe PhotoshopZone X254Zone VI153Zone IV102Zone III77Zone VIII204Zone II51Zone VII179Zone I26Zone IX230Zone 06Zone V128
Zone System and Adobe Photoshop In looking at the histogram of the digital file (image), the Curves or Levels commands or the Histogram palette can be utilized to view all of the tonal values and zones. With the Curves command, the brightness of a specific tone or tonal zone can be altered. Using the Eyedropper tool, a