Transcription
Optical Materials 28 (2006) 506–513www.elsevier.com/locate/optmatOptical properties of porous silicon. Part III: Comparisonof experimental and theoretical resultsAndrea Edit Pap a,*, Krisztián Kordás a, Jouko Vähäkangas a, Antti Uusimäki a,Seppo Leppävuori a, Laurent Pilon b, Sándor Szatmári cabMicroelectronics and Materials Physics Laboratories, Department of Electrical and Information Engineering,University of Oulu, P.O. Box 4500, FIN-90014 Oulu, FinlandMechanical and Aerospace Engineering Department, University of California, Engineering IV Room 46-147C,Los Angeles, CA 90095-1597, USAcDepartment of Experimental Physics, University of Szeged, 6720-H Szeged, Dóm tér 9, HungaryReceived 14 September 2004; accepted 28 February 2005Available online 1 June 2005AbstractIn our previous study, the refractive indices of freestanding porous silicon (PS) layers were derived using the envelope method,where the computation is based on the values of local minima and maxima in the oscillations of transmission spectra. In the presentwork, an improved procedure for calculating the optical parameters from the measurements data is described. It is verified by reflection measurements on freestanding samples that optical scattering at the air–PS interface is the main reason for the loss of the transmitted light intensity and thus for the inaccurate results we obtained earlier by the envelope method. This however can be avoided bytaking into consideration the relationship between the optical path in the plane-parallel film and the position of extrema in the transmission spectra. The as-determined effective refractive indices show very good matching with the theoretical calculations by theBruggemanÕs effective medium approximation.Ó 2005 Elsevier B.V. All rights reserved.PACS: 61.43.Gt; 78.20.Bh; 78.20.Ci; 78.35. c; 78.68. mKeywords: Porous silicon; Refractive index; Optical transmission; Optical reflection; Envelope method, FresnelÕs equation; Effective mediumapproximation1. IntroductionThe optical properties of a porous silicon (PS) layerproduced by electrochemical etching are determined bythe thickness, porosity and by the shape and size ofpores [1,3–5]. These structural parameters strongly depend on the manufacturing conditions such as currentdensity, etching time, electrolyte composition, and alsoon the dopant type and concentration of the original*Corresponding author. Tel.: 358 8 5532741; fax: 358 8 5532728.E-mail address: papa@ee.oulu.fi (A.E. Pap).0925-3467/ - see front matter Ó 2005 Elsevier B.V. All rights reserved.doi:10.1016/j.optmat.2005.02.006Si wafer [3–7]. Generally, the PS materials are describedas a homogenous mixture of air, silicon and in somecase, silicon dioxide. From the optical point of view,in the visible and infrared wavelength range, PS can bespecified as an effective medium, whose optical properties depend on the relative volumes of silicon, pore fillingmedium and in some cases silicon oxide, i.e. mainly onthe porosity and on the degree of oxidation of the PSlayer [5].The optical properties of PS layers can be determinedusing both experimental and model based approaches[8]. In the case of experimental methods, one can recordthe transmission or reflection spectra and the parameters
A.E. Pap et al. / Optical Materials 28 (2006) 506–513507anol. The experimental parameters applied in the anodization process are collected in Tables 1 and 2. Thesamples for transmission measurements were relativelythin (3.6–14.4 lm) freestanding layers of PS. The filmswere detached from the wafer by an electrochemical polishing step (Jpol 500 mA/cm2, s 10 s) after the anodization process. For the reflection measurements thick( 200 lm) freestanding layers were prepared each having an anti-reflection layer (porosity gradient) on itsback side. This was obtained by increasing graduallythe anodization current density at the end of the anodization process in 6.5 mA/cm2 steps at every 2 s untilJpol 500 mA/cm2 is reached. After preparation, everysingle sample was flushed separately in absolute ethanoland stored in pentane until the optical measurements.In order to determine the porosity of PS samples andthe anodization rate of electrochemical process, controlsamples were fabricated and investigated. After stripping the samples in 1 M NaOH aqueous solution, thedepth of grooves in Si was measured by a Dektak3 STsurface profiler. The thickness of a stripped layer equalsto that of a dissolved PS layer. Direct thickness measurements of freestanding PS layers were carried outby optical microscopy with a relative standard deviation(RSD) of 1.5% 6 RSD 6 3.8%. The porosity of sampleswas calculated as the fraction of void within the porouslayer, i.e. p (m1 m2)/(m1 m3) where m1, m2 and m3denote the mass of the original, anodized and strippedwafer, respectively. Due to the limited accuracy of massmeasurements and the limited repeatability of samplepreparation, the relative standard deviation in theporosity, is within the range of 0.5% 6 RSD 6 2.2%.In our previous work [1], an electrolyte concentrationof 11.7 M HF and 10.3 M C2H5OH was applied, and thecurrent densities were set to 20, 35, 50 and 65 mA/cm2.The calculated porosities for those samples were lowercompared to the current PS layers, whereas the etchingare calculated using for example the envelope method[9,10] or the FresnelÕs equation. Unfortunately, theseprocedures are limited when the materials investigatedshow strong optical absorption and/or scattering. Inthe case of semi-empirical approaches the refractiveindices are measured using spectroscopic ellipsometryand then the model parameters such as layer thicknessand calculated effective dielectric function are adjustedto fit the experimental spectra by the use of a suitablemodel [5,8,11]. Another semi-empirical way is providedif a PS Fabry–Perot interferometer is fabricated andmeasured, and using the transfer matrix method theoptical parameters are varied to find the best fit of themodel to the measured spectra [5,8,12]. Fully theoreticalsolutions are provided by different effective mediumapproximation (EMA) methods such as Maxwell–GarnettÕs, LooyengaÕs or BruggemanÕs [5,8,14]. Note thatthese approximations are valid only for certain circumstances, thus might lead to different results, when calculating the index of refraction for a given porous system.In this work, various calculation methods based onoptical transmission and reflection measurements areused to extract the refractive index data for freestandingPS layers. The calculated refractive indices are compared with the theoretical ones obtained by BruggemanÕs effective medium approximation. Moreover, thelimitations of the envelope method and the accuracyof the measurements are investigated and described.2. Experimental2.1. Sample preparation and characterizationPS layers with various porosities were fabricated byelectrochemical etching of boron-doped Si wafers(0.015 X cm) in the mixture of hydrofluoric acid and eth-Table 1Preparation conditions and corresponding physical properties of freestanding PS layers for transmission measurementsElectrolyte composition14.55 M HF and 8.5 M11.7 M HF and 10.3 M11.7 M HF and 10.3 M11.7 M HF and 10.3 M11.7 M HF and 10.3 MCurrent density (J)C2H5OHC2H5OHC2H5OHC2H5OHC2H5OH220 mA/cm20 mA/cm235 mA/cm250 mA/cm265 mA/cm2Etching time (s)Porosity ð p D pÞThickness ð t D tÞ135 s800 s400 s250 s260 s40.56% 0.51%46.57% 1.04%51.92% 0.73%57.43% 0.74%60.50% 0.28%3.6 lm 0.1 lm12.9 lm 0.3 lm14.3 lm 0.3 lm11.3 lm 0.2 lm14.4 lm 0.2 lmTable 2Preparation conditions and corresponding physical properties of freestanding PS layers for reflection measurementsElectrolyte composition14.55 M HF and 8.5 M11.7 M HF and 10.3 M11.7 M HF and 10.3 M11.7 M HF and 10.3 M11.7 M HF and 10.3 MC2H5OHC2H5OHC2H5OHC2H5OHC2H5OHCurrent density (J)Etching time (s)Porosity ð p D pÞThickness (t)20 mA/cm220 mA/cm235 mA/cm250 mA/cm265 mA/cm27380 s8420 s6220 s3770 s3450 s40.56% 0.51%46.57% 1.04%51.92% 0.73%57.43% 0.74%60.50% 0.28% 200 lm 200 lm 200 lm 200 lm 200 lm
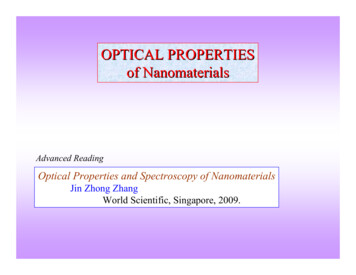
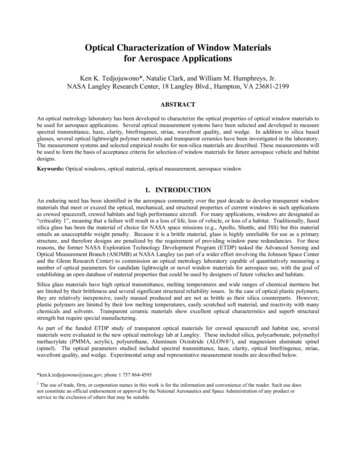
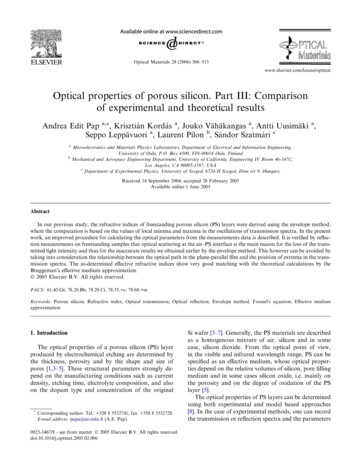
508A.E. Pap et al. / Optical Materials 28 (2006) 506–513rates are found similar. For the recent samples, the massof the Si skeleton (m2 m3) fits well to the mass calculated from the porosity and geometry of films m2 m3 qSitr2p(1 p), where r is the radius of the poroussilicon samples and qSi is the density of crystalline silicon. This matching validates the recent porosity measurements, and suggests that a systematic error wasmade when measuring mass in our previous work. Onthe other hand, the previously published refractive indexvalues and absorption coefficients were not affected bythe error of these parameters. This is due to the methodfor calculating the optical coefficients from the recordedtransmission spectra (envelope method).2.2. Optical measurementsOptical transmission and reflection measurementswere carried out in the 700–1700 nm spectral range inambient air using an ANDO AQ-6315 optical spectrumanalyzer. The accuracy of optical measurements was enhanced by repeating and averaging twenty measurements for each wavelength for data acquisition andalso small step sizes (0.2 nm) for scanning the wavelength range with the monochromator. The experimental arrangements used for optical transmission andreflection measurements are drafted in Fig. 1.The optical transmittance T was calculated from themeasured transmitted light intensity through the freeoptical path I0 and samples IS, T IS/I0. In the reflectionmeasurements, the reference intensity IM(0) was set upusing a gold mirror in the position of the sample. Thereflected intensity from the mirror IM was measuredand then corrected for the wavelength dependent reflectivity of the mirror fC (Edmund Optics Ltd., Optics andOptical Instruments Catalog, 2004, p. 98) as IM(0) IM/fC. Thus the reflectivity of the samples R is obtained asR IS/IM(0), where IS is the reflected intensity from thePS films. (Note that, I0, IS and IM are on a linear scale.)3. Results and discussionThe envelope method [9] gives a simple solution tocalculate the optical parameters of a thin transparentdielectric film from a measured transmission T spectrumin a non-absorbing surrounding medium. Using theoscillations of T, the refractive index nenvPS of a thin filmis:22 2 0.5 0.5nenvÞ ;ð1ÞPS ¼ ðN þ ðN n0 n1 ÞwhereN¼n20 þ n21T max T minþ 2n0 n1.2T max T minð2ÞThe Tmax and Tmin are the envelope functions of the local minima and maxima in the transmission spectrum; n0and n1 are the refractive indices of media in front andbehind the film. (In our measurements n0 n1 1.)In our previous study [1], four types of freestandingPS membranes of different porosities were manufacturedFig. 1. Schematics of experimental setups used for optical (a) transmission and (b) reflection measurements. The transmitted beam is perpendicularto the sample, while in the reflection measurements the angle of incidence is 88.5 .
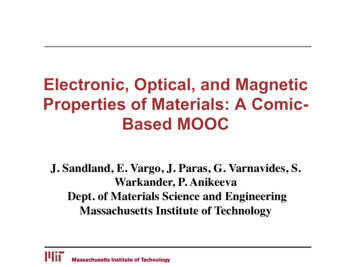
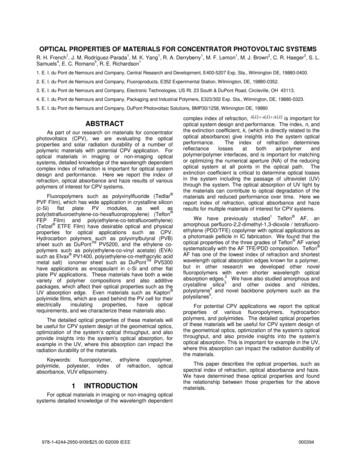
A.E. Pap et al. / Optical Materials 28 (2006) 506–513and their optical transmission was measured. It was observed that with increased membrane porosity, thetransmitted light intensity increases and the refractive509index decreases. The membranes had poor transparencyat shorter wavelengths (k 800 nm) because of the fundamental optical absorption in Si. The calculatedFig. 2. (a) Transmission spectra of freestanding PS films with different porosity and thickness and (b) the corresponding refractive indices calculatedusing the envelope method.
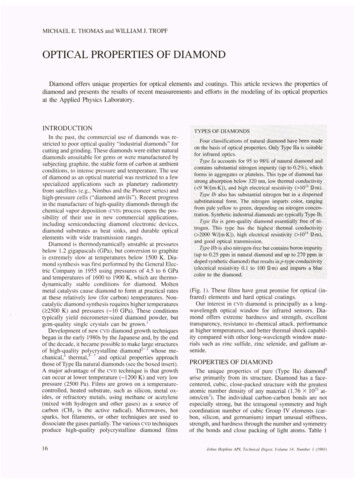
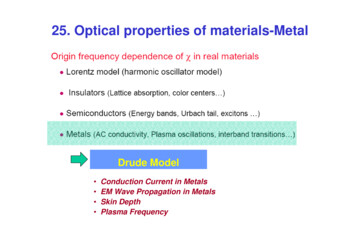
510A.E. Pap et al. / Optical Materials 28 (2006) 506–513refractive indices (k 800 nm) of PS films were in qualitative agreement with those expected by the effectivemedium theory (i.e. a higher porosity results in lower index of refraction and vice versa). On the other hand thevalues extracted from the measurements by the envelopemethod were lower (factor of 0.6) than those calculated with BruggemanÕs theory. In addition, unexpectedanomalous dispersion of the index of refraction was alsoobserved. Clear explanation of these results could not berevealed.In our current work, both sample preparation andtransmission measurements with much higher accuracyhave been repeated. Thinner plane-parallel freestandingfilms have been created ( 12 lm instead of 30 lm) todecrease the frequency of oscillations in the recordedtransmission spectra. In order to increase the resolutionof optical measurement, the step of wavelength scanningwas shortened (from 1.3 nm to 0.2 nm) and highernumber of averaging was used for data acquisition (20instead of 9). In Fig. 2, the recorded transmission spectra and the corresponding calculated (envelop method)refractive indices are collected for five different PS films.As it can be seen, the current results are in good agreement with the previous study [1]: the computed refractive indices are still lower than it could be expectedfrom the effective media, and show anomalous dispersion. Note that the reliability of the measurement is significantly improved for shorter wavelengths than1000 nm as compared to the previous study.The results of the repeated experiments and calculations suggest that the source of anomalies is in the envelope method itself. The values of nenvPS given by theenvelope method depend on Tmax and Tmin. If one obtains a lower nenvPS than expected, it means the envelopefunctions are not opened up: Tmax is lower and Tmin ishigher compared to the real case. Physically, this canbe attributed to optical losses (absorption and scattering) when measuring the transmittance of the samples.Since the envelope method includes the parameter ofabsorption (for weekly absorbing media) the only plausible explanation for the supposed losses is an opticalscattering in the porous media. Additionally, the experienced anomaly in the refractive indices suggests that theextent of the light scattering is lower in the IR then inthe visible.To verify our presumption, besides the transmissionspectra, optical reflection spectra were recorded. Tominimize the back-side reflection, freestanding PS layers of 200 lm thickness with anti-reflection layeron the back-side were fabricated (Fig. 3(a)). The porosity of the samples was the same as those used inthe transmission measurements (within the repeatabilityof sample preparation). The reflectivity of a polishedSi wafer was also measured and used for furthercalculations:– First, the refractive index dispersion curve for nFresnelSiis determined using FresnelÕs equation for anFig. 3. (a) Measured reflectivity of Si and PS samples. (b) Calculated index of refraction for Si from the reflection measurements, and derivedeffective refractive indices for the porous samples. (c) Calculated theoretical reflection using the theoretical effective refractive indices. (d) Refractiveindices calculated from measured optical reflection.
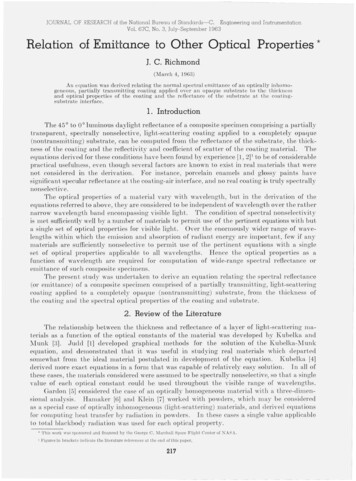
A.E. Pap et al. / Optical Materials 28 (2006) 506–513Fresnelair-Si interfaceðnffiffiffiffiffiffi 1Þ2 ðnFresnelþ 1Þ2 , i.e.SiSipffiffiffiffiffiffi RSi ¼ pFresnelnSi¼ ð RSi þ 1Þ ð RSi 1Þ.the index of refraction– In the second step, from nFresnelSiEMAfor the effective media nPS is calculated from BruggemanÕs effective medium approximation. BruggemanÕs theory describes the dielectric constant of atwo-component materials system:e1 eeffe2 eefffþ ð1 f Þ¼ 0;ð3Þe1 þ 2eeffe2 þ 2eeffwhere f is the volume fraction of one of the components, e1 and e2 are the dielectric functions of thecomponents and eeff is the effective dielectric functionof the mixed material. From the MaxwellÕs equationsthe dielectric permittivity is e n2 k2 where k is theextinction coefficient. For a transparent or apweaklyffiffiabsorbing medium k n, thus we get n ¼ e, [13].Accordingly, the effective refractive index is describedwithpn2pore n2PSn2Si n2PSþð1 pÞ¼0n2pore þ 2n2PSn2Si þ 2n2PSð4Þsince the volume fraction of voids equals to theporosity of our samples f p. Thus, for the mixtureof air and Si [14] (Fig. 3(b)) we get EMAnPS ¼ 0.5 3p 1 n2Si þ 2n2Si 1þ 0.5 0.5 2 .3p 1 n2Si þ 2n2Si 1 þ 8n2Sið5Þ– From the as-obtained nEMAvalues the theoreticalPSreflectivity of the corresponding effective media canbe calculated using the FresnelÕs equation again(Fig. 3(c)).– Another series of refractive indices can be determinedfrom the measuredof the porous samplespffiffiffiffiffiffiffi reflectivitiespffiffiffiffiffiffiffiby nFresnel¼ðRþ1Þ ð1 RPSPS Þ (Fig. 3(d)).PSThe difference between the experimental (Fig. 3(a))and theoretical (Fig. 3(c)) reflectivities is considerable.At shorter wavelengths, the measured reflectivity is significantly lower than the theoretical one, though the dif-511ference tends to decrease for longer wavelengths. It alsosupports our presumption about the scattering phenomena. Namely, considering a typical feature size ofd 30 nm for the pore diameters and Si wall thicknessin the skeleton, the size parameter a pd/k is between 0.13 and 0.06 for the applied wavelength range. Suchsize parameter satisfies the criterion for Rayleigh scattering, where the scattered intensity is proportional to a4. Itmeans that the scattered intensity is about 30 timessmaller than that for 700 nm, which seems to be inagreement with the phenomena observed in the reflection spectra of PS films.In order to visualize the scattering on the porous surface, a PS sample and a pristine Si bulk were illuminatedusing a visible HeNe laser beam (633 nm, TEM00). Inthe case of the PS surface, the spot of the incident laserbeam can clearly be seen from any direction indicatingthat light is scattered in the whole solid angle (Fig.4(a)) according to the isotropic nature of Rayleigh scattering. On the contrary, the surface of a pristine Si waferbehaves as a secularly reflecting mirror: the spot of theincident laser beam is practically invisible from anydirection different from the optical axes (Fig. 4(b)).The reflection measurement has demonstrated thepresence of light scattering on the PS surface, but didnot solve the computation problem. The methods (i.e.envelope method as well as calculation from FresnelÕsreflection) used to recover the refractive indices fromthe recorded transmission and reflection spectra failedto provide accurate data. Both methods lack to handlethe intensity loss caused by scattering.One can overcome such limitations by introducing amethod, which is not affected by the losses. Consideringthe fact that the positions of extrema in the transmissionspectra are fairly independent from both scattering andabsorption, we can utilize the well-known relationshipbetween the layer thickness t, the refractive index andthe positions of extrema nintPS ¼ Mk1 k2 2tðk2 k1 Þ[5,8,9]. Here, M is the number of oscillations (fringes)between two extrema at k1 and k2. This equation is alsoused in the envelope method, when the extraction oflayer thickness is aimed from the previously calculatedrefractive indices. However, we suggest an opposite approach: after determining the layer thickness of samplesFig. 4. Demonstration of light scattering from the surfaces of a porous silicon film (a) and from pristine wafer (b). In the latter case, the beam isshown with the apex of scalpel.
512A.E. Pap et al. / Optical Materials 28 (2006) 506–513by microscopy we calculate the refractive indices of thefreestanding PS layers from the positions of adjacentmaxima or minima in the recorded optical transmissionspectra (Fig. 5). The values obtained from the positionsrefractive index40.6%, 3.6 µm3.02.82.62.42.22.0nintPS from minima1.8from maximanintPS1.6600nEMAPS8001000 1200 1400 1600 1800wavelength (nm)2.8refractive index46.6%, 12.9 µm3.02.62.42.22.01.81.6600nintPS from minimaintnPSfrom maximaEMAnPS8001000 1200 1400 1600 1800wavelength (nm)refractive index51.9%, 14.3 µm2.82.62.42.22.0intnPSfrom minima1.8intnPSfrom maxima1.6600EMAnPS8001000 1200 1400 1600 1800wavelength (nm)refractive index57.4%, 11.3 µm3.0intnPSfrom minima2.8nintPS from maxima2.6n EMAPS2.42.22.01.81.66008001000 1200 1400 1600 1800wavelength (nm)intfrom minimanPS2.8refractive index60.5%, 14.4 µm3.0intfrom maximanPS2.6EMAnPS2.42.22.01.81.66008001000 1200 1400 1600 1800wavelength (nm)Fig. 5. Refractive indices of PS layers as-calculated from the positionsof extrema in the transmission spectra and from BruggemanÕs EMA.of minima are in excellent agreement with those obtained from the wavelengths of maxima. The as-extracted results show good matching with thoseobtained by theoretical considerations, which meansthat the effective index of refraction for the mixture ofnano-porous Si and air follows the BruggemanÕs effective medium theory. It is worth noting that the experimentally retrieved index of refraction is always largerthan that predicted by the BruggemanÕs method. Themean of relative difference between the experimentaland theoretical values is 9.1% with a standard deviationof 4.4%. The minimum and maximum differences are1.5% and 17.6%, respectively.Now, by using the accurate refractive indices, one canapproximate the corresponding values of Tmax and Tminenvelopes for the idealized transmission spectra usingEqs. (1) and (2). By substituting the measured PS layerthickness, the accurate index of refraction and theapproximated Tmax and Tmin values into0.51 ðn þ n0 Þðn1 þ nÞð1 ðT max T min Þ Þa ¼ lnð6Þt ðn n0 Þðn1 nÞð1 þ ðT max T min Þ0.5 Þone gets the approximated absorption coefficients forthe PS film [9]. These values are typically similar orslightly smaller compared to those we can calculate directly by Eqs. (1) and (2) from the experimental observations (see Fig. 2).In Ref. [2] various Bragg reflectors based on periodically alternated porous silicon layers were fabricatedand analyzed. The calculation of the Bragg conditionskBragg ¼ m2 ðnL tL þ nH tH Þ was based on the refractive indices extracted by the envelope method [1]. Using typicallayer thickness values of tH 440 nm and tL 450 nmfor the layers having higher nH and lower nL index ofrefraction, the Bragg orders m for the stop bands inthe measured 400–1700 nm spectrum ranges were calculated. In the spectra, we found a stop band starting closeto 1700 nm and another one around 900 nm, both whichshift towards the shorter wavelengths when increasingthe numbers of alternating periods in the PS stack.The shift of the bands was explained by the decreaseof layer thickness when stacks having higher numbersof periods were manufactured; and by the supposedanomalous dispersion of refractive indices. For the stopband appearing at the longer wavelengths m is calculated as a second order reflection. Considering that therefractive indices of PS obtained earlier by the envelopemethod and the current results for the longer wavelengths are very similar, the current results support thatthe stop band is the 2nd harmonic of the first Bragg condition. The band appearing around 900 nm—as we concluded earlier—belonged to the 3rd Bragg order. Now,if we take into account that the accurate values for nPSare considerably higher than those calculated earlierfor wavelengths close to the visible, we get that the bandmost likely corresponds to the merged bands of the 4th
A.E. Pap et al. / Optical Materials 28 (2006) 506–513and 5th Bragg condition; and the 3rd harmonics is mostlikely merged with the 2nd one. Finally, the shift and thebroadening of reflection bands are due to the thicknessvariation in the layers and because of the normal dispersion of refractive indices.4. ConclusionsThis paper gives a comparative study on the opticalproperties of porous silicon layers obtained by variousexperimental and model-based approaches. In the viewof the recent findings the following conclusions aredrawn:– When studying the optical properties of porous mediaof 30 nm pore size, one has to consider photon scattering from the pores in the near infrared spectrum.– If scattering takes place, the optical parameters cannot be derived precisely from the transmission spectrausing the envelope method because the values of localextrema in the transmission spectra Tmax(k) andTmin(k) used for calculating the index of refraction,absorption, and film thickness are affected by thescattering losses. Since the relative positions ofextrema are fairly independent on the scatteringlosses, the index of refraction can be precisely calculated from nintPS ¼ Mk1 k2 2tðk2 k1 Þ the criteria ofinterference for a film of t thickness. The as-calculated refractive indices show normal optical dispersion on the contrary to the anomalous dispersionobtained using the envelope method.– The as-calculated refractive indices agree well withthe BruggemanÕs effective medium approximation.513AcknowledgmentsThe technical support provided by the ElectronicsLaboratory, University of Oulu is acknowledged. Andrea Edit Pap thanks the grants given by the EMPARTResearch Group of Infotech Oulu, Oulun YliopistonTukisäätiö and Naisten Tiedesäätiö. Krisztián Kordásis grateful for the Academy Research Fellow postreceived from the Academy of Finland.References[1] K. Kordás, A.E. Pap, S. Beke, S. Leppävuori, Opt. Mater. 25(2004) 251.[2] K. Kordás, S. Beke, A.E. Pap, A. Uusimäki, S. Leppävuori, Opt.Mater. 25 (2004) 257.[3] K. Kordás, J. Remes, S. Beke, T. Hu, S. Leppävuori, Appl. Surf.Sci. 178 (2001) 290.[4] O. Bisi, S. Ossicini, L. Pavesi, Surf. Sci. Rep. 38 (2000) 1.[5] L.T. Canham, Properties of Porous Silicon, IEE, INSPEC,London, 1997, pp. 3–43 and 223–246.[6] S. Zangooie, Fabrication, Characterization and Applications ofPorous Silicon Thin Films and Multilayered Systems (LinköpingUniversitet, SE-581 83, Sweden, 1999) pp. 11–20.[7] C. Rotaru, N. Tomozeiu, G. Cracium, J. Mol. Struct. 480–481(1999) 293.[8] W. Theiss, Surf. Sci. Rep. 29 (1997) 97.[9] J.C. Manifacier, J. Gasiot, J.P. Fillard, J. Phys. E 9 (1976)1002.[10] Y. Laghla, E. Sched, Thin Solid Films 306 (1997) 67.[11] G.E. Jellison Jr., F.A. Modine, J. Appl. Phys. 76 (1994)3758.[12] J. He, M. Cada, Appl. Phys. Lett. 61 (1992) 2150.[13] J.I. Pankove, Optical Processes in Semiconductors, Prentice-Hall,Inc. Englewood Cliffs, New Jersey, 1971, pp. 87–91.[14] H.F. Arrand, Optical Waveguides and Components Based onPorous Silicon, University of Nottingham, UK, 1997, pp. 63–66.
Optical properties of porous silicon. Part III: Comparison of experimental and theoretical results Andrea Edit Pap a,*, Krisztia n Korda s a, Jouko Va ha kangas a, Antti Uusima ki a, Seppo Leppa vuori a, Laurent Pilon b,Sa ndor Szatma ri c a Microelectronics and Materials Physics Laboratories,