Transcription
ernative environmental futures options for actibility in south africa what affects our environms options for action land inland water marinaffects our environment environmental governa inland water marine and coastal resources hronmental governance biodiversity and ecosyscoastal resources human vulnerability to environ biodiversity and ecosystem health human settulnerability to environmental change atmospheealth human settlements alternative environmeSouth AfricaEnvironment OutlookA report on the state of the environment
South AfricaEnvironment OutlookA report on the state of the environment
South Africa Environment Outlook. A report on the state of the environmentFirst published in 2006 Department of Environmental Affairs and TourismISBN 0-621-36422-3This document may be reproduced in whole or in part for educational or non-profit purposes without specialpermission from the copyright holder, provided that acknowledgement of the source is made. No use of thispublication may be made for resale or for any other commercial purpose whatsoever without prior writtenpermission from the Department of Environmental Affairs and Tourism.Suggested citation for bookDepartment of Environmental Affairs and Tourism. 2006. South Africa Environment Outlook. A report on the stateof the environment. Department of Environmental Affairs and Tourism, Pretoria. 371pp.PublicationThis publication is available both in hard copy and on the website of the Department of Environmental Affairs andTourism at www.deat.gov.za. The report is also available on CD-ROM. A charge may be made according to thepricing policy, which can be seen on the website.This publication is available at the following libraries:National Library of South Africa, Pretoria DivisionNational Library of South Africa, Cape Town DivisionNatal Society Library, PietermaritzburgLibrary of Parliament, Cape TownBloemfontein Public LibraryJohannesburg Public LibraryEastern Cape Library Services, King William’s TownCentral Regional Library, PolokwaneCentral Reference Library, NelspruitCentral Reference Collection, KimberleyCentral Reference Library, MafikengFor further information, please contactDepartment of Environmental Affairs and TourismPrivate Bag X447Pretoria 0001Republic of South AfricaWeb site: 8http://www.deat.gov.zaDisclaimerThis report is based on papers produced by expert groups and other additional information gathered by theproject team. The views it contains are not necessarily those of Government. The Department of EnvironmentalAffairs and Tourism and other agencies do not accept responsibility in respect of any information or advice givenin relation to or as a consequence of anything contained herein.Every effort has been made to contact and acknowledge copyright holders. However, should any infringementhave inadvertently occurred, the Department of Environmental Affairs and Tourism wishes to be notified. We takethis opportunity to offer our apologies. In the event of a reprint, any errors will be corrected. For a listing of errorsor omissions in this report found subsequent to printing, please visit our website at 8http://www.deat.gov.za.Printed and bound in South Africa by Formeset Printers on behalf of the Government PrinterTeam for preparation of the South Africa Environment OutlookDirector: Dr Rudi PretoriusIntegrative writers: Darryll Kilian, Donald Gibson, Dr Caroline Henderson, Dr Nicholas King, Dr Rudi Pretorius, andEster KochCopy editing: Dr Elisabeth Lickindorf and Dr Richard ClarkCover and layout design: Hot Tomato CommunicationsCommunications: Felix Motsiri, Kelebogile Mogajane, Mphati Nyewe, and Jay SinghIndex: Index prepared by Indexing Specialists (UK) Ltd., Hove, East Sussex, United Kingdom
South AfricaEnvironment OutlookA report on the state of the environmentSouth Africa Environment Outlooki
ii
MINISTER’S MESSAGEIn September 2002, South Africa hosted the World Summit onSustainable Development, underlining our commitment towardssustainable development. As people across South Africa are rising tomeet the challenge of sustainable development, they are seekingaccurate up-to-date information about the state of the environment tohelp them make better decisions in all aspects of their lives. I amtherefore pleased to present the South African National State of theEnvironment Report, the second in the series. The first report wasreleased in 1999.This report presents a picture of the condition of the environmentand natural resources in South Africa. It discusses the socio-economicfactors and external pressures affecting the environment and itsmanagement. The report also highlights our vulnerability to anenvironment that is changing more rapidly than ever before. Based oncurrent trends, the report also provides us with a glimpse of what thefuture of our environment may look like twenty years from now. Thereport highlights what South Africa has done to protect and manage theenvironment and to promote sustainable development.It is clear from the information contained in this report that the stateof our environment will determine the level of our prosperity now and forfuture generations. Over-exploitation of our natural resources isincreasingly leading to environmental degradation and contributing toreduced ecosystem services. Reduced ecosystem services in turn contribute to poverty. As we strive to address socialequity and economic development in the years to come, our ability to improve the state of the environment and secureenvironmental sustainability will shape our future.I sincerely hope that this report will inform people about the state of our environment and that the information containedin the report will be put to good use.Marthinus van SchalkwykMinister of Environmental Affairs and TourismSouth Africa Environment Outlookiii
ACKNOWLEDGEMENTSThis report was compiled in collaboration with manyorganizations and institutions that are acknowledged andsincerely thanked for their contributions. In addition to thespecialist team and their associated organizations, and thetechnical support staff (all detailed below), many stakeholders,too numerous to name, attended a National PlanningWorkshop on 18 and 19 November 2004 to assess andprioritize themes and issues for inclusion in this report.Further, a scenario development workshop was held from 8 to10 June 2005 at which various alternative environmentalfutures were discussed. We are grateful to all the participantswho attended these workshops for their valuablecontributions.Last, we sincerely thank the many organizations andindividuals who provided data and information that was usedas the basis for analyses in this report. All sources of data areacknowledged and referenced where they appear in thereport.Contributing researchers:Background studies, papers and notes were prepared on awide range of thematic issues relating to the report. Thecontributors were:Chapter 1: Sustainability in South AfricaDarryll Kilian and Donald Gibson (SRK Consulting) and DrRudi Pretorius (Department of Environmental Affairs andTourism)Chapter 2: What affects our environment?Socio-economics: Darryll Kilian, Tim Hart, Kim Moonsamy,and Vivienne Pio (SRK Consulting). Economics: Mike Goldblattand Julie Middleton (Palmer Development Group), and EsterKoch (Department of Environmental Affairs and Tourism)Chapter 3: Environmental governanceSaliem Fakir, Jenny Tholin, Anthea Stephens (WorldConservation Union – IUCN), Paul Kapelus (African Institutefor Corporate Citizenship), Dr Rudi Pretorius (Department ofEnvironmental Affairs and Tourism), and Donald Gibson (SRKConsulting)Chapter 4: LandDonald Gibson (SRK Consulting), Garry Paterson and TerryNewby (Institute for Soil, Climate and Water, AgriculturalResearch Council), Professor Michiel Laker (Professoremeritus, University of Pretoria), and Professor Timm Hoffman(Institute for Plant Conservation, University of Cape Town)Chapter 5: Biodiversity and ecosystem healthDr Nick King, Tessa Rosmarin, Yolan Friedmann (EndangeredWildlife Trust), Dr Belinda Reyers (Council for Scientific andIndustrial Research), Professor Norman Owen-Smith (Centrefor African Ecology, University of the Witwatersrand), DonaldGibson (SRK Consulting), and Ester Koch (Department ofEnvironmental Affairs and TourismivChapter 6: Inland waterFiona Cessford, Jacky Burke, John Cowan, and DonaldGibson (SRK Consulting)Chapter 7: Marine and coastal resourcesLara Atkinson and Dr Barry Clarke (Anchor EnvironmentalConsultants), Antarctica and islands: Professor John Cooper(University of Cape Town), Dr Rudi Pretorius (Department ofEnvironmental Affairs and Tourism), Donald Gibson(SRK Consulting), and Ester Koch (Department ofEnvironmental Affairs and Tourism)Chapter 8: AtmosphereYvonne Scorgie and Cornelia Venter (Airshed PlanningProfessionals)Chapter 9: Human settlementsDarryll Kilian, Dr Rudi Pretorius (Department of EnvironmentalAffairs and Tourism), Waste – Hazel Fiehn and Jarrod Ball(Jarrod Ball and Associates), and Energy: Dr Mark Howells(Energy Research Centre, University of Cape Town)Chapter 10: Human vulnerability to environmentalchangeDr Scott Drimie and Johan van Zyl (Human SciencesResearch Council)Chapter 11: Alternative environmental futuresTim Hart (SRK Consulting), Professor Philip Spies (CreativeFutures Network; Institute for Futures Research, StellenboschUniversity), and Dr Caroline Henderson (SRK Consulting)Chapter 12: Options for actionDonald Gibson and Dr CarolineConsulting)Henderson(SRKIndependent reviewers of technicalstudies:Socio-economics and human settlements:Dr Owen Crankshaw (University of Cape Town) and SharonLewis (National Treasury)Economics:Professor James Blignaut (University of Pretoria)Environmental governance:Jonathan Hanks (Incite Sustainability; Graduate School ofBusiness, University of Cape Town)Land:Professor Timm Hoffman (University of Cape Town) andProfessor Michiel Laker (Professor emeritus, University ofPretoria)Biodiversity and ecosystem health:Professor Richard Cowling (Nelson Mandela MetropolitanUniversity), Professor Albert van Jaarsveld (StellenboschUniversity), and Kristal Maze (South African NationalBiodiversity Institute)
Inland water:Professor Jenny Day (University of Cape Town) and Dr SteveMitchell (Water Research Commission)Marine and coastal resources:Professor Charles Griffiths (University of Cape Town)Atmosphere:Professor Harold Annegarn (University of Johannesburg)Waste management:Peter Novella (Wasteman)Human vulnerability:Professor Colleen Vogel (University of the Witwatersrand)and Angela Mathee (Medical Research Council)Copy editing:Dr Elisabeth Lickindorf and Dr Richard ClarkQuality review:Dr Rudi Pretorius and Ester Koch (Department ofEnvironmental Affairs and Tourism)Proofreading:Allison Burger (SRK Consulting), Dr Rudi Pretorius, Dr FransJordaan, Ester Koch, Reinette van Zyl, and Kirshen Pillay(Department of Environmental Affairs and Tourism)Technical support team:Data management & GIS:Angelique Brooksbank and Maryna Strydom (SRKConsulting), and Deon Marais (Department of EnvironmentalAffairs and Tourism)Communications:Felix Motsiri and Kelebogile Mogajane (SRK Consulting),Mphathi Nyewe (B-Line Advertising), and Jay Singh(Department of Environmental Affairs and Tourism)Graphic design and layout:Kim Heubner, Janet Peace, Sheralyn Stelling (ProjectManager), Desireé David, Kelly Sutton, Tanya Tiffin andMichelle Hochstadter (Hot Tomato Communications)Graph editing and formatting:Ester Koch (Department of Environmental Affairs andTourism)Photographic material – sourcing and selection:Ester Koch, Dr Rudi Pretorius, and Kirshen Pillay (Departmentof Environmental Affairs and Tourism), and Kim Heubner,Janet Peace, Sheralyn Stelling, and Cheri Ward (Hot TomatoCommunications)Preparation of final text for layout:Ester Koch, Kirshen Pillay, and Rudi Pretorius (Departmentof Environmental Affairs and Tourism).Photo credits:Thank you to all who contributed the excellent images forthe publication; as well as to South African Tourism,IMAGES24.co.za , and Trace Images.Project Management Committee:Dr Rudi Pretorius and Ester Koch (Department ofEnvironmental Affairs and Tourism); Darryll Kilian and DonaldGibson (SRK Consulting).Project Steering Committee:Dr Rudi Pretorius, Ester Koch, Joyce Phoshoko (Departmentof Environmental Affairs and Tourism – State of Environment);Donald Gibson, Darryll Kilian, Nick Holdcroft (SRK Consulting);Fred van Zyl (Department of Water Affairs and Forestry);Johann Kotzé (Department of Environmental Affairs andTourism – Tourism); Obed Baloyi (Department ofEnvironmental Affairs and Tourism – Pollution and WasteManagement); Muleso Kharika (Department of EnvironmentalAffairs and Tourism – Biodiversity and Heritage);Marisa Kashorte (Department of Environmental Affairs andTourism – Marine and Coastal Management); Yusuf Patel(Department of Provincial and Local Government).South Africa Environment Outlookv
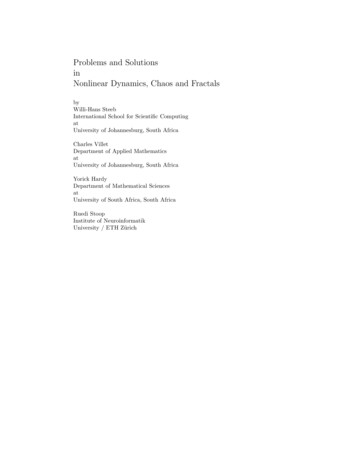
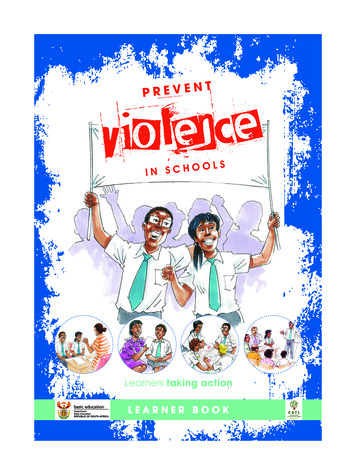
MAP OF SOUTH AFRICA SHOWING PROTECTED AREASvi
CONTENTSMinister’s messageiAcknowledgementsiiAbout this reportxiiiSynthesisxviPART I: SETTING THE SCENEChapter 1: Sustainability in South AfricaChapter 2: What affects our environment?317PART II: STATE OF THE ENVIRONMENTChapter 3: Environmental governance53Chapter 4: Land87Chapter 5: Biodiversity and ecosystem health107Chapter 6: Inland water143Chapter 7: Marine and coastal resources169Chapter 8: Atmosphere201Chapter 9: Human settlements235PART III: HUMAN VULNERABILITY TO ENVIRONMENTAL CHANGEChapter 10: Human vulnerability to environmental change273PART IV: OUTLOOK: 2005-2025Chapter 11: Alternative environmental futures297PART V: OPTIONS FOR ACTIONChapter 12: Options for action317AnnexuresAnnexure 1: Published reports on the state of the environment332Annexure 2: Millennium Development Goals– Summary of progress towards targets334Annexure 3: Suggested actions for addressing priority environmental issues340Acronyms and abbreviations346Glossary352Subject index364South Africa Environment Outlookvii
LIST OF TABLESBiodiversity and ecosystem healthSustainability in South AfricaTable 1.1: River ecosystem services and functionsTable 1.2: Environmental Sustainability Index rankingand Ecological Footprints for NEPAD member countriesTable 1.3: Priority environmental issues identified forSouth Africa6912What affects our environment?Table 2.1: Percentage change in gross domesticproduct per year31Table 2.2: Changes in household access to basicservices by poverty group, 1995 and 200032Table 2.3: Share of national budget expenditure (%)33Table 2.4: Adjusted net savings for South Africa,1994–200141Table 2.5: Institutions in the science and technologysystem, as at March 200244Environmental governanceTable 3.1: National legislation with implications for theenvironmental management function57Table 3.2: South Africa’s engagement in MultilateralEnvironmental Agreements62Table 3.3: Number of non-profit sector employees, bysector65Table 3.4: Areas of work of non-profit sectororganizations in the environmental sector66Table 3.5: Department of Environmental Affairs andTourism personnel numbers and employee cost perprogramme72118Table 5.2: South African Ramsar sites121Inland waterTable 6.1: Available yield in the year 2000 (million m3/annum)148Table 6.2: Water requirements for the year 2000(million m3/annum)149Table 6.3: Reconciliation of the requirements for andavailability of water for year 2000 (million m3/annum)151Table 6.4: Reconciliation of requirements for andavailability of water for the year 2025 base scenario(million m3/annum)152Table 6.5: Reconciliation of requirements for andavailability of water for the year 2025 high scenario(million m3/annum)154Table 6.6: Physico-chemical restrictions on fitness foruse in the different Water Management Areas (WMAs)160Table 6.7: Trophic status of South African dams,October 2002–September 2003162Marine and coastal resourcesTable 7.1: Land use in coastal Metropolitan and DistrictMunicipalities174Table 7.2: Invasive marine species recorded in SouthAfrica, 2004176AtmosphereTable 8.1: Ambient air pollutant concentrationsrecorded at sites within residential household fuelburning areas204Table 8.2: Ambient air pollutant concentrations at sitesimpacted by multiple source types204Table 8.3: Ambient air pollutant concentrationsrecorded at road traffic-related monitoring sites205Table 8.4: Ambient air pollutant concentrationsrecorded at industry-related monitoring stations206LandTable 8.5: Contribution to total particulate, sulphur dioxide,and nitrogen oxide emissions estimated for fuel-burningrelated sources for 2002 within major conurbations inSouth Africa208Table 4.1: Area and percentage land-cover categoriesin 2000Table 8.6: Electricity use per capita and percentage ofhouseholds electrified in 1996 and 2001210Table 3.6: Provincial expenditure on environmentalmanagement, 2001/2002–2007/2008Table 3.7: Provincial vacancies, number ofEnvironmental Impact Assessments processed, wastemanagement plans completed and training cost perstaff member in 2004/2005Table 3.8: Transfers to local government forenvironmental managementviiiTable 5.1: Critically endangered vegetation types inSouth Africa74767688
LIST OF FIGURESTable 8.7: Aggregated emissions of carbon dioxide(CO2), methane (CH4), and nitrous oxide (N2O) in SouthAfrica in 1990 and 1994Sustainability in South AfricaFigure 1.1: A conceptual representation of sustainabledevelopment5Human settlementsFigure 1.2: Global Ecological Footprint, 1961–20018Table 9.1: Population in the nine largest cities in SouthAfricaFigure 1.3: Ecological Footprint and biocapacity8241Table 9.2: Social services and amenities per 10 000people, in 2003247Table 9.3: Slum housing, Census 1996 and Census2001250Table 9.4: Subsidized houses completed, or underconstruction, per province, per financial year251Table 9.5: Electricity generation capacity222What affects our environment?Figure 2.1: Population growth in South Africa, 1904–200419Figure 2.2: Life expectancy of South Africans, 1950–200521259Figure 2.3: Provincial infant and childhood mortalityrates per 1 000 births, 200122Table 9.6: Variables used to calculate the amount ofdomestic waste generated261Figure 2.4: Population structure by age and gender,200122Table 9.7: Division of hazardous waste generated perindustrial group and classification (in tonnes)Figure 2.5: Human Development Index, 1975–200323262Figure 2.6: Trends in cases of notifiable diseases inSouth Africa, 1999–200423Figure 2.7: Prevalence of HIV among antenatalattendees aged 15 to 49, 1990–200326Figure 2.8: HIV prevalence per province26Figure 2.9: Levels of education in people older than 20years, 1996–200127Figure 2.10: Levels of education among those 20years and older per population group27Human vulnerability toenvironmental changeTable 10.1: Poverty indicators by province278Table 10.2: HIV prevalence by locality in South Africa280Table 10.3: The prevalence of stunting per agecategory in Sekhukhune281Table 10.4: Percentage shocks experienced byhouseholds in the last year, by municipality,Sekhukhune282Table 10.5: Classification of impacts of the Alexandrafloods in 2002Figure 2.11: Percentage of the employed aged 15–65years by occupational category27285Figure 2.12: Interactions between the economy andthe environment28Figure 2.13: Gross domestic product (GDP) and GDPper capita at constant 2000 prices, 1994–200430Figure 2.14: Unemployment trends and grossdomestic product at market prices, 1994–200430Figure 2.15: Monthly inflation, Consumer Price Index(CPIX), 12-term change30Figure 2.16: Employment by sector, 2000–200434Figure 2.17: Sectoral shares of gross domesticproduct at constant 2000 prices34Figure 2.18: Total and final energy consumption pergross domestic product, 1999–200134Figure 2.19: Primary sector: annualized (%) change inthe gross domestic product (GDP) by industry atconstant 1995 prices35Alternative environmental futuresTable 11.1: Comparative overview of selected African,regional, and local scenariosTable 11.2: The environmental implications of the fourscenarios300311South Africa Environment Outlookix
Figure 2.20: Secondary sector: annualized (%) changein the gross domestic product (GDP) by industry atconstant 1995 pricesFigure 7.2: Number of people employed per commercialfishing sector, 2000171Figure 7.3: Total annual earnings for each commercialfishery, 2000171Figure 7.4: Proportion of historically disadvantagedownership in the three largest commercial fisheries ofSouth Africa, in 1992 and 2002172Environmental governanceFigure 7.5: Total daily wastewater discharged into themarine environment per coastal province, 2003177Figure 3.1: Department of Environmental Affairs andTourism programme expenditure estimates, 2000–200670Figure 7.6: Total daily breakdown of industrial anddomestic wastewater discharged into the marineenvironment per coastal province17772Figure 7.7: Location of coastal wastewater dischargepoints in the South African marine environment percoastal province177Figure 7.8: Incidents and volume of marine oil spills inSouth Africa’s Exclusive Economic Zone, 1987–2001178Figure 7.9: Mean annual sea-surface temperaturecollected from Voluntary Observing Ships (VOS)between Struisbaai and Knysna up to 60 nautical milesoffshore, 1903–2004178Figure 7.10: Landings of commercial fisheries and theproportion they contributed to fishery (Rand) value,2000179Figure 7.11: Pelagic fisheries catches in South Africa,1950–2004179Figure 7.12: Commercial catch landed for hake fishery(Merluccius paradoxus and M. capensis) from offshoreand inshore trawl, hand-line, and long-line catches,1960–200318018135Figure 2.21: Tertiary sector: annualized (%) change inthe gross domestic product (GDP) by industry atconstant 1995 prices39Figure 2.22: Adjusted net savings as % of grossnational income (GNI) for South Africa, 1986–200140Figure 3.2: Department of Environmental Affairs andTourism expenditure on training per person perprogrammeFigure 3.3: Summary of official developmentassistance expenditure on South Africa per sourcecountry73LandFigure 4.1: Fertilizer sales in South Africa, 1960–200491Figure 4.2: Food production index in South Africa andSADC countries relative to 1999–2001 base years94Figure 4.3: Progress made on the settlement ofrestitution claims, 1995–February 200595Figure 4.4: Levels of soil, vegetation, and overalldegradation in South Africa97Biodiversity and ecosystem healthFigure 5.1: Ecosystem services and human well-being109Figure 5.2: Species richness per taxonomic group ofthe biomes of South Africa111Figure 5.3: Threatened species per taxonomic group123Figure 7.13: Annual commercial landings of westcoast rock lobster (Jasus lalandii) in South Africa,1890–2001Figure 5.4: Number of threatened species pertaxonomic group per biome123Figure 7.14: Records of numbers of whole abaloneconfiscated, 1994–2004181Figure 7.15: Proportions of the South African coastlinewithin marine bioregions included within variouscategories of Marine Protected areas (MPAs)185Figure 7.16: Length of coastline (km) policed by eachlaw enforcement staff member in each coastalprovince185Figure 7.17: Law enforcement capacity vs. populationdensity in South Africa’s coastal provinces186Figure 7.18: Number of beaches awarded Blue Flagstatus in South Africa, 2001–2005187Inland waterFigure 6.1: The hydrological cycleFigure 6.2: River health in the Buffalo River in theEastern Cape145164Marine and coastal resourcesFigure 7.1: Annual gross domestic product (GDP)proportional contribution by coastal provinces of SouthAfrica, 1995–2003 (at constant 2000 prices)x170
AtmosphereFigure 8.1: Types of fuel used for electricitygeneration, 2000Figure 9.5: Modes of transport used in South Africa,2001245Figure 9.6: Percentage employment by economicsector249Figure 9.7: Unemployment in the nine largest cities,1996 and 2001249Figure 9.8: Distribution of dwellings by type249Figure 9.9: Levels of access to water supplyinfrastructure253Figure 9.10: Access to sanitation and incidence ofwater-borne diseases, 1993–2003253Figure 9.11: Municipal service provision of wastecollection facilities254221Figure 9.12: The realities of the Polokwane Declaration256222Figure 9.13: The structure of the South African energysector259Figure 9.14: Energy source by household for lighting,heating and cooking, 2001259Figure 9.15: Waste generation profile for South Africa,1998261Figure 9.16: Proportion of general waste generatedand waste generation rate per province261264209Figure 8.2: Trends in electricity consumption persector, 1992–2000209Figure 8.3: Proportion of household fuel use forlighting, cooking, and heating requirements, 1996 and2001210Figure 8.4: Liquid fuel sales, 1994–2004211Figure 8.5: Atmospheric concentrations of carbondioxide, methane, and nitrous oxide measured at CapePointFigure 8.6: Ambient temperature deviations from longterm (1960–2002) averages recorded, 1989–2002Figure 8.7: Contribution of main sectors to totalnational CO2-equivalent emissions, 1990 and 1994Figure 8.8: Contribution of energy source groups toaggregated energy sector CO2-equivalent emissions,1994Figure 8.9: Ozone-depleting substance (ODS)consumption, 1998–2002217222227Figure 8.10: The amount of ultraviolet-B (UV-B)measured as the erythema dose in Pretoria (top) andCape Town (bottom), 1994–2002228Figure 9.17: Capacity for environmental planning inmunicipalitiesFigure 8.11: The amount of ultraviolet-B (UV-B)measured as the erythema dose in Durban (top) andDe Aar (bottom), 1994–2002228Human vulnerability toenvironmental changeFigure 8.12: An index of changes in the totalatmospheric ozone, as measured at Pretoria andSpringbokFigure 8.13: Atmospheric concentrations of CFC-11,CCl4, CH3CCl3 and CFC-12 as measured at Cape Point,1980s–2003Figure 8.14: South Africa’s CFC production andconsumption patterns reported under the MontrealProtocol229Figure 10.1: A conceptual model for vulnerability274Figure 10.2: Schematic outline of vulnerability274Alternative environmental futures230230Figure 11.1: Scenario generation process302Figure 11.2: Indirect drivers of environmental change302Figure 11.3: Four scenarios of the future environment309Human settlementsFigure 9.1: Settlements as systems237Figure 9.2: Schematic diagram of the urban funnel‘ecological footprint’ conceptual model238Figure 9.3: The proportion of urban and rural dwellersby province, 2001242Figure 9.4: Difference (in percentage) in the populationproportions living in urban areas, 1996–2001243South Africa Environment Outlookxi
LIST OF MAPSMarine and coastal resourcesSustainability in South AfricaMap 1: Protected areas in South AfricaivEnvironmental governanceMap 3.1: Protected areas in South Africa64Map 3.2: Social Responsibility Projects71LandMap 4.1: Land-cover in South Africa in 200089Map 4.2: The distribution of arable potential in South Africa91Map 4.3: Long-term grazing capacity (hectares/largestock unit)93Map 4.4: The distribution of land degradation in SouthAfrica as represented by the Combined Degradation Index97Biodiversity and ecosystem health172Map 7.2: Five bioregions of the South African ExclusiveEconomic Zone184AtmosphereMap in Box 8.1: Transport pathways carrying air to theMpumulanga highveld region214Map in Box 8.2: Five transport pathways carrying air awayfrom the highveld in the five-year period, 1990–1994214Map in Box 8.3: African Stockpiles212Human settlementsMap 9.1: Types of settlements and their distribution inSouth Africa239Map 5.1: Biomes and biodiversity hotspots of South Africa108Map 9.2: Spatial distribution of population densityacross South AfricaMap 5.2: Percentage cover by alien invasive plants perquaternary catchment242112Map 9.3: Estimated impact of HIV and AIDS onpopulation numbers, 2001–2011Map 5.3: Potential distribution of alien invasive plant species113244Map 5.4: Predicted reduction in existing biomes ofSouth Africa due to climate changeMap 9.4: Net migration, 2001–2004244116Map 9.5: Health care accessibility index246Map 5.5: Ecosystem status of terrestrial ecosystems116Map 5.6: Protection levels of terrestrial ecosystems117Map 9.6: Household access to basic services: (a) pipedwater in the dwelling, (b) adequate sanitation (flushtoilets), (c) electricity for lighting, and (d) waste removal252Map 5.7: Ecosystem status of South African rivers119Map 5.8: Estuary health in South Africa122Map 5.9: Ecosystem status of marine biozones122Map 5.10: Protection levels of marine biozones123Map 10.1: Distribution of poverty across South Africashowing the ten poorest municipalities278Map 5.11: Existing conservation assessments inSouth Africa131Map 10.2: Percentage of households with access towater in the dwelling or stand282Map 10.3: Poverty rate in Umkhanyakude DistrictCouncil, KwaZulu-Natal283283Inland waterxiiMap 7.1: Population density (people/km2) in SouthAfrican coastal municipalities, in 1996 and 2001Human vulnerability toenvironmental changeMap 6.1: Water management areas and inter-basintransfers145Map 6.2: Utilizable groundwater exploitation potential146Map 10.4: Percentage of households with access topiped water in yard, Umkhanyakude District Council,KwaZulu-NatalMap 6.3: Sectoral groundwater use (million m3/annum)per water management area150Map 10.5: Proportions of people by gender,Umkhanyakude District Council, KwaZulu-Natal284Map 6.4: Surface water quality trends for nitrate at150 Water Management System sampling sites161Map 6.5: Surface water quality trends for salinity at150 Water Management System sampling sitesMap 10.6: Aerial photograph showing the proximity ofinformal settlements to the Jukskei River in Alexandra,Johannesburg286161Map 6.6: Protected areas in South Africa164Map 10.7: Proximity of population to industrial zones,eThekwini, KwaZulu-Natal287
LIST OF BOXESSustainability in South AfricaBox 1.1: Key environment and development milestones11Box 4.3: The consequences and costs of degradationand desertification in South Africa99What affects our environment?Box 4.4: Opportuni
Ester Koch (Department of Environmental Affairs and Tourism) Photographic material – sourcing and selection: Ester Koch, Dr Rudi Pretorius, and Kirshen Pillay (Department of Environmental Affairs and Tourism), and Kim Heubner, Janet Peace, Sheralyn Stelling, and Cheri Ward (Hot Tom