Transcription
12/18/2020AGU - iPosterSessions.comPredict arrival time of acoustic emissions on alaboratory fault without the velocity modelQi Zhao (qi.qz.zhao@polyu.edu.hk), Steven D. Glaser, & Qinya LiuThe Hong Kong Polytechnic University; University of California, Berkeley; University of TorontoPRESENTED com/Default.aspx?s fprint true&guestvie.1/10
12/18/2020AGU - iPosterSessions.comINTRODUCTIONEstimation of the arrival time of the seismic wave requires the knowledge of the velocity model from the hypocenter to thesensors. The velocity model can be obtained by tomographic imaging in the laboratory, even though in most cases isotropicmodels are assumed. Our earlier work showed that machine learning using an artificial neural network (ANN) can relocateacoustic emission (AE) on a laboratory fault without knowing the velocity model [l]. In this study, we demonstrate that the sameANN structure can be used in a reverse way, i.e., predicting arrival time for AE events with known ssions.com/Default.aspx?s fprint true&guestvie.2/10
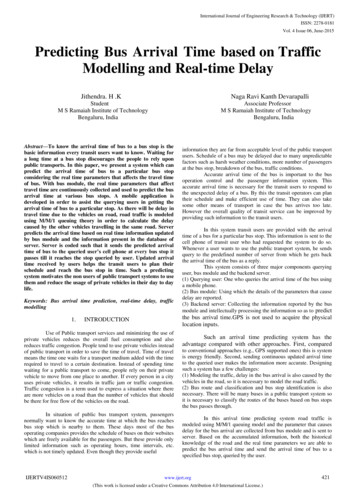
12/18/2020AGU - iPosterSessions.comEXPERIMENTAL SETUP3737f \/S3920f \/Sz423 f(\/SThe experimental setup: a) The loading apparatus and AE recording system, b) the specimen assembly that consists of twohalves of the rock (218 mm x 218 mm x 200 mm), separated by the laboratory fault. The loading platens are actuated by flatjacks, and AE sensors (PTZs) are embedded in platens on the North (N) and West (W) sides of the block. The training data wasobtained on the NW block before the experiment. (c) The anisotropic velocity structure indicated by several P-wave velocitymeasurements, which makes conventional relocation and forward modelling difficult.Training data: We create 56 AEs by breaking 0.7 mm diameter pencil leads [2] at known locations on the laboratory faultsurface (NW block) before the rock assembly is put together for testing. These events are spread over the entire fault surface toensure good spatial coverage. We pick the P-wave arrival time with Akaike information criterion (AIC) [3].In Zhao and Glaser (2020) [l], the ML models using the relative P-wave arrival time (t.e1) as the input and AE source locations(x, z) as the output. The relative P-wave arrival time was calculated relative to AE sensor PTZ#l. The figure below shows thetraining data and test results overlying the laboratory fault. This result demonstrates the capacity of our method in accuratelyrelocating AEs on the laboratory fault with 4 mm accuracy [l].Training points Test1 g pointscTesting outputO Repeatability tes ·n@ points O Repeatability testing output200------------------------EE 150 -100.c0)Q)I509., ,,. .50100150200Fault axis, x (mm)250300Artificial neural network (ANN) structure: In this work, we use the known AE location (x, z) as the input and t.e1 as theoutput. The ANN structure is reversed correspondingly. All the data points shown in the figure above are used for this study.The ANN structure consisting of the following layers: (1) layer 0, the input layer that takes (x, z) as input; (2) layer 1, the hiddenlayer that consists of 12 neurons; and (3) layer 2, the output layer that has 10 neurons and outputs the t.e1 for AEs on sensorsPTZ#2-10. In order to avoid overfitting problems, we train an ensemble of 50 ANNs with the same architecture for 100 epochsand average their outputs. Also, we use the ten-fold cross-validation to examine the sions.com/Default.aspx?s fprint true&guestvie.3/10
12/18/2020AGU - iPosterSessions.comMACHINE LEARNING METHODAE sensorsRelative arrival timeNwO ( N,. -01) IIC: V1·,.:::ttlIO 0 {9Q ANN II .,0-,::!. !:!.AE location: xso100y150200Fautt axis, x ssions.com/Default.aspx?s fprint true&guestvie.5/10
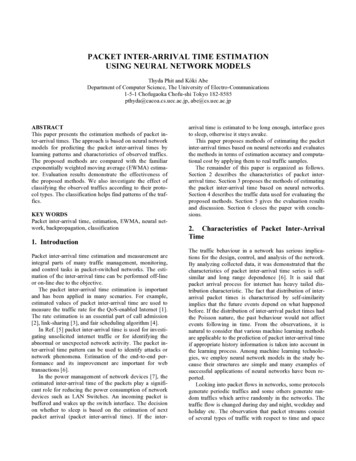
12/18/2020AGU - iPosterSessions.comRESULTS200100Fault axis, x (mm)2003000E150:::.§. 100N50·:rni:?i:· ····· 100200Fault axis, x (mm)300H!·::::300100200Fault axis, x (mm)E300100200Fault axis, x (mm)300100200Fault axis, x (mm)300100200Fault axis, x (mm)300150.§. 100N300200150E. , 100N50100200Fault axis, x (mm)100200Fault axis, x (mm)200 " ---.-.-:,: n.::E :::::a:::100f :HiU!iH15050100200Fault axis, x (mm)sv::150Relative arrival time (µs)-50-2502550.E, 100N50100200Fault axis, x (mm)3003000 Prediction Training data100200Fault axis, x (mm)300(Click the figure to enlarge) Predicted relative arrival time for AE events on the entire laboratory fault for each sensor (all zerofor PTZ#l as it is the reference sensor for relative arrival time). With the proposed method, we can predict the relative arrivaltime of any AE events at any locations on the laboratory fault surface.'ii,30105:5C.:5 0'ii, 202::5 10'ii,2:., 10:50:50 0C.-505 10Target (µs)-101530'ii, 202:.,:::,C. 0"50-20-20-505 10Target (µs)15-10-1001020Target (µs)"7-1040 PTZ8'ii, 202::5C.:5 00-5-20020Target (µs)40-40-40-20 020Target (µs)0 10 20Target (µs)3040-;;;- 202::5 0O -2040-40-40 -20 0 20Target (µs)405050PTZ 112 30 R 0.9993 30en2: 10:5.9--10::- 10Target vs. Output%-10/ Target:Output 1:1::l.O -30-500 10 20Target (µs)40 10en2: 5:5C.0 202:10:5:50-10C.0-10-53020-30-50 -30 -10 10 30 50Target (µs)-50-50 -30 -10 10 30 50Target (µs)Training results for relative arrival time prediction for sensors PTZ#2-10. The predictions from the ANN show a high degree ofagreements with the ground ns.com/Default.aspx?s fprint true&guestvie.6/10
12/18/2020AGU - iPosterSessions.comIMPLICATIONS AND FUTURE WORKThe proposed approach estimates arrival time without forward modelling, and it may be used to predict the arrival time of eventsat any locations on the fault surface, providing virtual ray-path coverage that may facilitate improved tomographic inversion.Moreover, this method is not restricted to manually created training data. Strong earthquake seismograms could be used as thetraining data, and our approach could be applied to natural/induced earthquakes, for situations where arrival time data aremissing due to, for example, malfunctioned stations and/or weak seismic ions.com/Default.aspx?s fprint true&guestvie.7/10
12/18/2020AGU - iPosterSessions.comAUTHOR INFORMATION0Qi Zhao 1 2 , Steven D. Glaser2, & Qinya Liu3* qi.qz.zhao@polyu.edu.hk1 TheHong Kong Polytechnic University2University of California, Berkeley3University of TorontoABSTRACTEstimation of arrival time of seismic wave requires the knowledge of the velocity model between the hypocenter to thesensors. The velocity model can be obtained by tomographic imaging in the laboratory, even though in most cases isotropicmodels are assumed. Our earlier work showed that machine learning using artificial neural network (ANN) can relocateacoustic emission (AE) on a laboratory fault without knowing the velocity model (Zhao and Glaser, 2020, Rock Mech RockEng, 53, 2053-2061). In this study, we demonstrate that the same ANN structure can be used in a reverse way, i.e., predictingarrival time for AE events with known locations. This approach estimates arrival time without forward modelling, and it maybe used to predict arrival time of events at any locations on the fault surface, providing virtual raypath coverage that mayfacilitate improved tomographic inversion. Moreover, this method could be applied to natural earthquakes, for situationswhere arrival time data are missing due to, for example, malfunctioned stations and/or weak seismic signals.REFERENCES[1] Zhao, Q. and Glaser, S. D.(2020). Relocating acoustic emission in rocks with unknown velocity structure with machinelearning, Rock mechanics and rock engineering, 53, 2053-2061.[2] Hsu, N. N., Simmons, J. A., and Hardy, S. C. (1978). Proceedings of the ARPA/AFML Review of Progress inQuantitative NDE, September 1976-June 1977. 31.[3] Akaike, H. (1973). Information theory and an extension of the maximum likelihood principle, in 2nd InternationalSymposium on Information Theory, B. Petrov and F. Csaki (Editors), Budapest Akademiai Kiado, ions.com/Default.aspx?s fprint true&guestvie.8/10
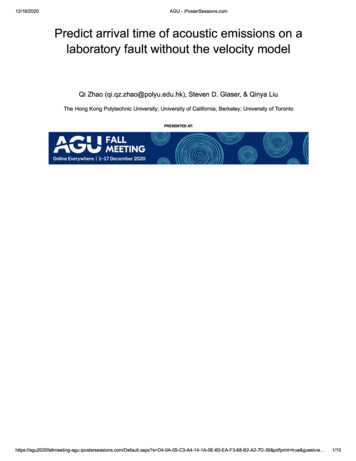
E Relative arrival time (µs) -50 -25 0 25 50 .E, 100 N 50 0 Prediction Training data 100 200 300 Fault axis, x (mm) (Click the figure to enlarge) Predicted relative arrival time for AE events on the entire laboratory fault for each sensor (all zero for PTZ#l as it is the reference sensor for relative arrival time).