Transcription
SPSS for WindowsVersion 16.0:A Basic TutorialLinda Fiddler, California State University, BakersfieldLaura Hecht, California State University, BakersfieldEdward E. Nelson, California State University, FresnoElizabeth Ness Nelson, California State University, FresnoJames Ross, California State University, Bakersfield
PrefaceThis book is intended for those who want to learn the basics of SPSS (Version 16). Thisbook can be used as a text in a class or by those working independently. It was written asa tutorial. Each chapter has instructions that guide you through a series of problems, aswell as graphics showing you what your screen should look like at various steps in theprocess. The data set that accompanies the text, GSS06A, can be downloaded from theweb by going to http://www.ssric.org and clicking on ONLINE TEXTBOOKS underTeaching Resources. Click on download GSS06A to download the file. The data havebeen weighted by the variable (wtss) that is provided by the National Opinion ResearchCenter at the University of Chicago. There are also exercises at the end of each chapterfor further practice and more exercises and teaching modules at this same web site.In order to use the software that you will need for this book, you will either have topurchase SPSS or find a computer laboratory in which SPSS has been installed. Mostcolleges and universities have labs where you can use SPSS. If you purchase SPSS, wesuggest you buy the Graduate Pack.The authors would like to thank the faculty and students who have tested each version ofthese materials (6.0, 7.5, 9.0, 11.0, 13.0 and now 16.0). We also want to thank the SocialScience Research and Instructional Council of the California State University for theirsupport and encouragement. Finally, we would like to thank our editor, James A. Doepkeof McGraw-Hill Custom Publishing, for his help and support. If you would like to makesuggestions, correct errors, or give us feedback, please email any of us at the followingaddresses:Linda Fiddler (fiddlerlinda@yahoo.com)Laura Hecht (lhecht@csub.edu)Edward Nelson (ednelson@csufresno.edu)Elizabeth Ness Nelson (elizn@csufresno.edu)James Ross (jross@csub.edu)ii
Table of ContentsGSS06A.sav, the data set for this text can be downloaded from the web by goingtohttp://www.ssric.org,CHAPTER ONE: GETTING STARTED WITH SPSS FOR WINDOWS . 1USING WINDOWS . 1STARTING SPSS FOR WINDOWS . 2LEAVING SPSS . 3LOOKING AT DATA . 3A BRIEF TOUR OF SPSS . 5OVERVIEW OF CHAPTERS . 9CHAPTER TWO: CREATING A DATA FILE . 11BASIC STEPS IN CREATING A DATA FILE . 11GETTING STARTED IN SPSS . 13STUDENT SURVEY QUESTIONNAIRE . 16CHAPTER TWO EXERCISES . 19SAMPLE DATA SET: FRIENDLY VISITOR SERVICE CLIENTS . 20CHAPTER THREE: TRANSFORMING DATA . 21RECODING VARIABLES . 21RECODING INTO DIFFERENT VARIABLES . 22RECODING INTO THE SAME VARIABLE . 26CREATING NEW VARIABLES USING COMPUTE . 27CREATING NEW VARIABLES USING IF . 33USING SELECT CASES. 34CONCLUSION . 36CHAPTER THREE EXERCISES . 37CHAPTER FOUR: UNIVARIATE STATISTICS . 39FREQUENCIES . 39VARIABLE NAMES, VARIABLE LABELS, VALUES, VALUE LABELS, OH MY! . 43DESCRIPTIVES . 45EXPLORE . 46CONCLUSION . 51UNIVARIATE ANALYSIS AS YOUR FIRST STEP IN ANALYSIS . 51CHAPTER FOUR EXERCISES . 53CHAPTER FIVE: CROSS TABULATIONS . 55CHAPTER FIVE EXERCISES . 59CHAPTER SIX: COMPARING MEANS . 61INDEPENDENT-SAMPLES T TEST . 61PAIRED-SAMPLES T TEST . 63ONE-WAY ANALYSIS OF VARIANCE . 64CONCLUSION . 66CHAPTER SIX EXERCISES . 67iii
CHAPTER SEVEN: CORRELATION AND REGRESSION . 69CORRELATION . 69REGRESSION . 71CHAPTER SEVEN EXERCISES. 77CHAPTER EIGHT: MULTIVARIATE ANALYSIS . 79CROSSTABS REVISITED . 79MULTIPLE REGRESSION . 82CHAPTER EIGHT EXERCISES . 86CHAPTER NINE: PRESENTING YOUR DATA. 87CHARTS . 87TABLES . 89COPYING AND PASTING CHARTS AND TABLES TO A DOCUMENT . 90CHAPTER NINE EXERCISES . 92APPENDIX A: CODEBOOK FOR THE SUBSET OF THE 2006 GENERAL SOCIAL SURVEY . 93iv
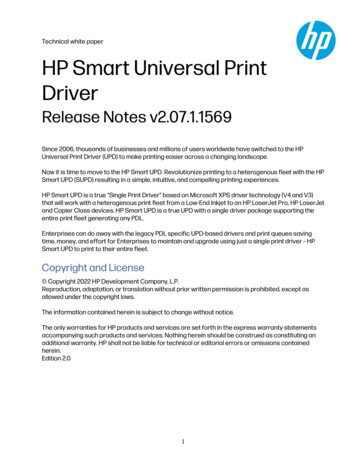
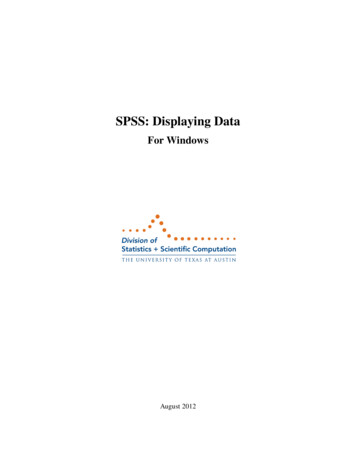
Chapter One: Getting Started With SPSS for WindowsUsing WindowsThe Windows start-upscreen should look somethinglike Figure 1-1. Severalstandard desktop icons, suchas My Computer andRecycle will always appearon start up. Note the Taskbaralong the bottom, with theStart button at the far left. Ifyou own your own computer,you can do quite a bit ofcustomizing of your desktopby choosing your favoritecolors and scenes,rearranging and adding icons,moving the Taskbar to adifferent location, hiding it from view, and so on.Figure 1-1Although Windows makes use of the right-button key on the mouse, you will only use theleft button for now. When we say to click on the mouse button, it will always mean theleft one. A single click will often take you where you want to go, but if one click doesn’tdo anything, try a double click. (Double clicking means to press the left mouse buttontwice in rapid succession. If nothing seems to happen, you probably need to double clickmore rapidly.) Now move your mouse so the pointer touches the Start button (don't clickanything yet, just let the pointer rest somewhere on the button). Notice that a labelappears in a little rectangle, justabove the Start button, showingClick here to begin.These floating labels willusually appear in your activewindow whenever the mousecursor moves over a Buttonicon. They will then disappearafter a few seconds, so payattention! Now that you havefound the Start button, click onit once and the Start menu willappear. Your screen shouldlook something like Figure 1-2.Figure 1-21
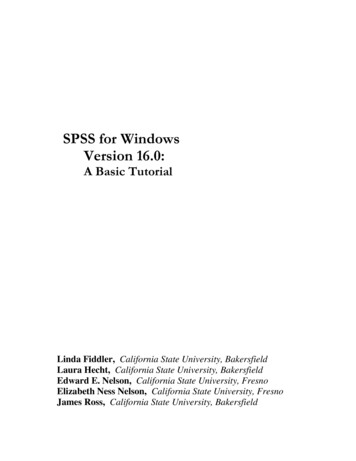
This is the basic Start menu. It can also be customized by adding your most-often usedprograms to it. Without clicking anything yet, move the mouse pointer up and down theStart menu. As you encounter each item, it will become highlighted. Nothing other thanthat will happen with the Help, Run, or Turn Off icons, but letting the pointer hover overPrograms, Documents, Settings, or Search will cause other menus to slide out acrossyour screen. The little triangles at the right side of the Start menu are your clue here. Ifone is present, that means there are more menus for that item. If this is the first time youare using Windows, the Documents menu will say “empty.” If you have used programsthat saved files, the last ones you saved will show up on this menu. This is a quick wayto get back to whatever you were working on recently, since one click will open that fileand the applications program it belongs to (such as Word, SPSS, Excel, etc.).Move the mouse pointer around on those icons with a little triangle at the right (don'tclick anything yet) and watch what happens. When the pointer lands on a program icon,it becomes highlighted and its sub-menu appears.Starting SPSS for WindowsThe SPSS 16 for Windows icon should be on the Start menu. If you are using acomputer in a lab, it is common for the icon to be placed in a folder. If you customizeyour computer, all you have to do to start SPSS is to point to the SPSS 16 icon on thedesktop and double click. Then wait while SPSS loads.After SPSS loads, you may,depending on how SPSS isset up, get a menu that asks,“What would you like todo?” For this tutorial, clickCancel to get rid of this.Now the screen should looklike Figure 1-3.The Taskbar is probablyvisible at the bottom of thescreen. It shows an SPSSbutton. Whatever programsyou have open will show onthe Taskbar, and the one youare currently using will behighlighted.Figure 1-3Next, observe the three small squares in the uppermost right-hand corner of the mainSPSS window. The one furthest to the right, with an X in it, is used when you want toclose any program you are using. Don’t worry if you click on it accidentally, a Dialogbox will pop up asking if you want to save anything that changed since the last time yousaved your work, before it actually lets you exit the program.2
The middle of the three small squares allows you to have the window you are working infill up the whole screen, or to shrink it down to a smaller size. If the middle squareshows two cascading rectangles in it, the window is already as big as it can get—clickingon this square will reduce the window in size. Try this now. In this shrunken window,the middle button now shows only one rectangle. Click on it to get back to the full screenview.The last square, to the left of the other two, has what looks like a minus sign on it. Clickthis and watch what happens. Look at your Taskbar. The button for SPSS is still therebut it is no longer highlighted. Click on it and see what happens. You have just learnedhow to minimize a window.Leaving SPSSWe’re not ready to actually use SPSS yet, so let’s close it. There are at least four ways todo this. Move your mouse until the arrow is pointing at the word File in the upper-lefthand corner of the screen and press the left mouse button once. A menu will appear.Move the arrow so it is pointing at the word Exit and press the left mouse button. Thisshould close SPSS.There is a second technique that can do the same thing. (Computers usually have morethan one way to do everything.) Go back into SPSS and move your mouse until thearrow is pointing at the word File in the upper-left corner of the screen and press the leftmouse button once, but this time, don’t release the mouse button. Hold the mouse buttondown and move the mouse down until the word Exit is highlighted. Now release themouse button and SPSS should close. This is called click and drag and is another way touse your mouse.The third way to close SPSS is to point your mouse at the SPSS icon in the upper-leftcorner of the screen. The icon will be just to the left of the words Untitled: SPSS DataEditor. Move your mouse to the icon and double click on it. This has the same effect asthe first two procedures; it closes SPSS.The final and fourth way to close SPSS is to point your mouse at the X in the upper-rightcorner of the screen and click. SPSS will close.Now you know how to move your mouse around and how to start and close SPSS. We’llshow you more about Windows, but not much more. If you want to learn more aboutWindows, there are a lot of books available. The nice thing about Windows is that youdon’t have to know much to use it.Looking at DataThere is a data file to be used with this tutorial called GSS06A. This is a subset of the2006 General Social Survey. The General Social Survey is a large, national probabilitysample done every two years. You can download this data file from the web by going to3
the following address on the web, http://www.ssric.org and clicking on ONLINETEXTBOOKS under Teaching Resources. Click on download GSS06A to download thefile. Also, if you are in a computer lab, someone may have copied the data files ontoyour hard drive.Let’s begin by starting SPSS just as you did above. Your screen should look like Figure1-3. (If you see a box asking, “What do you want to do?,” click on Cancel to closethis box.) At the very top of the screen, you'll see the words SPSS Data Editor. Justbelow that line will be the menu bar with the following options: File, Edit, View, Data,Transform, Analyze, Graphs, Utilities, Add-ons, Window, and Help. Point yourmouse at File and press the left mouse button.A box will open that is the File menu. Point your mouse at Open and then at Data andclick. (Also, you could have gotten to this point by clicking on the Open File icon justbelow File on the menu bar.)This opens a larger box called the Data File box. (You're beginning to get the idea ofhow Windows works.) Here you need to tell SPSS where to find the data file to open. Inthe upper part of the box, you'll see Look in. Find the folder that contains the data fileand click on the file name, GSS06A, to highlight it and then click on Open. In a fewseconds, your data matrix will appear.A data matrix is a very important concept. The rows contain the cases and the columnscontain the variables. (If you're familiar with spreadsheets, that's what this is.) Row 1 iscase 1, row 2 is case 2, and so on. The top of each column contains the variable name.In this data set the variable names are abbreviations like abany and abdefect.Unfortunately the abbreviations for the variable names do not tell you very much. Weneed some way to find out what these variables are. So try this. On the menu bar at thetop of your screen, you'll see the word Utilities. Point your mouse at Utilities and clickthe left button. This will open the Utilities menu. Point your mouse at Variables andclick again. Your screen should look like Figure 1-4.You'll see a list of all thevariables in your data on theleft side of the little window.(Also, see Appendix A for alist of variables.) Point yourmouse at any of these variablesand click. To the right of theVariable List you'll see a shortdescription of this variable.Figure 1-4For example, point your mouseat the variable abany and pressthe left mouse button. This question asked if respondents thought that obtaining a legalabortion should be possible for a woman if she wants it for any reason. The possibleanswers are YES (value 1), NO (value 2), DK or don't know (value 8), NA or no answer4
(value 9), and NAP or not applicable (value 0). (Not applicable includes people whowere not asked the question.) As you will see in Chapter 3, these values are veryimportant!Now you know how to open a preexisting data file in SPSSand how to find out what the variables are in the file. Wewill tell you more about this later, but here we just want togive you a brief introduction to SPSS for Windows.A Brief Tour of SPSSNow that you have the file opened, let's look at some thingsyou can do with SPSS. You're already familiar with thevariable abany. Let's find out what percent of peoplesurveyed thought it ought to be legal for a woman to have anabortion for any reason. (If you have the Variables windowopen showing the variable labels and values, point yourmouse at the close button and click it.) On the menu bar youwill see Analyze. Point your mouse at Analyze and click it.A box opens that looks like Figure 1-5.This lists the statistical procedures in SPSS. We want to useDescriptive Statistics so point your mouse at DescriptiveFigure 1-5Statistics. This opens another box listing the statisticalprocedures you can use to summarize your data. Point yourmouse at Frequencies and click it. This opens the Frequencies box. Since abany isthe first variable in the data, it's already highlighted. 1 Point your mouse at the right arrownext to the list of variables and click it. The label abany will move to the box calledVariable(s). This is how you select variables. Point your mouse at OK and click it. In afew seconds, a new screen should appear that looks like Figure 1-6. We are now in adifferent part of SPSS for Windows, called the Output Window. This is where theresults, or output, are displayed.The Output Window is divided into two vertical frames or panes. The left-hand panecontains the outline of the output or information that SPSS gives you. This information isin outline form and can be used to select what you want to view. Simply click on theinformation you want to look at and that information will appear in the right-hand pane.You can also collapse and expand the outline by clicking on the plus and minus signs inthe left-hand pane. The plus sign indicates that the information is collapsed (or hidden)and the minus sign indicates that it is expanded (or shown). You can use the scroll barson each pane to scroll through the Output Window.1Instead of seeing a list of variables, you may see a list of variable labels. You can change this so SPSSdisplays the list of variables. To do this, click on Edit in the menu bar, then click on Options and on theGeneral tab. Look for Variable Lists in the General tab and click on Display names. You can put thevariable names in alphabetical order by clicking on Alphabetical just below and to the left of Displaynames. Finally, click on OK.5
On the right side, the frequency distribution for abany is divided into four parts: (1) thetitle, (2) notes on the table(there aren’t any for thistable), (3) the active dataset, (4) statistics (asummary of the numberof missing and validobservations), and (5) theactual table showing thefrequency distribution.Click on Statistics in theleft-hand pane and youwill see that there were1,931 valid and 2,581missing cases. Click onabortion—if womanwants for any reasonand you will see thefrequency distribution. InFigure 1-6Figure 1-6, you can seethat 757 people said yes, 1,174 said no, 51 said they didn't know, 17 didn’t answer thequestion, and 2,513 were coded not applicable. (These 2,513 respondents were not askedthis question. In survey research it's very common to ask some, but not all, of therespondents a particular question. In thiscase, only 1,931 of the approximately 4,500respondents were asked this question.) Ofthose who had an opinion, we want to knowwhat percent of the respondents said yes orno, so we should look at the Valid Percentsin the table. About 39% of the respondentswho had an opinion thought it should belegal, while 61% thought it should be not belegal.It would be interesting to know if men orFigure 1-7women were more likely to favor allowing alegal abortion when the woman wants it forany reason. We’re going to use a crosstab to determine this. Point your mouse atAnalyze and press the left mouse button. Then point your mouse at DescriptiveStatistics and finally, point your mouse at Crosstabs and press the mouse button. Yourscreen should look like Figure 1-7.6
The list of variables in your data set is on the left of the screen. We want to move thevariable abany into the box next to the list ofvariables where it says Rows. Click on thevariable abany, which will highlight it.Now click on the arrow pointing to the right,which is next to the Rows box. Notice thatthis moves abany into the Rows box. Wealso need to move the variable sex into theColumns box. You will have to use thescroll bar in the box containing the list ofvariables to find this variable. (You can alsoclick anywhere in this box and then type theletter S to move to the first variable startingwith the letter S.) Point your mouse at thedown arrow next to the list of variables and click. Ifyou keep pressing the mouse button, the list ofvariables will move down and eventually you will seethe variable sex. Highlight it and click on the arrowpointing to the right, which is next to the Columns box.This moves sex into the Columns box. Now yourscreen should look like Figure 1-8.Frequencies by themselves are seldom useful. You’llneed to compute percents. Toget SPSS to computepercentages, point your mouseat the button labeled Cells atthe right of the screen andclick on it. This will open theCrosstabs: Cell Display box.Find the box called Columnpercentages and click on thisbox. This will place a checkmark in this box and yourscreen should look like Figure1-9.Figure 1-8Figure 1-9Figure 1-10Now click on Continue andyou will be back to the Crosstabs box. To tell SPSS to run the Crosstabs procedure, clickon OK. After a few seconds your screen should look like Figure 1-10. Use the scroll barto look at all the information that SPSS gives you in the Output Window.7
Figure 1-10 shows the results, or “output.” It shows, for example, that males and femalesdiffer very little in their opinions about a woman obtaining a legal abortion for anyreason. Forty-one percent of the males and 38 percent of the females approve of awoman obtaining an abortion for any reason.You can also examine other items in thesurvey to compare men and women. Whohas more education? Is the average age atbirth of first child younger for women thanfor men? Comparing means will answerthese questions. Click on Analyze, pointyour mouse to Compare Means, and thenclick on Means. Your screen should looklike Figure 1-11.Figure 1-11Now put age at birth of first child (agekdbrn)and years of school completed (educ) in theDependent List box and sex in theIndependent List box. By now you have agood idea how to do this. HighlightFigure 1-12agekdbrn in the list of variables on the left ofthe screen by pointing your mouse at it and clicking. Then click on the arrow next to theDependent List box. Do the same for educ.Now highlight sex and click on the arrow nextto the Independent List box. This shouldmove agekdbrn and educ into the DependentList box and sex into the Independent List boxand your screen should look like Figure 1-12.Then click on OK and the output should looklike Figure 1-13.Women had their first child at an average ageof 22.82 years, while the average for men is25.58 years, a difference of less than threeyears. Now look at the mean years of schoolcompleted for men and women. There’s virtually nodifference (about 0.11 of a year) between men andwomen.Another way of examining relationships is to look atPearson Correlation Coefficients. One couldhypothesize that the respondents’ education iscorrelated with the educational achievements of theirparents. The Pearson Correlation Coefficient willtell us the strength of the linear relationship betweenfather’s education, mother’s education, and the8Figure 1-13Figure 1-14
respondent’s education. The closer the correlation is to 1, the stronger the relationship,and the closer it is to 0, the weaker the relationship.Point your mouse at Analyze and press the mouse button. Now point your mouse atCorrelate and then click on Bivariate. Your screen should look like Figure 1-14.Now move the following three variables intothe Variables box: educ, maeduc, and paeduc.These variables refer to the number of years ofschool completed by the respondent and therespondent’s parents. Highlight each of thesevariables and press the arrow next to theVariables box. The screen should look likeFigure 1-15. Click on OK and the correlationswill appear in your Output box.Figure 1-15The strongest correlation is between father’sand mother’s education. As we predicted, there is also a fairly strong correlation betweenrespondent’s education and parent’s education.Overview of ChaptersChapter 2 will acquaint you with how to enter new data into SPSS for Windows using theData Editor. Chapter 3 explains how to take your data, or preexisting data, and modify itin a way that makes it easier to understand. Chapter 4 starts the sections where you reallyget to see the results of your work. In Chapter 4 you will learn how to look at eachvariable, one at a time. We call this univariate analysis. Chapters 5 through 7 will teachyou how to look at two variables at a time, or what we call bivariate analysis. Chapter 5will show you how to create a cross tabulation. Chapter 6 shows you alternative ways ofcomparing more than one variable at a time, and Chapter 7 will teach you how to do thisusing linear regression techniques. Chapter 8 shows you how to explore relationshipsamong sets of variables using multivariate cross tabulation and multiple regression.Finally, Chapter 9 will show you how to present your data effectively and will includecharts and graphs.9
Chapter Two: Creating a Data FileThis chapter explains how to set up a file with new data. After finishing this chapter, youshould be able to create a SPSS data file that will include the data and some labeling thatgives more detail about the data. To illustrate this process, we will use a shortenedversion of the questionnaire used by the General Social Survey conducted by the NationalOpinion Research Center. For this example, our students wanted to see if their opinionson social issues were similar to those of the national sample.The students knew they were not a representative sample, even of college students, butthis questionnaire is an interesting way to learn how to create a new data file. Theydecided to use the following questions 2 : What is your age? Are you male or female? What is your religious preference? Generally speaking, in politics do you consider yourself as conservative,liberal, or middle of the road? What kind of marriage do you think is the more satisfying way of life: onewhere the husband provides for the family and the wife takes care of the houseand children or one where both the husband and wife have jobs and both takecare of the house and children? Do you think it should be possible for a pregnant woman to obtain a legalabortion:o If there is a strong chance of a serious defect in the baby?o If she is married and does not want any more children?o If the woman’s own health is ser
The SPSS 16 for Windows icon should be on the Start menu. If you are using a computer in a lab, it is common for the icon to be placed in a folder. If you customize your computer, all you have to do to start SPSS