Transcription
Sustainable Dairy Fact Sheet SeriesDairy Cow Nitrogen EfficiencyDefinition of termsHoracio A. Aguirre-VillegasBiological Systems Engineering,University of Wisconsin-MadisonMichel A. WattiauxDairy Science,University of Wisconsin-MadisonAmino-acidsAAOne of the 20 building blocks of protein. Amino-acids containcarbon, oxygen, hydrogen, and nitrogen and join together toform proteins. Amino-acids contain an amino group (NH₂) and acarboxyl group (COOH), both attached to the same carbon.Blood ureanitrogenBUNUrea produced in the cow’s liver that is released to thebloodstream and either transferred to the gastrointestinal tractor excreted by the kidneys into the urine.CrudeproteinCPA laboratory measure of the total nitrogen in feed or biologicalsamples (e.g., milk or blood) that typically includes both trueproteins and non-protein nitrogen sources.MetabolizableProteinMPProteins that produce amino-acids available for transfer from thedigestive system to the blood through the intestinal wall. Thetwo main sources of proteins digested in the small intestine ofa dairy cow are microbial protein synthesized in the rumen andthe dietary rumen undegraded proteins.Microbialcrude proteinMCPNitrogen captured in rumen microbes as they grow duringruminal fermentation. Microbial crude protein includes both trueprotein and non-protein nitrogen mostly in the form of DNA.Microbial trueproteinMTPTrue protein synthesized by rumen microbes as they growduring fermentation. Microbial true protein is a main source ofmetabolizable protein for the cow.Milk ureanitrogenMUNNitrogen in the form of urea measured in the milk. Milk ureanitrogen originates from and is in equilibrium with BUN.Nitrogen useefficiencyNUEDaily secretion of nitrogen in the milk (most often measuredas “true milk protein”) divided by daily consumption of taining compounds such as ammonia, urea, andamino-acids commonly found in feed and biological samples.Protein--Molecular compound consisting of one or more chains of atleast 50 amino-acids held together by peptide bonds. Proteinscarry out many important biological functions. Most of the crudeprotein in milk is in the form of protein. On average, proteinscontain 16% nitrogen.RumendegradableproteinRDPProtein and non-protein nitrogen that can be degraded andproduce ruminal ammonia as a result of microbial activity.Rumen degraded protein refers also to the fraction of dietarycrude protein that may serve as a source of nitrogen for ruminalmicrobial growth.RumenundegradableproteinRUPTrue protein that cannot be degraded in the rumen but proteincan be partially digested in the small intestine.SolubleproteinSPThe fraction of crude protein that is soluble in rumen fluid. It is oftenassumed that soluble proteins are readily degraded in the rumen.True proteinTPA synonym of protein.Urea--An organic molecule soluble in water that is the maincomponent in urine, with chemical formula CO(NH₂)₂.Urinary ureanitrogenUUNNitrogen in the form of urea excreted in the urine. Urinary ureanitrogen varies from approximately 50-90% of total nitrogen in urine.Rebecca A. LarsonBiological Systems Engineering,University of Wisconsin-MadisonLarry ChaseAnimal Science,Cornell UniversitySanjeewa D. RanathungaDairy Science,University of Wisconsin-MadisonMatthew D. RuarkSoil Science,University of Wisconsin-MadisonSUSTAINABLE DAIRY PARTNERSUNIVERSITY OF WISCONSIN-MADISONCORNELL UNIVERSITYPENNSYLVANIA STATE UNIVERSITYUNIVERSITY OF ARKANSASUNIVERSITY OF MARYLANDUNIVERSITY OF MICHIGANUNIVERSITY OF WASHINGTONNORTH CAROLINA AGRICULTURALAND TECHNICAL STATE UNIVERSITYINNOVATION CENTER FOR US DAIRYUSDA ARS DAIRY FORAGERESEARCH CENTERUSDA ARS PASTURE ANDWATERSHED MANAGEMENTUSDA ARS NATIONAL LABORATORY FORAGRICULTURE AND ENVIRONMENTUSDA NATIONAL AGRICULTURE LIBRARY1
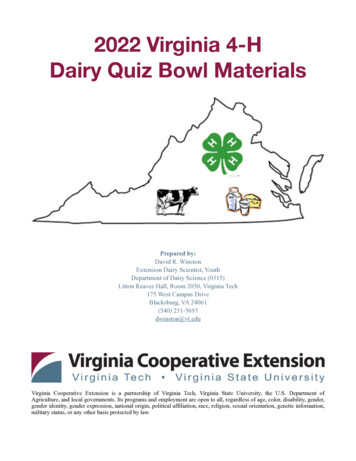
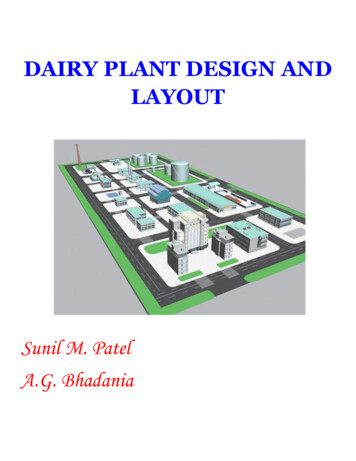
IntroductionNitrogen (N) is an important nutrient for dairy cows and isa major constituent of amino-acids, which are the buildingblocks of protein. The release of amino-acids from proteinsin the digestive system followed by their absorption is keyto providing animals with the amino-acids they need tobuild their own proteins, which are essential for all biologicalfunctions, including maintenance, growth, milk production,and pregnancy. Avoiding deficiencies or excess protein in thediet is important to optimize nitrogen use efficiency (NUE).Feeding diets deficient in protein may severely limit digestiveefficiency, milk production, and milk protein production.On the other hand, feeding excess protein can result ininefficiencies, as the N that is not used for productivefunctions is excreted in urine. Additionally, the more N thatis excreted in urine, the greater the environmental risks fromundesirable N losses to air and water.Although there are methods to measure a cows NUE, theyare expensive and time consuming. Thus, scientists havedeveloped indicators such as the concentration of urea Nin the milk (milk urea N, or MUN) and urea in the blood ofthe cow (blood urea N, or BUN). These indicators reflectboth N consumption and the excretion of urinary urea N(UUN), and thus they are useful tools in adjusting dairyrations to maximize NUE and minimize the risks of negativeenvironmental impacts. One of the main strategies toincrease NUE and reduce UUN excretion is to reduce theingestion of crude protein (CP), but this must be done withcaution to avoid underfeeding CP.Forms of nitrogen and their transformation inthe cow’s digestive systemFat and protein are the main determinants of milk price. As aresult, increasing the yield of these valuable components inmilk can increase revenue. Dietary composition can stronglyinfluence milk composition, and therefore many dairyfarmers hire consultants to formulate rations that maximizemilk production, fat yield, and protein yield. Deciding onthe concentration of protein in the diet of a dairy cow haseconomic implications for the farmer, as commercial proteinsupplements are among the most expensive componentsof dairy diets. Despite the cost, protein supplementation oflactating cow diets is common around the world.Crude protein is a laboratory measure of the total N in thefeed, which comes from both true protein and non-proteinN sources. True proteins (TP) are long chains of amino-acidsthat contain on average 16% N. In contrast, non-protein Nsources are typically simpler compounds with variable Ncontent, such as urea, ammonia, and DNA. The laboratorymethod to measure CP actually measures N content and notTP. Nutritionists have agreed to refer to CP content of a feedas its N content measured in the laboratory multiplied by6.25 (i.e., 100/16) (Equation 1).CP N x 6.25 (Eq. 1)In equation 1, both CP and N are typically expressed as apercent of the dry matter. For example, if corn grain analysisreveals N content of 2.18% of the corn’s dry matter, its CP is2.18 x 6.25 8.0% CP (on a dry matter basis). However, notall N in the corn is in the form of TP, and the proportion of TPand non-protein N is quite variable among feeds.When feeding a dairy cow, the N (or CP) consumed isclassified using different terms to identify the portion thatis degradable in the rumen, digestible in the small intestine,and indigestible as it moves through the cow’s digestivesystem (Figure 1). The N-containing compounds that can bedegraded by ruminal microorganisms are known as rumendegradable protein (RDP). The fraction (mostly TP) thatcannot be degraded by rumen microorganisms passes to thesmall intestine where it is partially digested and eventuallyserves as a direct source of amino-acids to the cow. Thisprotein that escapes rumen degradation is known as rumenundegradable protein (RUP). Each source of RUP has its ownintestinal digestibility value. The amount of RDP and RUPvaries considerably among feeds (dietary constituents), butthe following relationship (Equation 2) holds true for all feeds:CP RDP RUP(Eq. 2)In equation 2, all terms can be expressed as a percentage ofthe dry matter intake if one focuses on characterizing a feed.They can also be expressed as daily amounts consumed bythe cow (CP), degraded in the rumen (RDP), and escapingrumen degradation (RUP).Although CP has traditionally been used to formulate dairyrations, amino-acids are what cows require as the buildingblocks for the synthesis of their own proteins. The proteinsthat produce amino-acids available for transfer fromthe digestive system to the blood through the intestinalwall are collectively called metabolizable protein (MP)by nutritionists. There are two main sources of MP: thedietary RUP (as described in the previous paragraph) andthe microbial protein synthesized in the rumen during thefermentation of the feed consumed by the cow. In general,MP is a much better predictor of milk production than CP.Measuring MP is extremely difficult, but there are predictionmodels precise enough to determine reliable MP estimates.The main two requirements that nutritionists seek to fulfillwhen formulating dairy rations are those of the ruminalmicrobes (N supplied as RDP) and those of the cow(amino-acids supplied as MP). Amino-acids are required for2
Oral CavitySmall IntestineLiverMPUNH3 AAPRTSalivaUAAAAUTo LiverSalivary GlandsFecal NUrinary NneyKidSmall IntestineIntake NReticuloRumenTo LungsHLiverFrom ToLiverMilk N(PRT U)NH3To Small IntestineImage content developed byMichel Wattiaux and illustrationby Elizabeth Rossi. UdderKidneyUAAUPRTUTo BladderFigure 1. Protein and urea N in the digestive system of the cow. Organs: B: Bladder, H: Heart, K: Kidney, LI: Large intestine, LV: Liver,RR: Reticulo-rumen, SI: Small intestine, SG: Salivary gland, UT: Uterus. Forms of nitrogen: AA: Amino-acid, FN: Fecal nitrogen, MCP:Microbial crude protein, MP: Metabolizable protein, NI: Nitrogen intake, NH3: Ammonia, PRT: Protein, RDP: Rumen degradableprotein, RUP: Rumen undegradable protein, U: Urea, UN: Urinary nitrogen. Illustration by Michel Wattiaux and Elizabeth Rossi.3
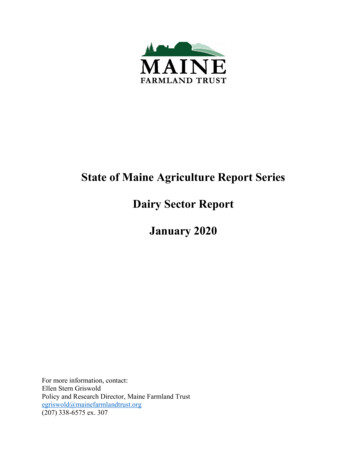
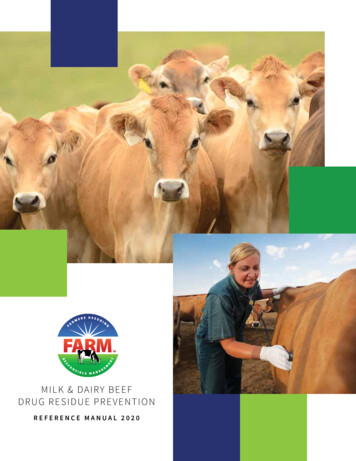
maintenance, tissue growth, lactation, and reproduction(NRC 2001). Except for maintenance, which is required ona constant basis throughout the cows life, all these bodilyfunctions depend on the stage of reproduction, lactationcycle, and parity of the cow. Total daily cow requirements canbe estimated as the sum of these four body functions andquantified with a factorial approach presented by NRC (2001).For efficient milk protein synthesis, the profile of the suppliedamino-acids in the MP should ideally match the profile ofthe amino-acid in protein being synthesized. Researchershave identified the profile of different protein sources andconcluded that microbial protein has the most similarprofile to milk protein compared to any feed ingredientused as supplemental protein in the diet (NRC 2001).This is true especially in regard to methionine and lysine,which typically are the most limiting amino-acids for milkproduction. The optimum ratio of lysine to methionine is 3:1at concentrations of 7.2% for lysine and 2.4% for methioninein MP, respectively (NRC 2001). As a result, nutritionistsshould formulate diets for lactating cows that focus not onlyon commercial sources of RUP or supplemental amino-acids,but also on the rumen’s ability to ferment the carbohydrates.This is because these energy sources are driving the microbialprotein synthesis in the rumen, which considerably influencesthe amount and quality of MP supply in the intestine.Fate of rumen degradable proteinThe RDP is the fraction of the CP a cow consumes that isdegraded by rumen microbes. When the CP reaches therumen, ruminal microorganisms degrade any N-containingcompound into simpler structures with ammonia being theend-product of degradation. In turn, the ammonia producedwithin the rumen is used by microbes to synthesize their ownproteins. Some microbes, however, can also incorporate preexisting amino-acids. In many feeding situations (especiallywhen including high-CP legume feed ingredients), rumenmicrobes produce more ammonia than they can use. Theexcess ammonia is absorbed into the bloodstream to beprocessed by the liver. The liver is extremely efficient atconverting ammonia to urea. Thus, the blood that bringsnutrients from the digestive system to the liver is rich inammonia, but the blood that drains out of the liver intothe general circulation is rich in urea. This conversion issometimes referred to as “ammonia detoxification” becauseammonia in the general circulating blood is known to havedevastating toxic effects responsible for rapid death of theanimal.There are two possible fates for BUN. First, it can be recycledinto the digestive tract (diffusing from the blood to the salivaor through the arteries that bring nutrients to the digestivetissues) and serve as a source of “internal” RDP for rumenmicrobes. Second, it can be captured by the kidney andexcreted as UUN. Nutritionists have found recently that BUNis a useful indicator of excess RDP in the diet and other Ntransformation in the body of the cow.Fate of metabolizable proteinMicrobial true protein (MTP) synthesized in the rumenand the dietary CP that escapes rumen degradation (RUP)eventually reach the small intestine and are digested byenzymes from the cow’s digestive system. The undigestedN will eventually be lost in the fecal material. However, thedigested amino-acids, which constitute the MP supply ofa diet to the cow, are absorbed into the bloodstream andtransported to the liver. A few amino-acids pass through theliver, but most are captured and processed. The liver usesamino-acids to synthesize many proteins with importantbiological functions once they are released into generalcirculation. Finally, the liver may use amino-acids as an energysource to produce urea N. Thus, the profile of amino-acidsentering the general blood circulation is very different fromthe profile of amino-acids absorbed from the digestive tract.Amino-acids can be: 1) used to maintain the body of the cow,2) used for growing a fetus (if the dairy cow is pregnant), or3) taken up by the mammary gland to produce milk proteins.The amino-acids that are not used by these peripheral tissuesare eventually returned to the liver.Nitrogen use efficiencyEvaluating how well the dairy cow converts dietary N intomilk N can be done by analyzing two important indicators:nitrogen use efficiency (NUE) and milk urea nitrogen MUN(see below). Nitrogen use efficiency is the ratio of N in themilk divided by the daily N consumed. Studies indicate thatNUE may range from less than 20% to a theoretical maximumof approximately 45%. The remaining N (60-80%) is excretedin the manure, with approximately half in fecal material andhalf in the urine (Hutjens and Chase 2012). Figure 2 showshow the intake N is partitioned between milk, feces, andurine in lactating dairy cows in the U.S. Interestingly, a typicaldairy cow in the U.S. excretes more urea N in urine than N inmilk. This highlights the importance of different strategiesto improve the use of N to meet cows’ needs but reduceexcesses that they excrete.Higher NUE values suggest a better conversion efficiency ofration N into milk protein N. Consequently, a high NUE valuealso indicates a lower excretion of N into the environmentvia manure. However, high NUE values could also mean thatthere is a deficiency of dietary protein, which can lower milkproduction. Figure 3 serves as a guideline to interpret NUEvalues.As previously mentioned, one common strategy to minimizeexcreted N is to reduce the dietary CP content. Researchershave found that a 1% reduction in CP can reduce urinary4
NitrogenoutputsNitrogenexcretionNitrogenintakeFeed nitrogen1.07 lb/day(485 g/day)28%Milk nitrogen33%Fecal nitrogen38%95%Milk true protein5%Milk urea nitrogen82%Urea nitrogen18%Other nitrogencompounds0.29 lb/day(133 g/day)0.35 lb/day(159 g/day)Urinary nitrogen0.41 lb/day(185 g/day)0.28 lb/day(126 g/day)0.01 lb/day(7 g/day)0.33 lb/day(152 g/day)0.07 lb/day(33 g/day)Figure 2. Nitrogen content in feed, milk, and manure from a lactating dairy cow in the U.S. (Adapted from Spek et al. 2013).InterpretationNUE (%) 35Best scenario - ensure CP is not deficient30 - 35Very good - minor adjustments needed to increase NUE25 - 30Good - opportunities for improvement20 - 25Low - make changes to the ration 20Very low - excretion levels of N are high and N efficiency is lowFigure 3. Interpretation of nitrogen use efficiency (NUE) values (adapted from Chase 2007).urea N by 15% when CP constitutes 13-19% of the dry matterintake (Wattiaux and Ranathunga 2016). The challenge fordairy farmers and dietary consultants is to minimize CPcontent in the diet without sacrificing milk yield. Values forNUE in commercial dairy farms generally range from 20-35%,where maximum reported values can reach 40-45% (Chase2011). Many factors affect NUE, with feed ration CP contentas one of the most studied (Huhtanen and Hristov 2009). Forexample, NUE generally decreases as ration CP increases.Colmenero and Broderick (2006) observe that an increase inCP does not change milk N, but rather increases total manureN excreted, mostly in the form of urinary N. Varga (2010)shows a substantial NUE improvement after reducing the CPcontent in the dairy ration from 18% to 16%. Although NUE5
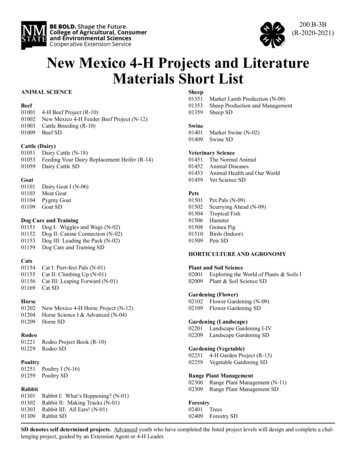
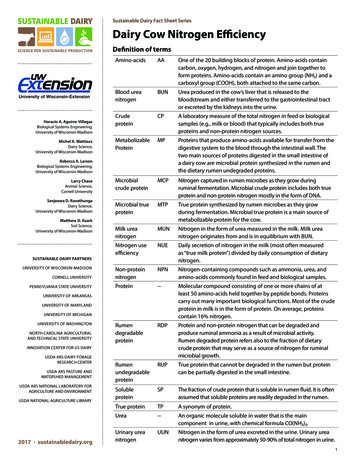
Stage of lactationEarly (0-30 days)Peak and post peak (31-150 days)Mid to late ( 150 days) 99 - 11Lack of dietaryproteinIntake and milkyield may besub-optimal12 - 14 15AcceptableExcess dietary proteinMost desirableCheck RDP, RUP and/or adjust NFCFigure 4. Interpretation of milk urea nitrogen (MUN) for Holstein herds. RDP: rumen degradable protein; RUP: rumen undegradable protein; NFC: non-fiber carbohydrates (Miller, Shaver, and Wattiaux 2004).can be useful in dietary decision-making for dairy producers,its estimation can be challenging, as it requires knowingthe N content in both the feed and the milk, which can beexpensive and time-consuming information to obtain.Milk urea nitrogen (MUN)The overall efficiency of N utilization in dairy cattle canalternatively be predicted by MUN. Urea is present in the milkin very small concentrations (approximately 3-25 mg/dL), asa result of diffusion of BUN through the secretory cells of themammary gland. Thus, MUN is highly correlated with BUN.In many situations, MUN can be used to acquire a generalestimate of the NUE of the herd. However, it has becomecommon practice to track and adjust N efficiency based onMUN, as it can be obtained very inexpensively and reliablyfrom milk samples processed through dairy herd recordsorganizations or through the processing plant.High MUN levels typically indicate low NUE and high UUN(Hutjens and Chase 2012), both of which are undesirable. Onthe other hand, when MUN is too low, milk production andmilk protein can be reduced, which is also undesirable froma profitability standpoint. Traditionally, recommended MUNvalues range from 10-14 mg/dL (Ishler 2017). More recently,researchers recommend that MUN values range from 8-12mg/dL to reduce ammonia levels in the rumen (Ishler 2017).Figure 4 shows an interpretation of the MUN values forHolstein herds depending on the stage of lactation.Formulating ration to increase NUE andmaintain MUN in the optimal rangeAlthough CP plays a significant role in developing dairyrations, it should not be the only consideration whendeveloping diet formulations because it gives littleinformation about the key variables that affect milkproduction (e.g., RDP and MP). Formulating low-CP dietscould reduce milk production and protein content if theCP content in the diet is too low, especially if MP is notconsidered.of milk production. Diets based only on CP could overfeedor underfeed protein, as the MP needs of the cow could bemet with different CP contents depending on the dietaryconstituents (Block 2014). By balancing for MP, rations can beadjusted to CP contents as low as 14-15% CP and maintainhigh levels of milk production. On the contrary, whenMP is not balanced, there is potential for environmentalcontamination from N losses to the environment, as wellas economic losses from reduced milk production or fromexcess costs of unneeded protein feed supplements.Effectively balancing rations based on MP can be challengingbecause it requires the use of specialized software to predictMP requirements and supplied MP under a wide varietyof situations (Block 2014). Both the farmer and nutritionistneed to agree and commit to this approach with consistentmeasurements and ration adjustments. Consistency in feedcan facilitate this process and minimize risks and monitoringneeds (Chase 2011).As indicated above, one of the key factors for efficient N useis to provide rumen fermentable carbohydrates, which act asenergy sources for the microbes to convert RDP and rumenammonia into microbial protein. MUN values are highlyvariable and can be influenced by different feeding practices.Some of the feeding practices contributing to high MUNvalues (low NUE) include: Feeding excess total CP. For example, cows grazing inplentiful pasture areas or changing to hay crop silagethat is higher in protein or soluble protein. Feeding excess RDP and soluble protein. For example,changing from heat-treated soybeans to raw soybeans. Feeding insufficient fermentable carbohydrates suchas starch. For example, feeding fresh corn silage, whichmay have less available starch, instead of fermented cornsilage. Feeding grains that have larger particle size, as thiswill reduce the rate of fermentation in the rumen. Forexample, coarsely ground corn grain.NRC (2001) advises use of MP rather than CP for proteinformulation and utilization because MP is a better predictor6
There are other factors that affect MUN at a broader level: Breed: Holstein cows have been shown to have lowerMUN (12 mg/dL) than Jersey (14 mg/dL) and BrownSwiss (14.8 mg/dL) in a study in the Midwest (Wattiaux,Nordheim, and Crump 2005). Season: MUN values are generally higher during thesummer due to heat stress (Hutjens and Chase 2012).However, some studies attribute these changes tochange in seasonal feeding practices and other management practices (Wattiaux, Nordheim, and Crump 2005). Sampling schedule: Sampling in the evening generallyresults in higher MUN than sampling in the morning.This is likely attributable to the feeding schedule, asMUN values are higher 3-5 hours after feeding (Hutjensand Chase 2012). Milking frequency: Lactating cows that are milked threetimes a day have higher MUN values than herds milkedtwice a day (Wattiaux, Nordheim, and Crump 2005). Genetics: A recent study suggests that MUN variationsmay be attributed to genetics due to a high heritabilityof MUN (Aguilar et al. 2012).Herds can have different optimal MUN values dependingon their characteristics and practices (normal values rangefrom 8-16 mg/dL). MUN testing can be an important toolfor monitoring changes in feeding and managementpractices that affect the nutritional content of the milk. Whenbeginning MUN testing, it is important to establish a baselinethat is representative of the herd. Considerable changes (e.g.,more than three sampling points) are an indication that amanagement or feeding practice is affecting the N efficiencyof the herd (Hutjens and Chase 2012). Look for weeklyaverages, as daily MUN values can vary significantly. Table 1presents some feeding recommendations to maintain MUNvalues at efficient ranges.Negative impacts of nitrogen losses to theenvironmentAlthough fecal N is relatively stable and can serve as aneffective soil amendment to maintain long-term soilfertility, urinary N (mostly UUN) (Figure 2) is unstable andreadily convertible to ammonia. The ammonia is quicklylost to the atmosphere, representing a potential sourcefor environmental contamination and human health risks.Ammonia emissions can travel long distances before settlingon the soil. Deposition of ammonia from the air back to theEarth’s surface can contribute to eutrophication of aquaticecosystems (lakes and rivers), which promotes algal growththat can potentially affect aquatic populations. In addition,deposited ammonia can be transformed into nitrous oxide,a potent greenhouse gas (GHG) that is 265-298 times morepotent than carbon dioxide (IPCC 2014).Table 1. Recommended ranges of different feeding variablesin the dairy ration to maintain efficient MUN levels (Hutjensand Chase 2012).Feeding variablesRecommended rangeCrude protein (CP)15-18% of rationRumen degradable protein(RDP)60-65% of total CPRumen undegradableprotein (RUP)35-40% of total CPSoluble protein (SP)50% of RDPStarch levels24-28% of ration dry matterSugar levels4-6% of ration dry matterTrue milk protein to fat ratio(protein/fat) 75% (a value less than thissuggests a low MUN)Manure consistencyHigh MUN results in loosermanure, low MUN results infirmer manureAmmonia emissions can have negative impacts on thehealth and productivity of animals as well as on humanhealth. For example, ammonia can irritate eyes and lungs,with the latter representing a major risk for people withrespiratory problems. Ammonia can also react with othercompounds in the atmosphere to form particulate matterthat can penetrate deep into the lungs causing healthimpacts. Limiting N losses by reducing N excreted by the cowcan reduce these negative impacts.Given that a reduction in CP directly affects excreted N inmanure and urine, low-CP diets can decrease ammoniaemissions significantly. Kebreab et al. (2002) estimate thatammonia emissions could be decreased by 20% in the U.S.if dairy farms lower the CP content in feed to 16%.ReferencesAguilar, M., Mark D. Hanigan, H. A. Tucker, B. L. Jones, S.K. Garbade, Michael L. McGilliard, Charles C. Stallings,Katharine F. Knowlton, and R. E. James. 2012. “Cow andherd variation in milk urea nitrogen concentrations inlactating dairy cattle.” Journal of Dairy Science 95: 7261-68.doi:10.3168/jds.2012-5582.Block, Elliot. 2014. “Rations 101: Dairy cows don’t have acrude protein requirement.” Progressive Dairymen. n-requirement.Chase, Larry E. 2007. “How efficiently are your cows usingration nitrogen?” National Feed Management for Livestockand Poultry. Washington State University. https://puyallup.wsu.edu/lnm/publications.7
Chase, Larry E. 2011. “Maintaining milk yield while loweringdietary protein content.” WCDS Advances in DairyTechnology 23: 153-64.Colmenero, J. J., and Glen A. Broderick 2006. “Effect of dietarycrude protein concentration on milk production andnitrogen utilization in lactating dairy cows.” Journal of DairyScience 89: 1704-12.Huhtanen, Pekka, and Alexander N. Hristov. 2009. “A metaanalysis of the effects of dietary protein concentration anddegradability on milk protein yield and milk N efficiency indairy cows.” Journal of Dairy Science 92: 3222-32.Hutjens, Mike, and Larry E. Chase. 2012. “Interpreting milkurea nitrogen (MUN) values.” National Feed Managementfor Livestock and Poultry. ting-milk-urea-nitrogen-mun-values.Ishler, Virginia A. 2017. Interpretation of milk urea nitrogen(MUN) values. The Pennsylvania State University ExtensionPublication No. 2008-134. un-values.nitrogen and urinary urea nitrogen excretion on bylactating dairy cattle in Northwestern Europe and NorthAmerica: a meta-analysis.” Journal of Dairy Science 96:4310-22.Varga, Gabriella A. 2010. Why use metabolizable protein forration balancing? Cooperative Extension System. , Michel A., Erik V. Nordheim, and Peter M. Crump.2005. “Statistical evaluation of factors and interactionsaffecting dairy herd improvement milk urea nitrogen incommercial Midwest dairy herds.” Journal of Dairy Science88: 3020-35.Wattiaux, Michel A., and Sanjeewa Ranathunga. 2016. “Milkurea Nitrogen as a tool to assess efficiency of Nitrogenutilization in dairy cows.” Proceedings of Four-State DairyNutrition and Management Conference, 79-88.Intergovernmental Panel on Climate Change (IPCC). 2014."Climate Change 2014: Mitigation of Climate Change."Contribution of Working Group III to the Fifth AssessmentReport of the Intergovernmental Panel on Climate Change.Edited by Ottmar Edenhofer, Ramon Pichs-Madruga, YoubaSokona, Ellie Farahani, Susanne Kadner, Kristin Seyboth,Anna Adler, Ina Baum, Steffan Brunner, Patrick Eickemeier,Benjamin Kriemann, Jussi Savolainen, Steffen Schlomer,Chistoph von Stechow, Timm Zwickel, and Jan C. Minx.Cambridge, United Kingdom and New York, NY, USA:Cambridge University Press. ipcc wg3 ar5 full.pdf.Kebreab, Ermias, James France, J. A. Mills, R. Allison, andJoost Dijkstra. 2002. “A dynamic model of N metabolism inthe lactating dairy cow and an assessment of impact of Nexcretion on the environment.” Journal of Animal Science80: 248-59.Miller, Zen, Randy Shaver, and Michel Wattiaux. 2004. Milkurea nitrogen (MUN). University of tional Research Council (NRC). 2001. Nutrient Requirementsof Dairy Cattle, 7th Rev. Ed, Washington, D.C.: NationalAcademy Press.Spek J. W., Joost Dijkstra, Gert van Duinkerken, Wouter H.Hendriks, and Andre Bannink. 2013. “Prediction of urinary8
AcknowledgementThis material is based upon work that is supported by the National Institute of Food and Agriculture, U.S. Department of Agriculture, under award number 201368002-20525. Any opinions, findings, conclusions, or recommendations expressed in this publication are those of the author(s) and do not necessarily reflect theview of the U.S. Department of Agriculture. 2018 University of Wisconsin System Board of Regents and University of Wisconsin-Extension, Cooperative Extension. Al
maintenance, tissue growth, lactation, and reproduction (NRC 2001). Except for maintenance, which is required on a constant basis throughout the cows life, all these bodily functions depend on the stage of reproduction, lactation cycle, and parity of the cow. Total daily cow requirements can be estimated as the sum of these four body functions and