Transcription
Research Reportfor Adaptive Testing Assessment
Overview of this Research ReportThe purpose of this report is to provide the validity research for the Everything DiSC assessment andprofiles. Section 1 includes background and research on the assessment, specifically on theEverything DiSC assessment, the DiSC scales that are derived from this information, and thecircumplex representation of the model. Sections 2-6 provide research on the application-specificmodels used in Everything DiSC Management, Everything DiSC Sales, Everything DiSC Workplace ,Everything DiSC Productive Conflict, and Everything DiSC Agile EQ . Section 7 provides theresearch for the 18 additional scales in Everything DiSC Work of Leaders . Section 8 provides theresearch for the Everything DiSC Comparison Report. The Appendices contain more detailedinformation on the Everything DiSC assessment research.Table of ContentsSection 1: Everything DiSC Assessment Research . 4The DiSC Model . 4Assessment and Scoring . 5Overview of the Validation Process . 6Reliability . 7Validity . 12Summary of the Validation Results . 25Section 2: Everything DiSC Management Research . 26Background. 26The Research. 26Summary of the Validation Results . 32Section 3: Everything DiSC Sales Research . 33Background. 33The Research. 33Summary of the Validation Results . 38Section 4: Everything DiSC Workplace Research. 39Background. 39The Research. 39Summary of the Validation Results . 42Section 5: Everything DiSC Productive Conflict Research. 43Background. 43The Research. 43Summary of the Validation Results . 47Copyright 2013 by John Wiley & Sons, Inc. All rights reserved.Permission to reproduce only when used in conjunction with Everything DiSC assessments.2
Section 6: Everything DiSC Agile EQ Research . 48Background. 48Scoring of the Scales . 48Sample Characteristics . 50Internal Reliability . 52Intercorrelations Among the Mindset Scales . 54Summary of the Validation Results . 55Section 7: Everything DiSC Work of Leaders Research . 56Background. 56The Validation Process . 56Internal Reliability . 56Intercorrelations Among the Work of Leaders Scales . 56Correlations Among Work of Leaders Scales and DiSC Scales. 60Section 8: Everything DiSC Comparison Report Research . 62Background. 62Selection of the Continua within Each Report. 62Scoring of the Continua . 63Internal Reliability . 64Intercorrelations Among the Continua Scales. 64Summary of the Validation Results . 65Section 9: Appendices . 66AppendixAppendixAppendixAppendixAppendix1. Everything DiSC Assessment Development Sample Demographics . 662. Percent of Variance Accounted for by Gender. 673. Correlation Between the Everything DiSC Assessment and the 16PF . 684. Correlation Between the Everything DiSC Assessment and the NEO-PI-R . 705. References. 72Note: If you are interested in a deeper overview of the DiSC model, research, and interpretation, weencourage you to read the Everything DiSC Manual—our comprehensive guide to the research thatsupports the Everything DiSC suite of assessments. Available through your Everything DiSCAuthorized Partner, Amazon, and Wiley.com, this manual is an essential reference tool for anyonefacilitating Everything DiSC solutions.Copyright 2013 by John Wiley & Sons, Inc. All rights reserved.Permission to reproduce only when used in conjunction with Everything DiSC assessments.3
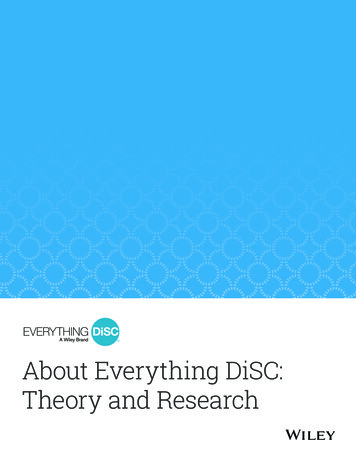
Section 1: Everything DiSC Assessment ResearchSection 1: Everything DiSC Assessment ResearchThe DiSC ModelThe foundation of DiSC was first described by William Moulton Marston in his 1928 book, Emotions ofNormal People. Marston identified what he called four “primary emotions” and associated behavioralresponses, which today we know as Dominance (D), Influence (i), Steadiness (S), andConscientiousness (C). Since Marston’s time, many instruments have been developed to measurethese attributes. The Everything DiSC assessment uses the circle, or circumplex, as illustrated below,as an intuitive way to represent this model. Although all points around the circle are equally meaningfuland interpretable, the DiSC model discusses four specific reference points.Dominance: direct, strong-willed, and forcefulInfluence: sociable, talkative, and livelySteadiness: gentle, accommodating, and soft-heartedConscientiousness: private, analytical, and logicalFigure 1. Circumplex DiSC ModelCopyright 2013 by John Wiley & Sons, Inc. All rights reserved.Permission to reproduce only when used in conjunction with Everything DiSC assessments.4
Section 1: Everything DiSC Assessment ResearchAlthough some people tend equally toward all of these regions, research indicates that most of us leantoward one or two. Each person who takes the Everything DiSC assessment is plotted on the circle,also known as the Everything DiSC Map. The example in Figure 1 shows a person (represented by thedot) who tends toward the D region, but also somewhat toward the i region. This represents a Di style.This person, therefore, is probably particularly active, bold, outspoken, and persuasive, as thesequalities generally describe people who share both the D and i styles. The distance of the dot from thecenter of the circle is also meaningful. People whose dots fall toward the edge of the circle, as shownin Figure 1, are much more inclined toward their DiSC styles and are likely to choose the priorities ofthat style over those of other styles. People whose dots fall close to the center of the circle are lessinclined toward a particular style and find it fairly easy to relate to the priorities of other styles.Assessment and ScoringThe Everything DiSC assessment asks participants to respond to statements on a five-point orderedresponse scale, indicating how much they agree with each statement. These responses are used toform scores on eight scales (standardized to have a mean of zero and standard deviation of one) thatare located around the DiSC circle, as shown in Figure 2. The eight scales are as follows:D measures a direct, dominant disposition using adjectives such as aggressive, strong-willed, andforceful.Di measures an active, fast-paced disposition using adjectives such as dynamic, adventurous, andbold.i measures an interactive, influencing disposition using adjectives such as sociable, lively, andtalkative.iS measures an agreeable, warm disposition using adjectives such as trusting, cheerful, and caring.S measures an accommodating, steady disposition using adjectives such as considerate, gentle, andsoft-hearted.SC measures a moderate-paced, cautious disposition using adjectives such as careful, soft-spoken,and self-controlled.C measures a private, conscientious disposition using adjectives such as analytical, reserved, andunemotional.CD measures a questioning, skeptical disposition using adjectives such as cynical, stubborn, and critical.Copyright 2013 by John Wiley & Sons, Inc. All rights reserved.Permission to reproduce only when used in conjunction with Everything DiSC assessments.5
Section 1: Everything DiSC Assessment ResearchFigure 2. Eight DiSC ScalesDuring the assessment process, the respondent’s variance on each of the eight scales is calculated. Ifthe variance on a particular scale is above a predetermined cut-off, the participant is presented withadditional items for that scale. In this way, the assessment can gain more certainty with regard to therespondent’s true score. This process mirrors those used in other adaptive testing assessments.An individual’s scores on the eight scales are then used to plot the individual on the Everything DiSC Map, as represented by a dot. (Note that these eight scale scores are not directly reported in theprofiles.) The Everything DiSC Map is divided into 12 sections, or styles, each representing 30 degreeswithin the circle. Feedback is largely based on the section in which the dot falls. Other factors, such asthe dot’s distance from the center of the circle and the individual’s priorities, are also reflected in thefeedback.Overview of the Validation ProcessPsychological instruments are used to measure abstract qualities that we can’t touch or see. Theseare characteristics like intelligence, extroversion, or honesty. So how do researchers evaluate theseinstruments? How do we know whether such tools are actually providing accurate information aboutthese characteristics or just generating haphazard feedback that sounds believable? Simply put, if aninstrument is indeed useful and accurate, it should meet a variety of different standards that have beenestablished by the scientific community. Validation is the process through which researchersCopyright 2013 by John Wiley & Sons, Inc. All rights reserved.Permission to reproduce only when used in conjunction with Everything DiSC assessments.6
Section 1: Everything DiSC Assessment Researchassess the quality of a psychological instrument by testing the tool against these different standards.This paper is designed to help you understand these different standards and see how the EverythingDiSC assessment performs under examination.Validation asks two fundamental questions:1. How reliable is the tool? That is, researchers ask if an instrument measures in a consistent anddependable way. If the results contain a lot of random variation, it is deemed less reliable.2. How valid is the tool? That is, researchers ask if an instrument measures accurately. The morethat a tool measures what it proposes to measure, the more valid the tool is.Note that no psychometric tool is perfectly reliable or perfectly valid. All psychological instruments aresubject to various sources of error. Reliability and validity are seen as matters of degree on continuousscales, rather than reliable/unreliable and valid/invalid on dichotomous scales. Consequently, it is moreappropriate to ask, “How much evidence is there for the reliability of this tool?” than, “Is this toolreliable?”ReliabilityWhen we talk of reliability in relation to profiles such as DiSC assessments, then we are referringpartly to the tool’s stability and partly to its internal consistency.Stability refers to the tool’s ability to yield the same measurements over a period of time. This isgenerally tested by having the same people complete the tool’s questionnaire twice, with a suitabletime interval between the two measurements (the so-called test-retest.) The results are then comparedto determine how strongly they relate to each other (or correlate). If a person’s DiSC style remainsunchanged, a stable tool should produce results that are quite similar between two differentadministrations. In reality, however, it is almost impossible to obtain perfect test-retest reliability on anysophisticated psychological test, even if the individual in question does not change on the measuredattribute. This is because test results are influenced by a variety of extraneous factors that areunrelated to the characteristics that the test intends to measure. For instance, someone who is tiredduring one testing may answer differently than she will on a second testing when she is well-rested.Similarly, another person may respond to a test differently depending on the mood he is in.Copyright 2013 by John Wiley & Sons, Inc. All rights reserved.Permission to reproduce only when used in conjunction with Everything DiSC assessments.7
Section 1: Everything DiSC Assessment ResearchGenerally speaking, the longer the interval between two test administrations, the greater the chancethat these random variables can artificially lower the test-retest reliability of an instrument. In otherwords, the longer the time period between two testings, the lower we would expect the test-retestreliability to be.In practical terms, the stability of DiSC (i.e., test-retest reliability) is measured by asking a group ofrespondents to take a DiSC instrument and then asking those same respondents to take the same testagain at a later time. This stability can be quantified in the form of a reliability coefficient, which is astatistic that is generated by looking at the mathematical relationship between a group’s initial scoreson an instrument and their subsequent scores. Reliability coefficients range between 0 and 1. Thecloser that a correlation coefficient is to 1, the more stable the instrument is considered to be.Researchers generally use the following guidelines to help them interpret these test-retest reliabilitycoefficients: coefficients above .70 are considered acceptable, and coefficients above .80 areconsidered very good.The eight scales of the Everything DiSC assessment have been measured for their test-retestreliability over a two-week period and the following coefficients were found:Table 1. Scale Test-Retest 88C.85CD.85D.86N 599Copyright 2013 by John Wiley & Sons, Inc. All rights reserved.Permission to reproduce only when used in conjunction with Everything DiSC assessments.8
Section 1: Everything DiSC Assessment ResearchThese results suggest that results produced by the Everything DiSC assessment are quite stable overtime. Consequently, test takers and test administrators should expect no more than small changeswhen instrument is taken at different times. As the period between administrations increases, however,the divergent results of these administrations will become more and more noticeable.Note that even over very short intervals an instrument’s results can show small changes. In fact, it isunlikely that two administrations of a test will yield the exact same results on any sophisticatedpsychological instrument. When such changes are observed in DiSC , however, the fundamentalinterpretation of the results will usually be the same.Internal consistency evaluates the degree of correlation among questions that profess to measurethe same thing. That is, each of the eight scales in the DiSC model is measured using a series ofdifferent items (i.e., questions in the form of statements, such as I am direct, I tend to take the lead, Iwant things to be exact, I am always cheerful). Researchers recognize that if all of the items on a givenscale (e.g., the D scale) are in fact measuring the same thing (e.g., Dominance), they should allcorrelate with each other to some degree. In other words, all of the items on a scale should beconsistent with each other. A statistic called Cronbach’s alpha is usually regarded as the best methodof evaluating internal consistency.Figure 3. D Scale ItemsCopyright 2013 by John Wiley & Sons, Inc. All rights reserved.Permission to reproduce only when used in conjunction with Everything DiSC assessments.9
Section 1: Everything DiSC Assessment ResearchCronbach’s alpha expresses the degree of correlation as a specific number, which typically variesbetween 0.0 and 1.0. If the value of alpha is 0.0, then there is no relationship among theitems/statements on a given scale. On the other hand, if all the statements in a questionnaire measurein an identical fashion, then the value of alpha will be 1.0, which indicates absolute internalconsistency. Cronbach’s alpha is calculated separately for each of the assessment’s eight scales.The following guidelines are frequently used to evaluate the quality of a scale’s internal reliability:alpha values above .70 are generally considered acceptable and satisfactory, alpha values above .80are usually considered quite good, and values above .90 are considered to reflect exceptional internalconsistency. In fact, alpha values that are too high may indicate that the items on a scale areredundant or too similar. In such cases, many of the instrument’s items may provide very little newinformation about a respondent.Alpha coefficients were calculated for a sample of 752 respondents. The demographics of this sampleare included in Appendix 1. The scales on the Everything DiSC instruments demonstrate good-toexcellent internal consistency, as shown by the alpha values listed in Table 2. All reliabilities are wellabove .70, with a median of .87.Table 2. Internal Consistency of the Everything DiSC ScalesNumber of ItemsCronbach’s .88ScaleN 752Copyright 2013 by John Wiley & Sons, Inc. All rights reserved.Permission to reproduce only when used in conjunction with Everything DiSC assessments.10
Section 1: Everything DiSC Assessment ResearchAnalyses were also performed to understand the impact of the extra, adaptive questions that somerespondents receive if there is a large amount of variation within their responses to a single scale’sitems. That is, if the variance in a respondent’s ratings to a scale’s items is above a certain level, therespondent is given five to ten extra items that continue to measure the trait assessed by the scale.For convenience, the items that all respondents receive will be called “base items” and the items thatonly inconsistent responders receive will be called “extra items.”Table 3 shows the internal reliabilities for only those respondents who gave the most inconsistentresponses to a given scale’s items, measured by a high degree of response variance. In other words,these are respondents whose scale preferences seemed most unclear. In the first bold column are thealphas for those respondents using both the base items and extra items (which reflects how theserespondents are measured in the actual assessment). In the second bold column are the alphas forthose respondents using only the base items. With only the base items, the median alpha in thissubsample is .62. The median alpha when the extra items are included is .77. By comparing these twocolumns, we can see the internal consistency is much higher for these unclear respondents when theyreceive the extra items. In essence, these extra items are used to further gauge the target trait whenthe normal assessment has produced unclear or variable results. The final column shows thepercentage of respondents in the sample who received extra items on a given scale. On average, 24%of respondents received extra items on an individual scale.Copyright 2013 by John Wiley & Sons, Inc. All rights reserved.Permission to reproduce only when used in conjunction with Everything DiSC assessments.11
Section 1: Everything DiSC Assessment ResearchTable 3. Alpha Coefficients for High Variance RespondentsWith Extra ItemsWithout Extra ItemsScaleAlphaN# ItemsAlphaN# 631881225D.6811613.34116815ValidityAs mentioned, validity indicates the degree to which a tool measures that which it has been designedto measure. Assessing the validity of a psychological tool that measures abstract qualities (likeintelligence, extroversion, or honesty) can be tricky. There are, however, a number of basic strategiesthat researchers use to answer the question, “How well is this instrument measuring what it says it’smeasuring?” The validation strategies discussed here fall under the heading of construct validity.Construct ValidityConstruct validity examines the validity of a tool on a highly theoretical level. A construct is an abstractidea or concept (such as intelligence, dominance, or honesty) that is used to make sense of ourexperience. The Di scale of the Everything DiSC instruments, for example, measures a particularconstruct (i.e., the tendency to be bold, adventurous, and fast paced). This “bold” construct, in turn, istheoretically related to a variety of other constructs. For instance, it is reasonable to assume thatsomeone who is very bold will not be particularly cautious in nature. Thus, bold tendencies andcautious tendencies are theoretically linked in a negative manner. Consequently, if our measure of aCopyright 2013 by John Wiley & Sons, Inc. All rights reserved.Permission to reproduce only when used in conjunction with Everything DiSC assessments.12
Section 1: Everything DiSC Assessment Researchbold tendency has high validity, people scoring high on the Di scale should score relatively low on ascale measuring cautiousness, such as the SC scale. This is essentially what researchers do whenthey examine construct validity. First, they specify a series of theoretical relationships (e.g., theconstruct of boldness is theoretically related to the constructs of X, Y, and Z). Then, they test thesetheoretical relationships empirically to see if the relationships actually exist. If the proposedrelationships do exist, the instrument is thought to have higher validity.Scale IntercorrelationsAs you might imagine, there are a variety of different ways to test construct validity. First, we canexamine the validity of an instrument as a whole. Instruments like the Everything DiSC assessmentpropose an underlying model in which the scales have a specific relationship to each other.Researchers examine the actual relationship among the scales to see if they reflect the theoreticalrelationship proposed by the model.The DiSC model proposes that adjacent scales (e.g., Di and i) will have moderate correlations. Thatis, these correlations should be considerably smaller than the alpha reliabilities of the individual scales.For example, the correlation between the Di and i scales (.50) should be substantially lower than thealpha reliability of the Di or i scales (both .90). On the other hand, scales that are theoretically opposite(e.g., i and C) should have strong negative correlations. Table 4 shows data obtained from a sample of752 respondents who completed the Everything DiSC assessment. The correlations among all eightscales show strong support for the model. That is, moderate positive correlations among adjacentscales and strong negative correlations are observed between opposite scales.Copyright 2013 by John Wiley & Sons, Inc. All rights reserved.Permission to reproduce only when used in conjunction with Everything DiSC assessments.13
Section 1: Everything DiSC Assessment ResearchTable 4. Scale 7-.68-.66-.08.26CD.87Cronbach’s alpha reliabilities are shown in bold along the diagonal, and the correlation coefficients among scales are shownwithin the body of the table. Correlation coefficients range from -1 to 1. A correlation of 1 indicates that two variables areperfectly positively correlated such that as one variable increases, the other variable increases by a proportional amount. Acorrelation of -1 indicates that two variables are perfectly negatively correlated, such that as one variable increases, the othervariable decreases by a proportional amount. A correlation of 0 indicates that two variables are completely unrelated; N 752,as shown in Appendix 1.Because the Everything DiSC assessment model proposes that the eight scales are arranged as acircumplex, an even more strict set of statistical assumptions are required of the data. The pattern ofcorrelations for a given scale are expected to be arranged in a particular order. As can be seen inTable 5, the strongest theorized correlation for a given scale is labeled r1. The second strongest islabeled r2 , and so on. In this case, r4 represents the correlation with a theoretically opposite scale.Consequently, r4 should be a reasonably strong negative correlation. For each scale, we shouldobserve the following relationship if the scales support a circumplex structure: r1 r2 r3 r4.Copyright 2013 by John Wiley & Sons, Inc. All rights reserved.Permission to reproduce only when used in conjunction with Everything DiSC assessments.14
Section 1: Everything DiSC Assessment ResearchTable 5. Expected Scale r4r3r2r11.00CDr1r2r3r4r3r2r1CD1.00Looking at Table 6, we do, in fact, observe a r1 r2 r3 r4 pattern for each scale. In addition, we canexamine the magnitude of these correlations in comparison to the theoretically expected magnitudes.The predicted magnitudes of r1 , r2 , r3 , r4 under a circumplex structure are listed in Table 4, asdescribed by Wiggins (1995). The “actual” rx values are the median correlations for a given rx .Although the actual and predicted values are not exactly the same (a near impossible standard forpractical purposes), the magnitude of the actual and predicted correlation values is quite similar, thusproviding additional support for the DiSC circumplex model and the ability of the Everything DiSC assessment to measure this model.Table 6. Actual and Predicted Scale Relationshipsr1 r2 r3 r4.45 -.11 -.46 -.69Actual(median).42 .03 -.36 -.73PredictedThe Dimensionality of the DiSC Model: Multidimensional Scaling (MDS)A statistical technique called multidimensional scaling also adds support to the DiSC model as acircumplex. This technique has two advantages. First, it allows for a visual inspection of relationshipamong the eight scales. Second, this technique allows researchers to look at all of the scalesCopyright 2013 by John Wiley & Sons, Inc. All rights reserved.Permission to reproduce only when used in conjunction with Everything DiSC assessments.15
Section 1: Everything DiSC Assessment Researchsimultaneously. In Figure 4, scales that are closer together have a stronger positive rel
assessment and profiles. Section 1 includes background and research on the assessment, specifically on the Everything DiSC assessment, the DiSC . Authorized Partner, Amazon, and Wiley