Transcription
KPIs: Metrics and Tools, How andWhere to BenchmarkMay 19, 2016Leah KlinkeDirector, Patient Financial Services
Overview WVU Medicine Revenue Cycle Overview Key Performance Indicator Purpose &Development Sources of KPIs Meaningful Benchmarking Goal Achievement Strategies WVU Medicine Examples
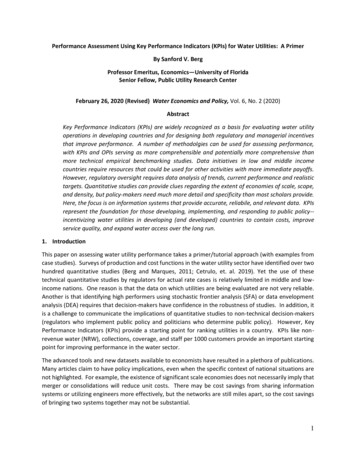
Revenue Cycle 3 facilities on EPIC with consolidated billingoperation in Morgantown, WV 2.28 billion in gross revenue 975 million in net revenue 4 facilities moving to EPIC from dispirit systems bythe end of 2017 with decentralized billing operation 1.44 billion in gross revenue 576 million in net revenue Patient access functions are decentralized ingeography and management
Key Performance Indicators (KPIs)PURPOSE & DEVELOPMENT
What is a Key Performance Indicator? Numerical factor Used to quantitatively measure performance Activities, volumes, etc.Business processesFinancial assetsFunctional groupsThe entire revenue cycleSOURCE: BearingPoint, Key Performance Indicators
“In business, words are words,explanations are explanations, promisesare promises, but only performance isreality.”Harold S. GeneenFormer President and CEO of ITT
Why KPIs? View a snapshot of performance at an individual,group, department, hospital, or regional level Assess the current situation and determine rootcauses of identified problem areas Set goals, expectations, and financial incentivesfor any individual or group Trend the performance of the selected individualor group over timeSOURCE:BearingPoint, Key Performance Indicators
Characteristics of a Quality KPI Set SMART goals ü Specific – Clear and Unambiguousü Measurable – Quantitative vs. Qualitativeü Achievable – Stretch but Not Demotivatingü Relevant – Tie to Overall Goals or Missionü Time Specific – Keep Focused!
Make it Measurable “Count what is countable, measure whatis measurable, and what is notmeasurable, make measurable”Galileo Galilei
Make it Measurable Qualitative measures are subjective and processoriented. Data and results are narrative. Datacollection would include interviews and openended questionnaires Quantitative measures are objective and resultsoriented. Data and results are numeric. Datacollection would include quality checklist orscaled questionnaires with numeric results.
Other Characteristics of a Quality KPIü Must communicate information and not just dataü Must encourage appropriate behavior
Must Communicate Information Goal should precede data collection process Understand what business question you aretrying to answer and work backwards to identify: the form the answers should take the analysis that can produce these answers the data that this analysis would requireSOURCE: Stacy Barr
Must Encourage AppropriateBehavior Do not want to create incentives for noncompliant activities Can create measures that counter anyinappropriate incentives (e.g. quantity of workAND quality of work measured)
Key Performance Indicators (KPIs)SOURCES OF KPIs
HFMA MAP Keys MAP Keys are industry-standard metrics orKPIs used to track your organization's revenuecycle performance using objective, consistentcalculations Specific Keys for Hospitals and Health Systems andPhysician Practice Management around Patient Access Revenue Integrity Claims Adjudication Management
HFMA MAP Keys Pros – Comparable from organization to organization Based on month end/year end financials Cons – Not always measurable in real time Results can be manipulated by changes in processthat do not truly increase or accelerate cash Recommendation A balanced approach using both benchmarkablemonth end results and interim reporting in real time
HFMA MAP Keyswww.hfma.org/Map/MapKeys/ManagementClaims AdjudicationPatient AccessAged A/R as a Percentage ofBilled A/RAged A/R as a Percent ofBilled A/R by Payer GroupConversion Rate of UninsuredPatient to Payer SourceBad DebtClean Claims RateInsurance Verification RateCase Mix IndexDays in Final Billed NotSubmitted to Payer (FBNS)Point-of-Service (POS) CashCollectionsCash Collection as a Percentageof Adjusted Net Patient Service Denial Rate-Partial PayPre-Registration RateRevenueCharity as a Percent ofDenial Write-Offs as a PercentService Authorization RateUncompensated Careof Net RevenueCharity CareDenial Rate-Zero PayCost to CollectDenials Overturned by AppealCost to Collect by FunctionalAreaNet Days in AccountsReceivableTotal Uncompensated Care(New MAP Key, June 2014)Uninsured Discount (New MAPKey, June 2014)Revenue IntegrityDays in Total Discharged NotFinal Billed (DNFB)Days in total Discharged NotSubmitted to Payer (DNSP)Late Charges as a Percentageof Total ChargesNet Days in Credit Balance
Additional Resources NAHAM Access Keys – Members only benefit Vendors may provide specific tracking metrics –make sure you understand how they arecalculated!
Key Performance Indicators (KPIs)MEANINGFULBENCHMARKING
Meaningful Benchmarking Benchmarking is the process of comparingone's business processes and performancemetrics to industry bests and best practices fromother companies How do we set our KPI thresholds? How do we know whether the KPI threshold is astretch or overstretch? When have we arrived?SOURCE: Wikipedia
Meaningful Benchmarking Internal Benchmarking – incremental improvementover historical achievement Where have we been historically? What can we learn from our historical trends? What can we do to influence the future results? External Benchmarking – against industry bestpractices EPIC Financial PulseHFMA MAP Initiative BenchmarkingHFMA MAP Application processHFMA MAP App
HFMA’s Revenue Cycle Scorewww.hfma.org/MAP/MapAwards/
HFMA MAP Awards Winner StatisticalDatawww.hfma.org/MAP/MapAwards/
Key Performance Indicators (KPIs)GOAL ACHIEVEMENTSTRATEGIES
Achievement Strategies Now you have set a quality KPI goal set againsta meaningful benchmark are you done? Watching your KPI move up or down is notenough you need to actively move thenumber!
Achievement Strategies Trickle down goals Director may have a high level goal whose result isinfluenced by a number of areas under his/herinfluence. Managers would take sub-goals that help to achievethe Director’s overall goal, then supervisors, then staff
Achievement Strategies Regular reporting of results Scorecard or staff meeting updates to update allengaged parties in the goal achievement Monitor other related keys to make sure thatfocus in one area does not negatively impactother areas Focus is important, so setting few focused andrelevant goals and keeping team engaged forthe entire measurement time period is important!
Achievement Strategies Break long term goals into shorter term steps For example, you may have a 5 year goal to win aMAP award. Examine which pieces leave you the furthest from thegoal and set goals around improving that area in ashorter term (e.g. 1 year) Set interim quarterly goals to achieve the 1 year goal. This allows team to stay focused and celebrateinterim step achievement!
Achievement Strategies "Anything is measurable in a way that is superiorto not measuring it at all."—Tom DeMarco, co-author of Peopleware: Productive Projectsand Teams Do not be intimidated by data collection orcomplicated scorecards. Look at what data youhave now and start with that. Something isbetter than nothing even if it is not 100%externally benchmarkable or tested. It can beimproved and refined over time if needed.
Key Performance Indicators (KPIs)WVU MEDICINE EXAMPLES
Example 1DAYS IN A/R & 90 DAYS
WVU Medicine KPIs Director Goal: A/R Days, excluding self pay, inhouse, and credit balances (2013-2015) Specific – “Improve business office performancemeasured by improvement of A/R days indicator from31.5 to 29.5 days” Measurable – data source: daily dashboard report Achievable – based on historical performance andopportunity Relevant – ties to our core goal of timely billing Time Specific – “by the end of 2016”
WVU Medicine KPIs Manager Goal: Aged A/R 90 days (2015) Staff Goal: Aged A/R 90 days by Payer group
WVU Medicine KPIsMap Key:Net Days in Accounts ReceivablePurpose: Trending indicator of overall A/R performanceValue: Indicates revenue cycle efficiencyEquation:N: Net A/RD: Average daily net patient service revenue We used a Days in A/R “Real Time” calculation Total A/R(combination of net and gross)/ avg daily gross patient servicerevenue
Days in A/R “Real Time”
WVU Medicine KPIsMap Key:Aged A/R as a Percentage of Billed A/RPurpose: Trending indicator of receivable collectabilityValue: Indicates revenue cycle's ability to liquidate A/REquation:N: 90, 120 daysD: Total billed A/R We used Aged A/R as a % of Discharged A/R – insurance only
Aged A/R 90 Days
WVU Medicine KPIsMap Key:Aged A/R as a Percentage of Billed A/R byPayer GroupPurpose: Trending indicator of receivable collectability by payer groupValue: Indicates revenue cycle's ability to liquidate A/R by payer groupEquation:N: Billed payer group by aging 90, 120 daysD: Total billed A/R by payer group We used discharged A/R 90 days / Total discharged A/R for payergroup
Aged A/R Change by Payer Group
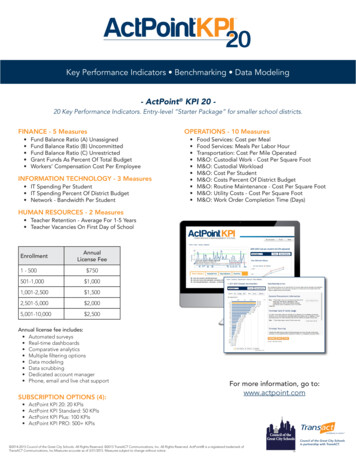
Calculation of “Real Time” A/R Daysand Aged A/R from ATBFinancial ClassCommercialMedicareMedicaidSelf-payWorker's CompOtherBlue Cross/Blue ShieldOther Gov'tPEIAPEIA MCMEDICARE ADVANTAGEMEDICAID MCPENDING MEDICAIDOutsourced - InsuranceOutsourced - Self-payUndistributedOpen 2,512,244 7,811,683 7,807,277 970,064 11,887 0 2,256,570 554,267 852,132 113,996 2,950,524 12,765,948 14,090 779,976 0 0TotalsTotals Without Self Pay0 to 30 9,776,649 22,994,350 7,816,647 1,056,770 10,317 56,737 19,883,590 2,992,822 5,086,164 628,975 8,498,666 11,166,951 693,052 4,583,853 370,249( 172,700)31 to 60 3,937,131 4,802,322 4,625,953 719,476 0 78,505 7,900,933 1,775,713 1,195,287 331,091 1,872,058 3,091,200 706,462 3,590,764 1,688,645( 156,061)61 to 90 2,951,925 1,885,584 1,428,010 604,456( 2,226) 78,390 2,919,348 1,048,417 380,650 69,465 814,132 1,517,973 295,797 1,568,478 2,218,059( 78,487)91 to 120 1,135,446 912,780 628,759 118,543 3,394 16,645 1,293,775 546,349 123,654 9,062 351,729 1,531,897 26,091 1,511,707 2,149,795( 73,847)121 to 180 1,294,156 364,489 869,739 203,776( 2,074) 46,503 1,132,633 535,900 88,269 5,138 761,958 2,013,784 35,143 1,893,022 2,209,736( 50,892)Over 180 1,218,275 925,459 1,181,199 381,063( 34,220) 104,548 244,209 542,098 19,915 217,597 1,085,095 1,223,592 24,789 2,243,782 3,677,409( 69,270)Totals 22,825,826 39,696,667 24,357,584 4,054,148( 12,922) 381,329 35,631,057 7,995,566 7,746,070 1,375,323 16,334,162 33,311,345 1,795,426 16,171,582 12,313,892( 601,256)Billed AR 90DaysTotal Billed AR % of Billed AR 90(Numerator) (Denominator) Days by Payer Group 2,670,617 33,374,4888.0% 39,400,658 95,443,093 36,159,478 17,699,970 10,285,778 11,401,279 12,985,542 223,375,798 34,672,599 183,975,14018.8% 38,416,504 93,323,022 33,044,895 14,581,658 25,846,254 166,795,82915.5%90 Day Average Daily Revenue* 7,991,349 8,952,624 8,902,281 205,212,332 5,581,055"Real Time" Days in A/R - For trending and internal comparison only* Gross Revenue from last 3 months of financials40.0
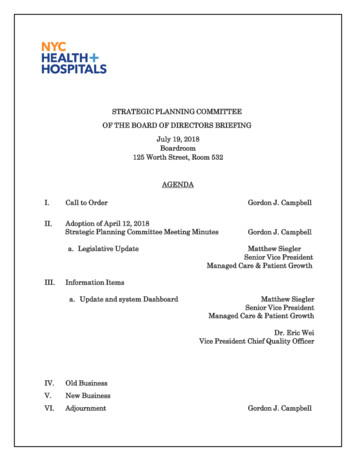
4025.00%3520.00%3015.00%2510.00%205.00%AR DaysAged 90 R Days 90 Days Goal – Facility 14530.00%Start of 90 Day ReductionInitiative
A/R Days 90 Days Goal – Facility 250.035.0%Start of 90 Day ReductionInitiativeAR DaysAged 90 0
A/R Days 90 Days Goal – Facility 335.024.0%Start of 90 Day ReductionInitiative33.023.0%AR DaysAged 90 eb-1422.0%Jan-1431.0
Coding/Outstanding Insurance –Facility 8.03.517.03.0Jan-15 Feb-15 Mar-15 Apr-15 May-15 Jun-15Uncoded AccountsJul-15Aug-15 Sep-15 Oct-15 Nov-15 Dec-15Outstanding Insurance
Example 2COMPARING ACROSS FACILITIESON DISPIRIT SYSTEMS
“Everything must be made as simple aspossible. But not simpler.”Albert Einstein
Example – Total A/R acility3AR DaysFacility4Facility5
WVU Medicine KPIsNet Days in Accounts Receivable Some facilities track this in real time using our daily dashboardSystem dashboard weekly and monthlyProcess differences between hospitals make comparison difficult –breakdown by bucket helps with comparisonBreakdown buckets by stage in billing process: In house (undischarged patients)Uncoded accounts (not yet final coded by HIM)DNFB (discharged but not final billed in the system)FBNS (final billed in the system, but claim not yet submitted)Open Insurance AR (billed insurance AR not yet resolved)Open Self Pay AR (billed patient AR not yet resolved)
Example – Detailed A/R DaysBy Stage in Billing y2In HouseUncodedFacility3DNFBFBNSFacility4Ins ARSP ARFacility5
Example – Detailed A/R DaysBy 0Over 180
Example – Detailed A/R DaysBy Aging (without Self nFacility20-3031-6061-9091-120Facility3121-180Over 180
Example Dashboard
Example Dashboard
WVU Medicine Sample KPIsBillingVendor ManagementPatient AccessDays in AR (without self pay andcredit balances)Liquidation Rates (Early Out, BadDebt)ED Copay CollectionsAged AR 90 Days (without selfpay aged by discharge date)Net Collections (Net of fees) andPlacementsPatient Estimates DeliveredDenial Write OffsConversion Rate (MedicaidEligibility)IMMs DeliveredInitial Denial Rate (New)Call Volume (Early Out)Authorizations Received (comingsoon)Claims with Open DenialsCost per Transaction(clearinghouse, billing edits)Denials by owning area (comingsoon)Credit BalancesClaim Errors (Part of DNFB)DNBs and Stop Bills (Part ofDNFB)FBNS
KPIs: Metrics and Tools, How andWhere to BenchmarkQuestions?
May 19, 2016 · We used discharged A/R 90 days / Total discharged A/R for payer group . Aged A/R Change by Payer Group . Calculation of “Real Time” A/R Days and Aged A/R from ATB Financial Class Open 0 to 30 31 to 60 61 to 90 91 to 120 121