Transcription
Featured in Balancedalanced Scorecard Master GroupSCOORRECARD AND KPIS 101Today we won’t talk about strategy, objectives and improving ultimate business performance. Questions that Ireceive often indicate that sometimes it worth returning back tto thee basics. Today, I suggest you pass a“Scorecard and KPI 101″″ course. “101″ normally means an introductory level of learning, in our case it mightbe a little bit more advanced, as I assume that my readers already have some developed background in thefield of business scorecards and KPIs.KPIs, indicators, metricsFrom the business viewpoint it doesn’t make senseto call something “KPI” until a business context isdefined. Still, in this article I’ll be using the “KPI”term as it is more popularized. The better ideawould be to avoid the “KPI” term and use just“metric”ric” or “indicator” instead. These aspects werediscussed in details in one of the previous mastergroup issues.WHAT PROBLEMS ARE KPISIS AND ASCORECARD SUPPOSED TOO SOLVE?Indicators are numerical values that are linked tosome kind of process. In simple words, theirprimary goal is to show a number that can give usan idea about the current performance of theprocess. We can group these indicators andcalculate their aggregatedated values, and in this casewe are talking about a scorecard.Here is the list of the areas where an indicator and ascorecard can be applied.On indicator level: Show the current value of an indicator. Introduce the performance function of anindicator, e.g. higher value means higherperformance or higher value means lowerperformance. Interpret the value of an indicator on abaseline/target scale, e.g. calculate the progress inimproving the value of the indicator.On scorecard level: Group indicators intoicategories. Specify therelevant importance of the indicator compared toother indicators. Calculate the performance of category andthe total performance by taking in an account theperformance values and weights of the indicators.Let’s review these ideas from basics to thecalculation of the total performance index.THE VALUE OF AN INDIINDICATORLet’s start with simple examples of indicators’values: 530 - ”530″″ is a numeric value and “ ” is ameasure unit. 20 hours/week - ”20″ is a numeric value and“hours/week” is a measurement unit.What if an indicator doesn’t have a numeric value,but we still want to use it? For example: when wedeal with an expert opinion, one needs to come upwith a way to quantify it.it Instead of answering aquestion, the expert is supposed to choose one ofthe options associated with a numeric value.THE ROLE OF THE PERFORMANCEPERFFUNCTIONThere is one important idea in the previousparagraph: each indicator has its own measurementunits. On the scorecard we cannot deal directly withincomparable measurement units like “ ” and“hours/week.” But we can come up with amathematical function that will put variousindicators on the same scale. I’m talking aboutthe performance function for an indicator.What actually the value “530 ” means? Is it a highvalue or low value? We cannot answer theseBalanced Scorecard Master GroupCopyright BSC Designer1
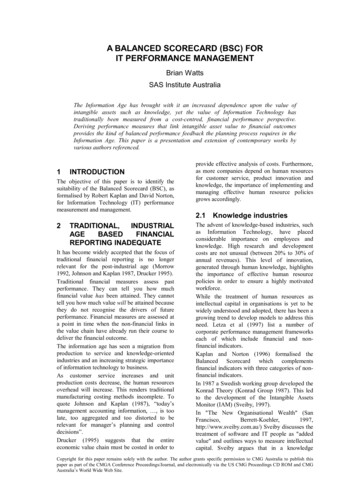
Featured in Balancedalanced Scorecard Master Groupquestions until we have a measurement scale. Let’screate it: Min – means the minimal possible value ofan indicator Max – means the maximal possible valuevofan indicatorFor example:The performance function is not always linearThe formula that was introduced above is a linearfunction. It means that with a linear growth of the“value” the performance will also grow linearly. Thisis the most frequent case for a performancefunction, but there might be other performancefunctions as well.Balanced Scorecard Master GroupCopyright BSC Designer If min 0 and max 600 then we can saythat an indicator with the value 530 actually tellsus that we are doing well!The performance of an indicator can be calculatedas: Performance (Value), % ((Value – Min) /(Max – Min)) * 100%In our example the performance will be (530 – 0) /(600-0) 88%For example, the performance might grow veryslowly in the beginning, but then increase rapidly.The performance function in this case might besomething like this: Performance (Value), % Power(Value,10)/ Power(Max, 10)2
Featured in Balancedalanced Scorecard Master GroupBefore we were talking only about the performancethat grows with the increase of the value, but itmight be decreasing as well. For example, the morewaiting time there is in the support center, thelower is its performance. In this case the linearperformancemance function will look like this: Performance (Value), % ((Max – Value) /(Max – Min)) * 100%This might sound a little bit complicated to do if youuse MS Excel or similar software, but a professionalscorecard software, like BSC Designerwill automate these tasks for you.CALCULATING THE PROGRESSPROGSometimes it is necessary to focus attention on avery specific part of the performance interval, whichis important for the current business task.For example, the support center of a company usesan “Average email response time” indicator. The MinBalanced Scorecard Master GroupCopyright BSC Designercan be 0, and the Max can be 72 hours. Currently, acompany answers most questions within 48 hours.According to these numbers the companyperformance is on a good level.Let’s continue with a case: according to theinformation from the latest studies,studies “queries fromonline prospects that were answered within an hourhouwere seven times more likely to generate a qualifiedlead.” Managers decided to decrease average emailresponse time. For their planning horizon they havea starting point (baseline), which is 48 hours, andthey have a destination point (target) which is 1hour. But the performance function doesn’t takethese values into account.For this purpose one could introducea progress function, which will be very similar tothe performance. The new function actually will usethe same mathematical function as it wasw used forthe performance function, but it will use it on adifferent scale. Compare:3
Featured in Balancedalanced Scorecard Master Group Performance (Value), % ((Max – Value) /(Max – Min)) * 100% Progress (Value), % ((Value – Baseline) /(Target – Baseline)) * 100%Both functions indicate that the performance willincrease with the decrease of the response time.What will happen to the performance and progresswhen a company has a response time equal to 38hours? Let’s calculate: Performance (38 hours), % ((72 – 38) /(72 – 0)) * 100% 47%If you will calculate the performance and theprogress for the value 1 hour (specified target wasachieved), thenen for the progress it will be 100% (weneed to define this point manually to avoid divisionby zero) and the performance will be 98%.In terms of the “performance” there is a space for afurther 2% improvement, but in terms of theBalanced Scorecard Master GroupCopyright BSC Designer Progress (38 hours), % ((38 – 48) / (1 –48)) * 100% 21%As you can see we need both: performance andprogress functions, as they actually tell us adifferent story about an evaluation process: “Min” and “Max” are used to calculatecatheperformance of the KPI. The performance answersthe question: “What is the overall performance ofthe KPI?” “Baseline” and “Target” are used to calculatethe progress. The progress answers the question:“To what extent was the target achieved?”“progress” that reflect a business sense, the targetwas achieved.SCORECARD LEVEL – THE RELEVANTIMPORTANCE OF KPISAnother challenge that was mentioned above is thatwe need to specify the relevant importance of a KPIin some way. For example, a support center has twoKPIs:4
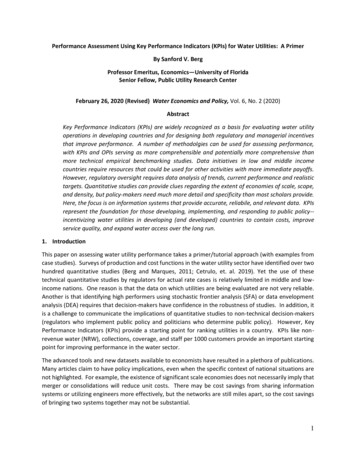
Featured in Balancedalanced Scorecard Master Group “Averageerage email response time,” hours “First contact resolution rate,” %A company can make ”Average email responsetime” equal to 10 minutes, but this will not makecustomers happy, as the “First contact resolutionrate” will be very low. Good response time isimportant, but what is more important is the highquality of the answers.swers. To reflect this idea we needto introduce a concept of “weight” to the indicator. “Average email response time,” hours;weight 4 “First contact resolution rate,” %; weight 6Now we know that “First contact resolution rate” ismore important than “Average email responsetime.” To simplify future calculations we will defineweight on the scale from 1 to 10 and we will requirethat the sum of all weights has to be 10.If you use some software like BSC Designer for yourbusiness scorecard then most likelyikely it will suggestmore flexible settings for the weight and you willavoid unnecessary math exercises.CALCULATING THE TOTALTOTAPERFORMANCEWe know the performance of each indicator in thescorecard. Also, we know the relevant importance(the weight) of eachach indicator compared to therelevant importance of other indicators in thecategory. The performance of a category can becalculated by taking in account the performancevalues of each indicator and their weights.In the same way the total performance of thescorecard can be calculated. It will incorporate theperformance of all indicators taking into accounttheir relevant weights and the relevant weights oftheir categories.THE BUSINESS MEANING OF THE“TOTAL INDEX”Below you will find formulas that helphel to do all ofthese calculations. Before talking aboutmathematics, I’d like to discuss the business senseof calculating this total performance value.Actually it is still disputable. Some say that theyneed to have “a number” that is supposed to reflectthe current performance of the company. Anopposite argument is that this aggregated index willbe too complex to possibly give any meaningfulinformation.It might be hard to find the business meaning of thetotal scorecard index, but for sure, it makes senseto calculate the performance of specific categories.As in an example above, the performance level ofthe “Customer support” category has two weightedindicators: ”Average email response time” and ”Firstcontact resolution rate” that will actually showshifcustomer support does a good jobbalancing responses’ quality and response time.HOW THE SCORECARD PERFORMANCEPERFORMANCE IS CALCULATEDCALCULANow, let me show the math that stands behind the calculation of the total performance.Here we have the structure of the scorscorecard where C1.4 – are categories. Metric-i,jMetricare our indicators togetherwith their weight and performance values:Balanced Scorecard Master GroupCopyright BSC Designer5
Featured in Balancedalanced Scorecard Master GroupLet’s convert this into a different notation:We had our weight on a scale 1.10, so beforebefore moving ahead we need to calculate a normalized weight:The total performance value for the selected category is be calculated as:Where Ni is the number of metrics on i-level;iNWi,j – is a normalized weight of j-metricmetric on i-level;iNSi,j – is aperformance of j-metric on i-level.To calculate the total performance within all categories, it’s necessary to summarize performance values for alllevels:Where M is a number of categories. The final formula for the total performance index of the scorecard will be:These calculations are simple if you don’t have subcategories in your scorecard. If you had subcategories, theweight of these subcategories should be taken into account in a similar way. Professional scorecard softwarelike BSC Designer will automate thesee calculations so that you can focus on the business side.What is your experience with scorecards? Do you think it is only googoodd as an academic exercise? Whattasks does a scorecard help to solve in your business?Balanced Scorecard Master GroupCopyright BSC Designer6
"Scorecard and KPI 101 ″ course. "101″ normally means be a little bit more advanced, as I assume that my readers already have some developed background in the field of business scorecards and KPIs. KPIs, indicators, metrics From the business viewpoint it doesn't make sense to call something "KPI" until a business context is defined.