Transcription
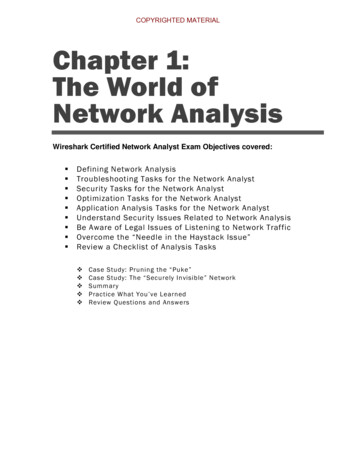
Report – RIIO-ED1 Network Performance Summary 2019-20IntroductionThis report presents a summary of the Electricity Distribution Network Operators’ (DNOgroups) output delivery and financial performance through RIIO-ED1 in the following areas:1. Delivery against output targets in 2019-2020;2. Expenditure in cost categories, the key drivers of any under/over spend againstallowances and forecast spend across the RIIO-ED1 price control to date.3. Latest estimates of Rate of Return on Regulated Equity (RoRE) based on forecast outturn performance; and4. An estimate of the average customer bill impact.Key messagesAnnual outputs: All DNO groups continue to perform strongly against output targets and are ontrack to meet or exceed these by the end of RIIO-ED1.RIIO-ED1 performance: In 2019-2020, three of the six DNO groups overspent against theirannual allowance however, to date, only one DNO group has overspent against their allowance. TwoDNO groups expect to meet or exceed their allowance over the whole of RIIO-ED1.RoRE: DNO groups’ RoRE ranges between 7.4% and 9.5% over the RIIO-ED1 period.Customer bill impact: Based on estimates, the average GB customer in 2020-2021 will pay 93per year in real 2019-2020 price terms for electricity distribution costs.Background to RIIO-ED1DNOs are responsible for carrying work,connectedtoandtheirnetwork, to network users. The six DNOgroups and the areas in which they operateare shown on the map.To ensure value for money for consumers,Ofgem regulates DNOs through periodic pricecontrols. The price controls we set determinethe amount of revenue DNOs can earn, andspecify the levels of performance we expectDNOs to deliver.2
Report – RIIO-ED1 Network Performance Summary 2019-20The report covers the period up to 31 March 2020 when the full impact of the Covid-19pandemic were yet to be experienced. Nonetheless, we would like to acknowledge thecollaborative arrangements that were put in place from March 2020 across all the energynetworks to tackle the pandemic. These arrangements helped to maintain security of supplyand high levels of system reliability, deliver essential services to consumers, while alsoensuring safety for all.1. Outputs and IncentivesAnnual output targets apply in four areas (connections; social obligations and customerservice; reliability and availability; and environment) where performance can result inincentive rewards (or penalties under certain output areas). There is also a fifth output area,safety, which does not have an annual target; however DNO groups are required to complywith legislation set out by the Health and Safety Executive (HSE).DNO group performance for each output is summarised below.ConnectionsIn 2019-2020, there continues to be an overall improvement under the Time to Connect(TTC) Incentive compared to 2018-2019, with the majority of DNO groups outperformingtheir annual target. Under the Incentive on Connections Engagement (ICE), no penaltieswere applied in 2019-2020 as we were satisfied with the performance of all DNO groups. AllDNO groups also met or exceeded the annual report target for Connections GuaranteedStandards of Performance (GSoP) and received a green RAG status.11Red, Amber and Green (RAG) ratings are not a measure of performance but an indication of whether the DNO is on trackto meet certain objectives.3
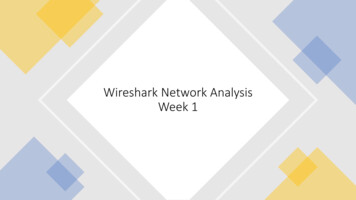
Report – RIIO-ED1 Network Performance Summary 2019-20Figure 1: Average Time to Quote & ConnectAverage time to quote and connect80.070.0Working 16-172017-18UKPN2018-19SPENSSE2019-20Social Obligations and Customer ServiceAll DNO groups met or exceeded the Customer Satisfaction Survey (CSS) targets, buildingon their performance in RIIO-ED1 to date. The industry average score is now 9.0 out of 10.Most DNOs outperformed the targets on complaints where four DNOs did not improve ontheir previous year’s performance (SWALES, SWEST, SSEH and SSES). Only one DNO group(NPg) decreased their score under the Stakeholder Engagement and Consumer Vulnerability(SECV) Incentive; the remaining four DNO groups that were assessed achieved higher scoresthan they did in 2018-2019.2The customer satisfaction scores across all DNOs have increased in 2019-20. The combinedreward received by DNO groups under the three components of the Broad Measure ofCustomer Satisfaction (CSS, SECV & complaints) this year was 60.6m.2The minimum requirements assessment for WPD was deferred in light of the opening of anenforcement investigation into its compliance with obligations relating to the Priority Services Register(PSR). The 2019-20 Stakeholder Engagement Panel Report sets out further details on the treatment ngagement-panel-2019-204
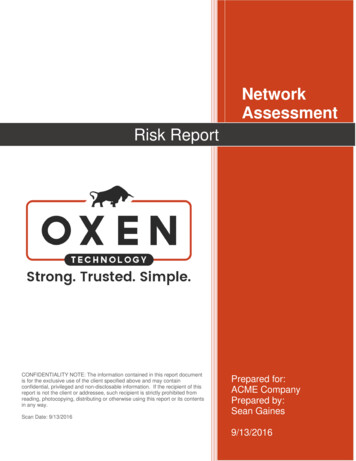
Report – RIIO-ED1 Network Performance Summary 2019-20Figure 2: Annual Customer Satisfaction Score by DNO groupAverage Customer Satisfaction score by DNO Reliability and AvailabilityAll individual DNOs met their Interruptions Incentive Scheme (IIS) targets for unplannedinterruptions in 2019-2020. Over RIIO-ED1 to date, customer interruptions have fallen by19% whilst the duration of interruptions has reduced by 15%. Based on their performanceagainst the annual targets, DNO groups earned 160.4m under the IIS in 2019-2020 whichis comparable with their performance for 2018-2019 ( 146.3m).5
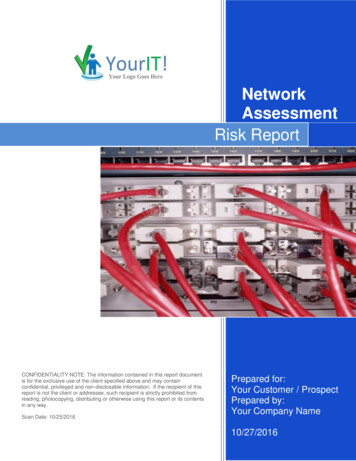
Report – RIIO-ED1 Network Performance Summary 2019-20Figure 3: Annual Interruption Incentive Scheme performance by DNO group(Planned and Unplanned)Customer Minutes Lost70.060.060.050.050.040.0MinutesInterruptions per 100 customersCustomer LNPGWPDCI PerformanceUKPN SPENSSECI TargetENWL NPG WPD UKPN SPENCML PerformanceSSECML TargetIn 2019-2020 DNO groups: Spent 151m on resilience, bringing the total spent to date over RIIO-ED1 to 733m(under the allowance to date of 795m); Spent 1.96m improving service provision for the worst-served customers; and Paid out just under 2.36m for failing to meet minimum levels of service under theGuranteed Standards of Performance (GSoP).All individual DNOs continue to make progress towards meeting their targets under NetworkAsset Secondary Deliverables, and have delivered levels of monetised risk as a percentageof their target between 58% (NPgY) and 89% (WMID).EnvironmentIn 2019-2020, DNOs’ Business Carbon Footprint (excluding losses and contractors)decreased by 7.9% from 2018-19 and, since the start of RIIO-ED1, by 49.2%. Reportedlevels of sulphur hexafluoride3 emissions fell by 6.7% this year and there was a reduction intotal oil leakage from fluid filled cables. No award was allocated under the Losses3Sulphur hexafluoride is a gas used to insulate high-voltage circuit breakers, switchgear, and other electrical equipment. Itis an inorganic, extremely potent greenhouse gas.6
Report – RIIO-ED1 Network Performance Summary 2019-20Discretionary Reward (tranche 2)4 as no DNO demonstrated sufficient progress to merit areward.SafetyDNOs continue to comply with the legislation enforced and regulated by the HSE. Overall,DNO groups continue to perform well in this area and respond appropriately to notices issuedby the HSE.2. InnovationThe Network Innovation Allowance (NIA) is designed to fund smaller scale research,development and demonstration projects. Each individual DNO receives an allowance forinnovation projects in line with the NIA Governance Document. In 2019-2020 DNO groupsspent 24.8m (83% of that year’s allowances), which was an increase on the 21.5m spentin 2018-2019 (74% of that year’s annual allowances). If successful, innovation projects willbring a variety of financial, operational, environmental and safety benefits.The Network Innovation Competition (NIC) is an annual competition that provides funding toa small number of large-scale innovation projects. The aim is to encourage DNO groups toinnovate in the design, build, development and operation of their networks. These projectswill generate learning for all DNOs and will also be made available to interested third parties.In 2019-20 two distribution projects received a total of 14.4m funding from NIC.5In 2019-2020, ENWL successfully applied for funding under the Innovation Roll-outMechanisms to fund the roll-out of their “Smart Street” project that will have financial netbenefits for consumers of 44.0m by on-tranche-two-20185Further information is available in the project documentation published on our innovation-roll-out-mechanism7
Report – RIIO-ED1 Network Performance Summary 2019-203. Totex Performance and DriversNetwork companies are incentivised to outperform their RIIO-ED1 totex allowance. Throughthe totex incentive mechanism (TIM), any underspend compared to the totex allowance isshared between the individual DNO and its customers. The efficiency sharing rate issymmetrical for any overspends: the network company is exposed to any shortfall and theremainder is passed onto customers by increasing allowances to be recovered throughnetwork charges. DNO group performance against totex (and the associated sub-categories),as well as the customer bill impact and Return on Regulated Equity (RoRE),7 is summarisedbelow.TotexPerformance on totex varies across DNO groups, with the majority underspending to date;performance to date ranges from a 3% overspend to a 15% underspend (see table 1). FourDNO groups currently anticipate an underspend across RIIO-ED1 (ranging from 0% to -12%).Through the TIM customers will receive 412m of the 937m underspend to date.The combined value of total expenditure for the DNOs over RIIO-ED1 is currently forecast tobe 28.6 billion; an overall forecast underspend of 3% (See table 2).Table 1: DNO group cumulative expenditure against allowance to date m, 2019-2020 prices7(Cumulative to date – 2015-16 to 2019-20)AllowanceExpenditureDifference m m %SSEN2,7902,728-63-2%Total18,97218,035-937-5%The financial return achieved by shareholders in a licensee during a price control period from its out-turnperformance under the price control.8
Report – RIIO-ED1 Network Performance Summary 2019-20Table 2: Forecast DNO expenditure against allowance across RIIO-ED1 m, 2019-2020 pricesCurrent RIIO-ED1 company forecastAllowanceExpenditureDifference m m SEN4,3834,362-200%Total29,57828,629-949-3%Total Load Related costsOverall spend to date under this category is significantly under allowance (-39%).Expenditure on reinforcement is around 48% less than the allowance to date across all DNOs.Drivers for this underspend include: economic conditions creating uncertainty in demand forelectricity; schemes that have been deferred or cancelled in response to consumersrequirements; and an increase in energy efficiency measures and innovative solutions usedby DNOs. All of these factors have deferred the need to invest in the network.The combined value of load related expenditure for the DNOs over RIIO-ED1 is currentlyforecast to be 2.21 billion: an underspend of 29%. We expect this underspend to decreasein the remaining years of RIIO-ED1 due to increase demand for Electric Vehicles (EVs) andheat pumps.Non-Load Related CapexAsset Replacement and Refurbishment: To date, all DNO groups have underspent onreplacing and refurbishing equipment at an average of 19%. The main drivers behind theunderspend include: schemes/projects being delayed or deferred; negotiating contracts withcommercial incentives to deliver efficiencies; IT Transformation Progammes and innovativetechniques being used to minimise costs.Other non-Load Related Capex: To date spending in these areas across all DNOs is around8% less than the allowance. Four DNO groups have underspent and two have overspent.UKPN have the largest underspend (26%), whilst ENWL have the largest overspend (26%).9
Report – RIIO-ED1 Network Performance Summary 2019-20ENWL’s overspend is largely due to a result of investment in IT enabled business change andtechnology refresh, and improving cyber resilience.The combined spend on non-load related capex for all DNO groups across RIIO-ED1 isforecast to be 8.82 billion: an underspend of 12%.Network Operating Costs (NOCs)DNO groups have collectively overspent on NOCs by around 9% to date. The main areas ofexpenditure under this category are Faults (17% overspend to date), Tree Cutting (7%underspend to date), and Inspections and Maintenance (9% overspend to date). The maindriver of overspend on Faults has been on responding to faults caused by extreme weatherconditions (for example, high winds, floods and high ambient temperature).The combined spend on NOCs across all DNO groups over RIIO-ED1 is forecast to be 6.65billion: an overspend of 10%.Operational Support Cost/Closely Associated Indirects (CAIs)Five DNO groups have overspent on allowances for operational support to date; one of thoseby more than 25% (SPEN). DNOs have invested in operational support to achieve wider totexefficiencies which, combined with the tight price control settlement, has made it difficult toachieve cost efficiencies in this category.The combined forecast spend on CAIs across RIIO-ED1 is 6.39 billion: an overspend of 12%.Business Support Costs (BSC)Two DNO groups have overspent their allowance on business support costs over RIIO-ED1;one by more than 50% (SPEN). The main driver for overspend is higher costs than thoseforecast at the start of RIIO-ED1. Underspend in other DNO groups is partly due to thephasing of expenditure over the price control period, and efficiencies due to an increasedfocus on digitalisation with IT infrastructure upgrades.The combined spend on BSC across RIIO-ED1 is forecast to be 3.19 billion: an overspendof 3%.10
Report – RIIO-ED1 Network Performance Summary 2019-20Figure 4: Six largest cost categories: Underspend and overspend to date 8Underspend to date ( 1,694m)Overspend to date ( 834m)BusinessSupport, 16mOtheroperationalcapex,- 62mReplacing &refurbishingequipment,- 896mNetworkReinforcement,- 736mNetworkFaults, 378mOperationalSupport, 440mCustomer bill impactOur Tariff methodology provides an estimate of the overall cost of domestic energy bills. Thisincludes estimates of the proportion of the overall cost of energy which is attributable toelectricity distribution costs. The methodology uses an average electricity demand applieduniformly across all regions and over time.Our latest bill assessment using this methodology estimates that the average GB customerin 2020-21 will pay 93 per year in real 2019-20 price terms for electricity distribution costs.Charges differ considerably depending on the region in which a domestic consumer resides:ranging from 71 in Southern to 135 in the North of Scotland.4. Rate of Regulatory Return on Equity (RoRE)RoRE is made up of several components. The allowed equity return is the return on equitythat a company would earn if their expenditure and allowance matched and there were noother incentives. Operational performance (totex) compares the totex allowance to acompany's actual totex expenditure and any underspend or overspend is then sharedbetween the company and consumer through the Totex Incentive Mechanism. Operationalperformance (other) accounts for a company's overall incentive performance. Putting these8This is the collective industry picture of spend. It does not necessarily reflect the expenditure pattern for individual DNOs.11
Report – RIIO-ED1 Network Performance Summary 2019-20three component parts together produces operational RoRE. Financing and tax performanceis added to produce total RoRE.We have calculated a current RoRE range between 7.4% and 9.5%. This is based on ourown assessment of the value of DNO groups’ current forecast performance at the end ofRIIO-ED1. A summary of our assessment of the DNO groups’ RoRE performance is shown infigure 5 (comparing this year to last year) and table 3 below.Figure 5: RoRE based on Notional Gearing – RIIO-ED1 periodRoRE based on Notional Gearing - RIIO-ED1 %2018 2019 2020 2018 2019 2020 2018 2019 2020 2018 2019 2020 2018 2019 2020 2018 2019 2020ENWLNPgSPSSEUKPNAllowed Equity Return IQIOperational performance - TotexOperational performance - otherFinancing and tax performanceOperational RoRETotal RoRE - with financing and taxWPDAccompanying this report is a regulatory financial performance annex that sets out ourassessment of DNO groups’ regulatory financial performance. Our assessment is based oninformation the companies have submitted to Ofgem using the new regulatory financialperformance reporting (RFPR) process.Table 3: RoRE based on Notional Gearing – RIIO-ED1 period based on 2019/20RFPR submissionsENWLNPgSPSSEUKPNWPDRIIO-ED1 operational RoRE10.3%8.2%6.1%7.3%9.8%9.7%Financing and tax performance-2.0%-0.8%1.5%0.1%-0.3%-2.0%Total RoRE8.4%7.4%7.6%7.4%9.5%7.7%12
Report – RIIO-ED1 Network Performance Summary 2019-20 The report covers the period up to 31 March 2020 when the full impact of the Covid-19 pandemic were yet to be experienced. Nonetheless, we would like to acknowledge the collaborative arrangements that were put in place from March 20