Transcription
Class #17: Statistical Analysis and Rectangular MatricesPurpose: The objective of this experiment is to familiarize yourself with common statistical analysis terms andrevisit linear curve fitting with multiple inputs.Background: Before doing this experiment, students should be able toAnalyze simple circuits consisting of combinations of resistors.Apply Ohm’s Law to determine current from voltage measurementsMake differential voltage measurements using M1K board and Alice tools.Invert a matrix and perform matrix multiplicationUse Matlab to perform linear regression and matrix manipulationReview the background for the previous experiments.Learning Outcomes: Students will be able toUnderstand the properties of Gaussian distributionsUse statistical parameters to determine the quality of their least squares curve fittingUse matrix mathematics to determine a linear fit for multiple input variablesEquipment Required:M1K board (with Alice tools) or Analog Discovery (with Waveforms Software)Voltmeter tool (Alice)Meter-Source tool (Alice)Parts kitMatlabKeywords:HistogramMeanStandard DeviationMedianCorrelation CoefficientHelpful links for this experiment can be found on the course website under Class #17.J. Braunstein, M. HameedRensselaer Polytechnic Institute-1-Revised: 27 October 2021Troy, New York, USA
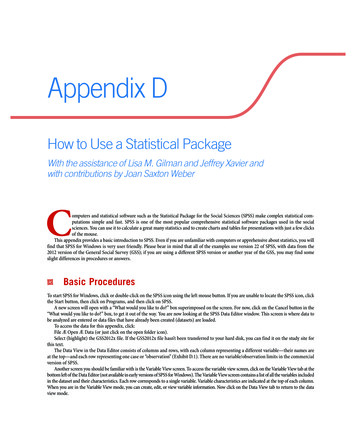
Part A – Statistical Analysis (Gaussian and Uniform Distribution)BackgroundIn the last experiment, we looked at fitting a linear approximation to data. In this experiment, we will look at a moregeneral discussion of data distributions and then revisit the data from last experiment. To start off, we can consider avery common data distribution called the Gaussian distribution (Gaussian function). This distribution is one we seefrequently when discussing test grades. Mathematically, we can represent the Gaussian distribution asx x1f x22 e222OHmeanofstdcx )(x ) var µ(X ).where x is the mean (average), which we used in experiment 16 (previous class) when determining the slope andintercept of the least squares fit, andis the standard deviation. The standard deviation is a measure of how ‘spreadout’ the distribution appears. Considering the following two figures, Figure A-1 is an example of ‘wide’ Gaussiandistribution with a ‘larger’ standard deviation and Figure A-2 is an example of a ‘narrow’ Gaussian distribution witha ‘smaller’ standard deviation. We can clearly see that a smaller standard deviation looks much ‘narrower’. Asmentioned above, this type of distribution is commonly associated with grades, where the mean is average assignedgrade (C range perhaps) and a positive standard deviation would be one letter higher (B range perhaps). A negativestandard deviation would be one letter grade lower (D range perhaps). Figures A-1 and A-2 are continuous plots,where the input can be any real value between 0 and 100, not just integers. When we consider data gathered, ourmeasurements from last experiment as an example, the data set is then discrete. We can fit a Gaussian curve to thatdata, using a procedure similar to the least squares operation in the last class. Another approach is to use a histogram,which counts the frequency of data points within a range of values. This type of plot is especially useful whenconsidering a data set that is integers. Again, using grades as an example, Figure A-3 is a histogram plot of examgrades. Observationally, we can see that the data is approximately Gaussian. Discrete data analysis (matrix analysis),indicates that the mean is 64.9 and the standard deviation is 16.2. If we implement curve fitting, the plot in Figure A3 would be very close to the Gaussian fit.t.inAmplitudemmfmfnm* PDF f.TimeVariance Cstd)"PDF /-00'-7Figure A-1: Gaussian Distribution, Mean 55, Std. Dev. 15 (largish)J. Braunstein, M. HameedRensselaer Polytechnic Institute-2- Revised: 27 October 2021Troy, New York, USA
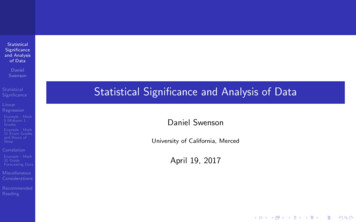
Figure A-2: Gaussian Distribution, Mean 65, Std. Dev. 15 (smallish)pa,,zECSE2410Exam IFigure A-3: Histogram of Exam grades, Mean 64.9, Std. Dev. 16.6In the case of discrete data sets, another metric of interest is the median, which is the ‘middle’ data point when sortingthe data from smallest to largest (or largest to smallest). For example, the array1 9 4 9 8 2 3After sorting, the array becomes1 2 3 4 8 9 9and the median (middle number) is 4. In general, if the data set is symmetrical, like the Gaussian distribution in FigureA-3, the median and mean are very close to each other. The median of the Figure A-3 data was 64, which is veryclose to the mean.?⃝J. Braunstein, M. HameedRensselaer Polytechnic Institute-3-Revised: 27 October 2021Troy, New York, USA
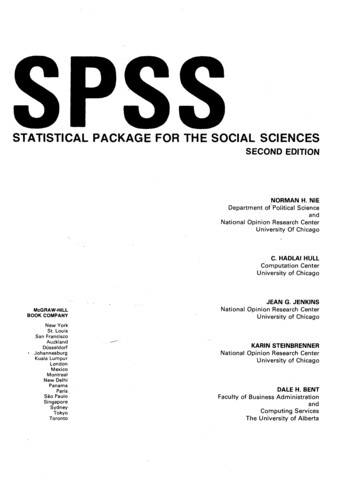
Two other common distributions are the Uniform distribution, where the frequency of occurrence is flat over therange of data. In this type, each outcome (score) is equally likely. You can see an example of that in Figure A-6. ABimodal distribution is a data set with two different Gaussian distributions. Examples are shown Figures A-7(example curve) and A-8 (real exam data). In the case of scores, instructors are frequently disturbed by Bimodaldistributions, leading to a lot of discussion about the course.Figure A-6: Example of a Uniform DistributionFigure A-7: Example of a Bimodal Distribution'8bins.y IFigure A-8: Bimodal Distribution of Exam ScoresJ. Braunstein, M. HameedRensselaer Polytechnic Institute-5-Revised: 27 October 2021Troy, New York, USA
Randinesspseudo-random.am - .
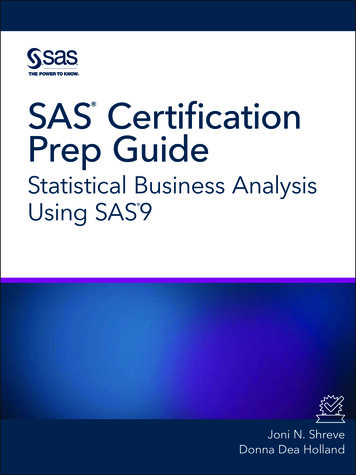
Exercise:4) Revisit the three element arrays from experiment 16 and find the correlation coefficientsa. (2,1),(3,2),(4,3)b. (1,1),(3,3),(5,2)Based on the Matlab calculations, would you characterize this data sets as linear?5) Do the same for your linear fit analysis of the experiment 5, experiment 11, Part C, and from experiment 16,Part F data. In this case, when you import the Excel data, you can use the column labels in the corrcoefcommand instead of writing the arrays directly. Using the example from experiment 16, you could write corrcoef(Vs,VR2)Again, based on the Matlab calculations, would you characterize the results as linear?Part C –Linear Approximations with Two InputsBackgroundFigure C-1: Non-linear CircuitIn Figure C-1, we see a circuit with two input voltages. This circuit is very similar to the superposition circuit seen inexperiment 11, In this case, we are going to look at the current through resistor R3. If the circuit was linear, then usingexperiment 11 concepts, we could write the current asI R3aV1 bV2where a and b are the coefficients for a linear relationship. With the LED in the circuit, the relationship is not linear,but a linear approximation may be valid. To find the coefficients a and b, we can use matrix analysis. We still want asolution to the expression,AxbAgain, we are using measured data to extract the unknown coefficients a and b. We will have multiple measurements,but only two unknowns, which means that the matrix A is rectangular, not square. Each row of A is the values of V1and V2, with the corresponding element of b being the measurement result. We need to make changes to our matrixexpression in order to find a solution. In order to make the systems square, we multiply both sides of the expressionby the transpose of AAT A xAT bThe transpose of a matrix is obtained by switching the row and column elements, an element in row i and column j isplaced in row j and column i. As an example,1 2For matrix A3 7 , with a transpose AT5 11 3 52 7 1In Matlab, the transpose command is transpose, transpose(A)J. Braunstein, M. HameedRensselaer Polytechnic Institute-8-Revised: 27 October 2021Troy, New York, USA
[ARow/I]reductionsf- la ]"2 23 32 5
?⃝[Is"""or' yInfsolutions[ f-115 25.equationunknownS.
1) Hill"" b
/ toWantsquare Ab A make2 5A) 5 2this bAT5 2ATA?⃝?⃝Ax"Atb ⑤2 5]2 2
Based on the Matlab calculations, would you characterize this data sets as linear? 5) Do the same for your linear fit analysis of the experiment 5, experiment 11, Part C, and from experiment 16, Part F data. In this case, when you import the Excel data, you can use the column labels in the