Transcription
StatisticalSignificanceand Analysisof l Significance and Analysis of DataLinearRegressionExample - Math5 Midterm 1GradesExample - Math11 Exam Gradesand Hours ofSleepDaniel SwensonUniversity of California, MercedCorrelationExample - Math32 GradeForecasting pril 19, 2017
Statistical SignificanceStatisticalSignificanceand Analysisof essionExample - Math5 Midterm 1GradesExample - Math11 Exam Gradesand Hours ofSleepCorrelationWhat is statistical significance, and why is it important?Let’s examine this with a specific example. Suppose we have two different groupsof students — say, representing different majors. In a particular course, a sample offive students from one group has the scores45, 89, 85, 68, 84and a sample of five students from the other group has the scoresExample - Math32 GradeForecasting 9, 79, 82, 76, 88
Statistical SignificanceStatisticalSignificanceand Analysisof essionExample - Math5 Midterm 1GradesExample - Math11 Exam Gradesand Hours ofSleepCorrelationExample - Math32 GradeForecasting he mean score of the first group is 74.2 and the mean score of the second groupis 82.8. This is a mean difference of 8.2, which is a fairly practically significantdifference (assuming that the scores are percentages).
Statistical SignificanceStatisticalSignificanceand Analysisof essionExample - Math5 Midterm 1GradesExample - Math11 Exam Gradesand Hours ofSleepCorrelationExample - Math32 GradeForecasting ut, could this mean difference be “due to chance”? It would be embarrassing tomake the conclusion that students with these different majors perform differentlyon the exam, if this mean difference is, in fact, just “due to chance” (i.e., just astatistical artifact).
Statistical SignificanceStatisticalSignificanceand Analysisof essionExample - Math5 Midterm 1GradesExample - Math11 Exam Gradesand Hours ofSleepCorrelationExample - Math32 GradeForecasting tatistical significance is the concept that pertains to addressing the question ofwhether or not the observed results could be “due to change.” In this case, thestatistical test that should be applied is called the t-test. It can be applied inExcel or other statistical software.
Statistical SignificanceStatisticalSignificanceand Analysisof essionExample - Math5 Midterm 1GradesExample - Math11 Exam Gradesand Hours ofSleepCorrelationExample - Math32 GradeForecasting he t-test returns a value called a p-value. Basically, the p-value is the probabilityof seeing a result as extreme as the one you actually did see, under the assumptionthat the results obtained actually are due to chance alone.In this case, the p-value of the t-test turns out to be 0.361. It is customary toclaim a statistically significant difference only if the p-value is less than 0.05; so,this result would not be considered statistically significant.
Statistical SignificanceStatisticalSignificanceand Analysisof essionExample - Math5 Midterm 1GradesExample - Math11 Exam Gradesand Hours ofSleepCorrelationExample - Math32 GradeForecasting n this example, the significance level of the test would be 0.05. A test where weconsider the result to be significant at the 0.05 level has a false positive rate of0.05 (5%). That is, 5% of such tests will be statistically significant, even if there isno true underlying relationship in the population being studied.
Statistical SignificanceStatisticalSignificanceand Analysisof essionExample - Math5 Midterm 1GradesExample - Math11 Exam Gradesand Hours ofSleepCorrelationExample - Math32 GradeForecasting ou might wonder — what would we do if we really did suspect that students withthese majors generally tend to score differently on this exam?It turns out that the p-value of the t-test is affected by three things:The difference in mean scores between the two groups;The variation within each of the two groups; andThe sample size of each of the two groups.The last one is what we have control over; so, in practice, we would sample largergroups of students and run another t-test.
Statistical SignificanceStatisticalSignificanceand Analysisof DataDanielSwensonStatisticalSignificanceIf we had three or more groups represented in our data (e.g., three or moremajors), we could use a generalization of the t-test called ANOVA (for Analysisof Variance).LinearRegressionExample - Math5 Midterm 1GradesExample - Math11 Exam Gradesand Hours ofSleepCorrelationExample - Math32 GradeForecasting imilar to the t-test, the p-value of the ANOVA is affected by three things:The variation between the groups;The variation within each group; andThe sample size of each group.
Statistical SignificanceStatisticalSignificanceand Analysisof essionExample - Math5 Midterm 1GradesExample - Math11 Exam Gradesand Hours ofSleepCorrelationExample - Math32 GradeForecasting ometimes, it’s more convenient to use special statistical software to do statisticaltests. For example, not all spreadsheet programs can easily compute a p-value for acorrelation. However, special statistical software can do this easily.One of these programs is called R. R is used widely and can be downloaded for free.In the following examples, we will make use of R (sometimes also making use of thexlsx package to import Excel spreadsheets into R).
Linear RegressionStatisticalSignificanceand Analysisof essionExample - Math5 Midterm 1GradesExample - Math11 Exam Gradesand Hours ofSleepCorrelationExample - Math32 GradeForecasting inear regression is a type of analysis that is done when trying to “describe” anoutput variable (e.g., an exam score) by some input variables (e.g., how much thestudent studied for the exam, how much they went to office hours, etc.).
Linear RegressionStatisticalSignificanceand Analysisof essionExample - Math5 Midterm 1GradesExample - Math11 Exam Gradesand Hours ofSleepCorrelationExample - Math32 GradeForecasting asically, linear regression assumes that each equal-sized change in an inputvariable (e.g., hours studied) has a corresponding constant-sized change in theoutput variable (e.g., the exam grade). The size of the change is called acoefficient in the linear regression model. Each coefficient has its own p-value.
Example - Math 5 Midterm 1 GradesStatisticalSignificanceand Analysisof essionExample - Math5 Midterm 1GradesExample - Math11 Exam Gradesand Hours ofSleepCorrelationExample - Math32 GradeForecasting xample. Math 5 Data From Fall 2016. Let’s do linear regression on theMidterm 1 data.To load the data, we use data read.xlsx("/home/daniel/Desktop/Math 5Midterm 1 Data.xlsx",1). (The path will depend on where you’ve put the file.)
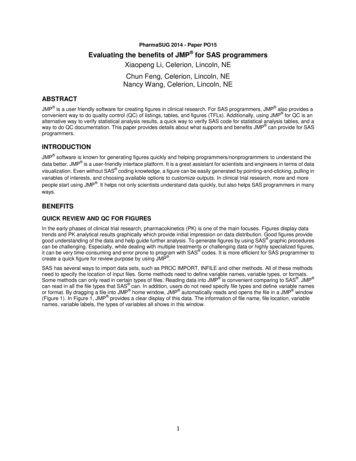
Example - Math 5 Midterm 1 GradesStatisticalSignificanceand Analysisof essionExample - Math5 Midterm 1GradesExample - Math11 Exam Gradesand Hours ofSleepCorrelationExample - Math32 GradeForecasting fter using attach(data), we usesummary(lm(Exam.One STEM PALS Clinic.Hours Hours.of.Sleep.a.Night Study)) to get the following regression table.
Example - Math 5 Midterm 1 GradesStatisticalSignificanceand Analysisof essionExample - Math5 Midterm 1GradesExample - Math11 Exam Gradesand Hours ofSleepCorrelationExample - Math32 GradeForecasting ince only Clinic.Hours (and the intercept term) is statistically significant, welook at the coefficient: 35. However, if we enter Clinic.Hours, we see that onlytwo students in this sample (of n 44 students) actually used the clinic hours; so,the statistical significance is spurious (“fake”) in this case.
Example - Math 5 Midterm 1 GradesStatisticalSignificanceand Analysisof essionExample - Math5 Midterm 1GradesExample - Math11 Exam Gradesand Hours ofSleepCorrelationExample - Math32 GradeForecasting n conclusion, this data doesn’t present any evidence that any of the factorsconsidered here are associated with the students’ exam one score. (To make surethat the lack of statistical significance isn’t just due to the sample size, we couldconsider a similar set of data with a larger sample size.)
Example - Math 11 Exam Grades and Hours of SleepStatisticalSignificanceand Analysisof essionExample - Math5 Midterm 1GradesExample - Math11 Exam Gradesand Hours ofSleepCorrelationExample - Math32 GradeForecasting xample. Math 11 Exam Grades and Hours of Sleep. Let’s now look at thesummer 2016 data regarding Math 11 exam grades and hours of sleep, which canbe loaded in a similar way to the previous dataset.
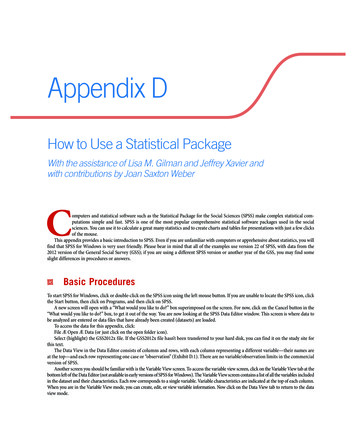
Example - Math 11 Exam Grades and Hours of SleepStatisticalSignificanceand Analysisof essionExample - Math5 Midterm 1GradesExample - Math11 Exam Gradesand Hours ofSleepCorrelationExample - Math32 GradeForecasting he command summary(lm(Grade Sleep)) gives a p-value of 0.608, which isnot statistically significant. So, no statistically significant association is observed inthis sample between the student’s exam grade and the number of hours of sleepthey get each night.
Example - Math 11 Exam Grades and Hours of SleepStatisticalSignificanceand Analysisof essionExample - Math5 Midterm 1GradesExample - Math11 Exam Gradesand Hours ofSleepCorrelationExample - Math32 GradeForecasting his is also evident in the plot formed by plot(Sleep,Grade).
CorrelationStatisticalSignificanceand Analysisof essionExample - Math5 Midterm 1GradesExample - Math11 Exam Gradesand Hours ofSleepCorrelationExample - Math32 GradeForecasting DataMiscellaneousConsiderationsRecommendedReadingA correlation is a quantity that can be computed to see if these is an associationbetween two variables. It has its own p-value. The correlation of two quantities isalways a number between 1 and 1.
Example - Math 32 Grade Forecasting DataStatisticalSignificanceand Analysisof essionExample - Math5 Midterm 1GradesExample - Math11 Exam Gradesand Hours ofSleepCorrelationExample - Math32 GradeForecasting xample. Math 32 Grade Forecasting Data. Suppose that we just want toexamine two aspects of the Math 32 grade forecasting data (in the relevant RDatafile) — whether the students’ forecasted grade was “higher than expected” andwhether they intend to “study more.”The RData file can be loaded into your R environment with the commandload(" /Desktop/Student Responses Regarding Math 32 GradePredictor.RData"). (The path will depend on where you’ve placed the RDatafile on your hard drive.)
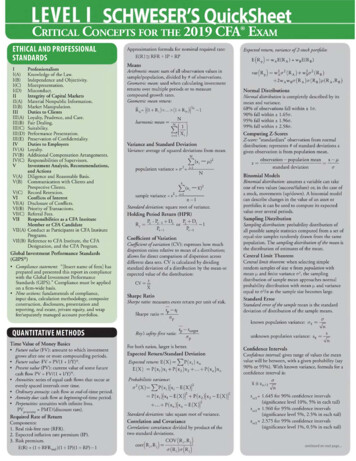
Example - Math 32 Grade Forecasting DataStatisticalSignificanceand Analysisof essionExample - Math5 Midterm 1GradesExample - Math11 Exam Gradesand Hours ofSleepCorrelationExample - Math32 GradeForecasting he command cor.test(StudentResponses HigherThanExpected,StudentResponses StudyingMore) gives the following output.
Example - Math 32 Grade Forecasting DataStatisticalSignificanceand Analysisof essionExample - Math5 Midterm 1GradesExample - Math11 Exam Gradesand Hours ofSleepCorrelationExample - Math32 GradeForecasting he correlation is nearly zero, and the p-value is 0.9858. It seems likely that thesetwo quantities are not related to each other.
Miscellaneous ConsiderationsStatisticalSignificanceand Analysisof essionExample - Math5 Midterm 1GradesExample - Math11 Exam Gradesand Hours ofSleepCorrelationExample - Math32 GradeForecasting t is impossible to mention all of the possible considerations that could come intoplay when analyzing data in the scope of just one workshop. Here are someconsiderations that are generally good to keep in mind:ANOVA can be done in a hierarchical way; that is, it can assess whether onequantity “describes” another well, controlling for another quantity. (Forexample, we might want to know if a student’s study time is associated with ahigher exam grade, controlling for the student’s percentage grade in theirprevious mathematics course.)The statistical methods mentioned in this workshop are what are technicallycalled parametric methods. This means that they make certain assumptionsabout the data. If these assumptions are not true, the resulting p-values maynot be reliable. There are methods called non-parametric methods that donot make these assumptions; one of their shortcomings is that their analysishas a higher false negative rate in contexts where parametric methods couldhave been used.
Miscellaneous ConsiderationsStatisticalSignificanceand Analysisof essionExample - Math5 Midterm 1GradesExample - Math11 Exam Gradesand Hours ofSleepCorrelationExample - Math32 GradeForecasting sing continuous data (e.g., percentage grades) is better than discrete data(e.g., letter grades) if possible, because discretizing data leads to an increasein the false negative rate of statistical tests.Without randomization, association (e.g., correlation) doesn’t imply causation.In academic settings, randomization generally isn’t practical. So, ourconclusions about causation based on survey data will typically be of asomewhat speculative nature.
Miscellaneous ConsiderationsStatisticalSignificanceand Analysisof essionExample - Math5 Midterm 1GradesExample - Math11 Exam Gradesand Hours ofSleepCorrelationExample - Math32 GradeForecasting f several inputs are fed into a linear regression model, then some of thep-values will probably be statistically significant “by chance”. This is themultiple testing problem — when many statistical tests are run at once,some of them may be significant “by chance.” When comparing regressionmodels, it is possible to use quantities that take this into account, such asAIC (for Akaike information criterion). AIC basically includes the numberof input variables as a measure of the complexity of the model and tries tobalance goodness-of-fit of the model against the complexity of the model.
Miscellaneous ConsiderationsStatisticalSignificanceand Analysisof essionExample - Math5 Midterm 1GradesExample - Math11 Exam Gradesand Hours ofSleepCorrelationExample - Math32 GradeForecasting he goodness-of-fit of a linear regression model is measured using theR-squared value. A high R-squared value (close to 1, i.e., 100%) implies agood fit; a low R-squared value (close to 0) implies a bad fit. However, theR-squared value can be made artificially high simply by including many inputvariables in the model. This phenomenon is called overfitting. It can beaddressed by pruning the model by removing the input variables with thehigh p-values and examining the R-squared value of the reduced model.Alternatively, the model with highest AIC (see the previous bullet point) canbe selected as the “best” model.
Miscellaneous ConsiderationsStatisticalSignificanceand Analysisof essionExample - Math5 Midterm 1GradesExample - Math11 Exam Gradesand Hours ofSleepCorrelationExample - Math32 GradeForecasting o access an R help file for a specific command, we use the ? command. (Forexample, to access the help file for the plot command, enter ? plot at theR prompt.) However, the help files can be somewhat cryptic, so Google can behelpful as well. (For example, you could Google “How do I make good-lookingplots in R?”)Sometimes when using R, you’ll realize that you need a specific package inorder to implement a particular functionality. (Often you’ll end up realizingthis as a result of a Google search, such as “How do I import Excelspreadsheets into R?”) Say we want to use the xlsx package — we use thecommand install.packages("xlsx") followed by library(xlsx). We arenow ready to use the functions from the xlsx package.If you want to use RStudio, you’ll need to install R first, and then installRStudio.All of the commands that work in R will also work in RStudio.
Recommended ReadingStatisticalSignificanceand Analysisof essionExample - Math5 Midterm 1GradesExample - Math11 Exam Gradesand Hours ofSleepCorrelationExample - Math32 GradeForecasting lementary Statistics by Mario F. TriolaIntroductory Statistics with R by Peter DalgaardThe Wikipedia pages onHypothesis testingStatistical significanceCorrelationLinear regressiont-testp-valueANOVAParametric statisticsNon-parametric statisticsMultiple testing problemAkaike information criterion
Statistical Signi cance and Analysis of Data Daniel Swenson Statistical Signi cance Linear Regression Example - Math 5 Midterm 1 Grades Example - Math 11 Exam Grades and Hours of Sleep Correlation Example - Math 32 Grade Forecasting Data Miscellaneous Considerations Recommended Reading Statistical Signi cance But, could this mean di erence be .