Transcription
Uncertainty Analysis of SpectralIrradiance Reference StandardsUsed for NREL CalibrationsA. Habte, A. Andreas, I. Reda, M. Campanelli,and T. StoffelNREL is a national laboratory of the U.S. Department of Energy, Office of EnergyEfficiency & Renewable Energy, operated by the Alliance for Sustainable Energy, LLC.Technical ReportNREL/TP-5500-58617May 2013Contract No. DE-AC36-08GO28308
Uncertainty Analysis ofSpectral Irradiance ReferenceStandards Used for NRELCalibrationsA. Habte, A. Andreas, I. Reda, M. Campanelli,and T. StoffelPrepared under Task No. SS13.3513NREL is a national laboratory of the U.S. Department of Energy, Office of EnergyEfficiency & Renewable Energy, operated by the Alliance for Sustainable Energy, LLC.National Renewable Energy Laboratory15013 Denver West ParkwayGolden, Colorado 80401303-275-3000 www.nrel.govTechnical ReportNREL/TP-5500-58617May 2013Contract No. DE-AC36-08GO28308
NOTICEThis report was prepared as an account of work sponsored by an agency of the United States government.Neither the United States government nor any agency thereof, nor any of their employees, makes any warranty,express or implied, or assumes any legal liability or responsibility for the accuracy, completeness, or usefulness ofany information, apparatus, product, or process disclosed, or represents that its use would not infringe privatelyowned rights. Reference herein to any specific commercial product, process, or service by trade name,trademark, manufacturer, or otherwise does not necessarily constitute or imply its endorsement, recommendation,or favoring by the United States government or any agency thereof. The views and opinions of authorsexpressed herein do not necessarily state or reflect those of the United States government or any agency thereof.Available electronically at http://www.osti.gov/bridgeAvailable for a processing fee to U.S. Department of Energyand its contractors, in paper, from:U.S. Department of EnergyOffice of Scientific and Technical InformationP.O. Box 62Oak Ridge, TN 37831-0062phone: 865.576.8401fax: 865.576.5728email: mailto:reports@adonis.osti.govAvailable for sale to the public, in paper, from:U.S. Department of CommerceNational Technical Information Service5285 Port Royal RoadSpringfield, VA 22161phone: 800.553.6847fax: 703.605.6900email: orders@ntis.fedworld.govonline ordering: http://www.ntis.gov/help/ordermethods.aspxCover Photos: (left to right) PIX 16416, PIX 17423, PIX 16560, PIX 17613, PIX 17436, PIX 17721Printed on paper containing at least 50% wastepaper, including 10% post consumer waste.
AcknowledgmentsWe greatly appreciate Keith Emery, manager of the Device Performance Group at the NationalRenewable Energy Laboratory, for thoroughly reviewing this report and providing helpfulsuggestions. We also thank Daryl Myers (National Renewable Energy Laboratory, retired) forhis continuous, insightful support, and Howard Yoon, from the National Institute of Standardsand Technology, for his perceptive comments. Many thanks also for NREL’s MetrologyLaboratory for providing support for this effort.iii
Executive SummarySpectral irradiance produced by lamp standards such as the National Institute of Standards andTechnology (NIST) FEL-type tungsten halogen lamps are used to calibrate spectroradiometers atthe National Renewable Energy Laboratory. Spectroradiometers are often used to characterizespectral irradiance of solar simulators, which in turn are used to characterize photovoltaic deviceperformance, e.g., power output and spectral response. Therefore, quantifying the calibrationuncertainty of spectroradiometers is critical to understanding photovoltaic system performance.In this study, we attempted to reproduce the NIST-reported input variables, including thecalibration uncertainty in spectral irradiance for a standard NIST lamp, and quantify uncertaintyfor measurement setup at the Optical Metrology Laboratory at the National Renewable EnergyLaboratory. The NIST primary FEL lamp standard calibration uncertainty is increased by factorssuch as temporal instability of the lamp current and voltage, stray light, and distance. Wedescribed these sources of uncertainty, and we performed an uncertainty analysis of the spectralirradiance following the International Organization for Standardization Guide to the Expressionof Uncertainty in Measurement method. The combined expanded uncertainty of the spectralirradiance with a 95% level of confidence ranges from approximately 1% to 2% for thewavelength range from 250 nm to 2400 nm. However, the analysis in this report covers only theuncertainty of spectral irradiances produced from a standard lamp as a result of uncertainties incurrent, voltage, distance, stray light, and the NIST calibration values. This analysis does notcover the inherent uncertainties in various spectroradiometer systems and/or interpolation ofspectral irradiance not included in the reported NIST wavelengths. Users are advised to considerother sources of uncertainty specific to their calibration setup and spectroradiometer.iv
Table of Contents123456Introduction . 1Method . 22.12.2Lamp Setup for Spectroradiometer Calibration . 2Uncertainty Calculation. 42.2.1 Measurement Model. 42.2.2 Sources of Uncertainties. 62.2.3 Calculating Sensitivity Coefficients . 72.2.4 Standard Uncertainty . 72.2.5 Combined Standard Uncertainty . 82.2.6 Expanded Uncertainty . 8Results . 9Validation. 12Summary . 13References . 14v
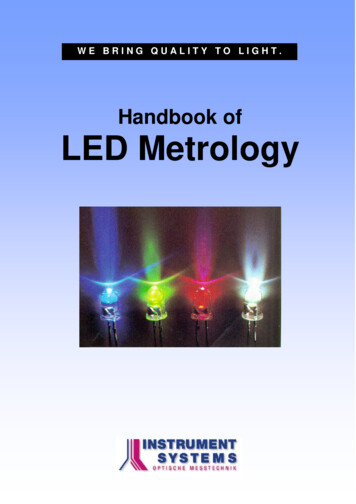
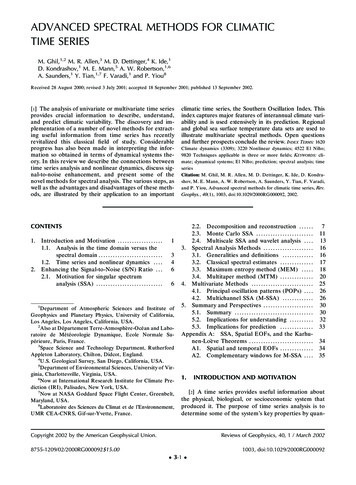
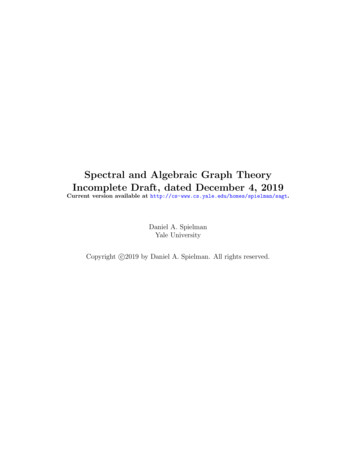
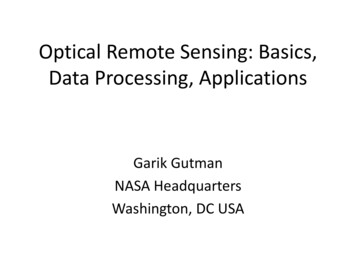
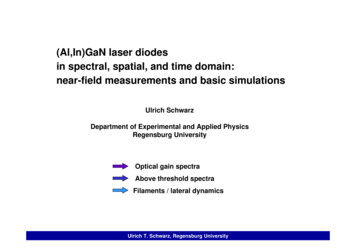
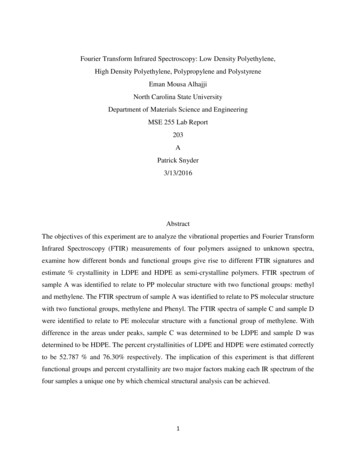
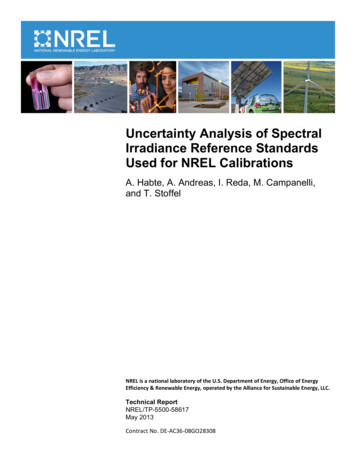
List of FiguresFigure 1. Measurement setup of spectral irradiance using a NIST standard lamp and area of studyincluded in this report (red square). . 3Figure 2. Plot showing nonequivalence comparison between NIST-reported and NREL-calculatedspectral irradiance as a function of wavelength. . 10Figure 3. Uncertainty in spectral irradiance as a result of the reduction in the set current. . 10Figure 4. Plot showing the uncertainty values from both the NIST-reported (calibration certificate) andNREL calculated estimates. . 11Figure 5. Monte Carlo validation results for (top) 250 nm and (bottom) 1,600 nm . 13List of TablesTable 1. Spectral Irradiance and Measurement Setup Input Parameters From NIST and NREL . 2Table 2. Contributing Components to the Uncertainty . 6Table 3. Combined Expanded Uncertainty Results for Irradiance (k 1.96). 9Table 4. Each Component Contribution to the Combined Standard Uncertainty for 250 nm Wavelength 11vi
1 IntroductionAccurate characterization of photovoltaic (PV) device spectral response is critical to improvingphotovoltaic (PV) conversion efficiencies and reducing investment risks for PV industries.Spectral irradiance measured by a spectroradiometer is used in international standards forclassification of solar simulators and spectral mismatch corrections (Andreas et al. 2008). Thus,measurements of spectral irradiance with quantified uncertainty using well-calibratedspectroradiometers improve the accuracy of PV performance measurements. Before determiningthe measurement uncertainty of a spectroradiometer used to characterize solar simulators, oneshould establish the uncertainty of the optical measurement setup using a National Institute ofStandards and Technology (NIST) standard lamp. The spectral irradiances of standard lampsobtained from NIST are supplied as measured quantity values (VIM §2.10) with associatedmeasurement uncertainty (VIM §2.26). This report attempted to reproduce these results at theNational Renewable Energy Laboratory (NREL) Optical Metrology Laboratory. Based on themeasurement setup and equipment used at NREL, a comprehensive uncertainty analysis wasperformed by developing a measurement model for spectral irradiance (the measurand, VIM§2.3) and determining the sensitivity coefficient for each uncertain input to the model. Further,the measurement model contains the NIST-reported values, and NREL attempted to reproducethese values; however, in the process there was a difference between the NIST-reported spectralirradiance (Wλi, NIST) and NREL-calculated spectral irradiance (Wλi, NREL). This difference couldhave been avoided by using the same laboratory setup as NIST, but it is impractical. Because ofthis difference in the measurement setup between NIST and NREL, there was a spectralirradiance difference that contributed to the nonequivalence between the NIST-reported andNREL-calculated irradiance. In this report, we included the difference between the twoparameters as an additional source of uncertainty when using NIST-calibrated spectral irradiancevalues.The uncertainty statement plays an important role in the measurement traceability where theresults relate to a reference through unbroken chain of measurement (JCGM/WG 1 2008; Reda2011). In this report, uncertainty critical for a proper calibration prior to using aspectroradiometer was analyzed using the International Organization for Standardization Guideto the Expression of Uncertainty in Measurement (GUM) method by categorizing the evaluationof uncertainties as Type A or Type B (VIM §2.28 & §2.29). To be clear, this uncertainty analysiscovered only the spectral irradiances produced by a standard lamp in a spectroradiometercalibration setup, not the inherent uncertainties in spectroradiometer measurement systems.Users should include additional uncertainty components when calibrating a specificspectroradiometer (for example, wavelength accuracy) and when the spectroradiometer is usedfor spectral measurements of unknown sources.1
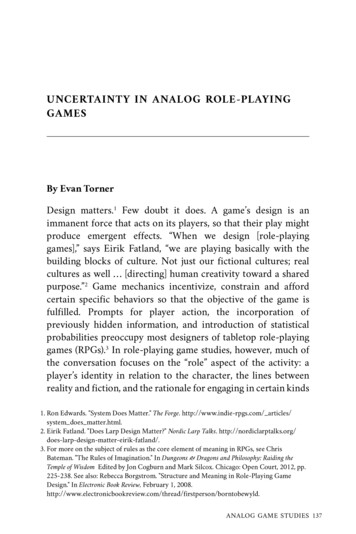
2 Method2.1 Lamp Setup for Spectroradiometer CalibrationNIST provides a tungsten-filament, 1,000 W quartz-halogen FEL standard spectral irradiancelamp that has been calibrated at 31 wavelengths ranging from 250 to 2,400 nm. The calibrationdistance is 50 cm from the lamp posts to the detector of a reference spectroradiometer with thelamp operated by a constant current supply set at 8 A. NREL reproduced the measurementcriteria specified by NIST (Table 1) with minimum uncertainty using a stable computercontrolled power supply, monitoring the power supply voltage setting and lamp current with aprecision current shunt in series with the lamp. To ensure a reproducible calibration, laseraligned geometry and a calibrated distance bar were used to set up the lamp and aspectroradiometer under test on an optical table (Figure 1). Further, NREL performedcalibrations under similar meteorological conditions as NIST. There is a difference in relativehumidty between the NIST and NREL calibration laboratories; however, the NIST-reportedwavelength ranges were not affected by relative humidity changes.Table 1. Spectral Irradiance and Measurement Setup Input Parameters FromNIST and NRELInput ParametersUnitsNIST-ReportedNREL Calibration TA8.000---D,NISTm0.5000---Reported: WavelengthCalculated: Wavelengthdependentdependent (W λi, NREL)W λi, NIST2W/m /nm2
Figure 1. Measurement setup of spectral irradiance using a NIST standard lamp and area of studyincluded in this report (red square).The NREL measurement setup had some limitation in reproducing the setup provided by theNIST calibration report. For instance, NREL’s distance bar was constructed by the NRELmachine shop many years ago. Because of limitations of the machine shop at the time, the bar is0.0002 m short of the desired 0.5 m. Also, we determined a 0.2% expanded uncertainty from ourexperience and manufacturer specification that is equivalent to 1 mm distance. Themanufacturer’s specification was also obtained for the voltage at the filament of the NIST lamp,which is 0.0034%, and 0.0087% and 0.01% for measured voltage across the standard resistor andresistance, respectively. Further, many efforts have been made at NREL to minimize stray light.The reflectance of all materials in the lab has been measured from 300 nm to 2,400 nm tounderstand the reflectance characteristics. Many surfaces that have been black anodized by amachine shop (or other methods) have been found to be highly reflective (up to 80%) above700 nm. These surfaces, as well as other highly reflective surfaces in the lab, were removed fromthe field of view of the unit under test. NREL has been using special laser curtains and othersurfaces that have been measured to be flat black across the entire wavelength range, withreflectance typically less than approximately 5%. NREL also installed a 12-inch-diameter lighttunnel system (not shown in Figure 1) between the baffle system and unit under test to removereflected stray light in the room from entering the field of view of the unit under test. The onlyreflected surface that could not be removed from the field of view was stray light that could begenerated by light reflecting directly off the unit under test. Many cosine receivers, such asintegrating spheres, will also have light exiting in random directions. It is assumed that aminimum of three reflections would be necessary for this stray light to re-enter the unit undertest. The first reflection from the unit under test was assumed to be the worst case, at 100%reflectance. The other two reflections were from flat black surfaces at 5% reflectance, which3
gave a worst-case stray light estimate of 0.25%. Therefore, such differences were accounted forin the measurement model and uncertainty calculation of this report.The spectral irradiance distribution is affected by the electrical current flowing through thefilament of the FEL lamp. Therefore, NREL performed a test by changing the current by 5mAand examined the effect of the change on spectral irradiance. Because of the current controlcapability at NREL, there could be error in the set current up to /- 2.5mA. Therefore, a worstcase value of 5mA offset was used for this test. The resulting spectral irradiance change (300 nmto 1,630 nm) for the FEL lamp operating at 5mA delta was about 0.2% to 0.4% in theuncertainty.2.2 Uncertainty Calculation2.2.1 Measurement ModelAs a first step in the uncertainty analysis, a measurement model was developed that gives themeasurand (spectral irradiance) as a function of the input quantities related to the calibrationsetup (Equation 1) (JCGM/WG 1 2008).Wλi , NREL Vf , NREL * If , NREL * (1 fs , NREL) *where( DNREL / DNIST )2Wλi , NISTVf , NIST * If , NIST(1) Wλi,NREL is the calibration spectral irradiance at the ith wavelength at NREL in W m-2/nm(calculated) Vf,NREL is the measured voltage at the filament of NIST lamp, in V If,NREL is the calculated filament current, in A fs,NREL is a fraction of the stray light estimate (0.25%) contribution to the total NRELirradiance, WNREL, in W/m2WNREL (Vf , NREL * If , NREL * (1 0.0025)) / DNREL2 DNREL is the distance between the lamp and the unit under test at NREL, in m Wλi, NIST is the spectral irradiance at the ith wavelength measured at NIST, in Wm-2/nm Vf, NIST is the reference voltage across the filament measured at NIST, in V If, NIST is the reference filament current measured at NIST, in AwhereIf , NREL VR , NRELRNREL(2)(3) VR,NREL is the measured voltage across the standard resistor in volts, and RNREL is theresistance in ohms DNIST is the distance between the lamp and NIST reference detector at NIST, in m4
In Equation (1), the power and alignment parameters from NIST are constant values (DNIST 0.50 m, Vf,NIST 110.55 V, If,NIST 8 A) and they were obtained from the calibration certificateof the primary NIST FEL lamp. Therefore, the values can be described in the following equation:CNIST (4)DNIST 2 ConstantVf , NIST * If , NISTwhere CNIST is constant. However, the irradiance value provided by NIST is wavelength specificfor each lamp and was not included in Equation (4).Then Equation (1) could be rewritten asWλi , NREL Vf , NREL * If , NREL * (1 fs , NREL) * CNIST *Wλi , NIST( DNREL) 2(5)Under ideal conditions using the measurement model, the calculated value irradiance (Wλi, NREL)and NIST-reported irradiance (Wλi, NIST) should be equal. This could have been achieved byreplicating the same calibration setup as NIST and obtaining the same irradiance output at eachreported wavelength; however, because of the slight difference in the measurement setup atNREL as compared to NIST, there was irradiance difference that contributed to thenonequivalence between the NIST-reported and NREL-calculated irradiances. Therefore, in thisreport, we included the difference between the two parameters as an additional source ofuncertainty when using NIST-calibrated spectral irradiance values (Table 2).According to the GUM method, there are two types of uncertainty evaluations, designated asType A and Type B (Table 2). The former employs statistical methods; the latter uses any othermeans such as a manufacture specification or professional judgment. For this study, the inputvariables were assumed to be uncorrelated. Because all variables were measured or estimatedusing independent methods, there was no correlation.5
Table 2. Contributing Components to the UncertaintySource of R,NRELRNRELDNRELW λi, NISTW λi, NREL -W λi, NIST (nonequivalence)Estimated stray light (fs) rNormalRectangularRectangularRandomness (standard deviation)of(Vf,NREL*If,NREL)411ANormalAside from the reported irradiance uncertainty from NIST and the Type A randomness of theVf, NREL * If, NREL, the remaining sources of uncertainties were considered to have rectangulardistribution. Where there was scarce information of the underlying probability distribution,rectangular distribution extended to reasonable bounds beyond which it is improbable that thecontribution to the uncertainty lies. This distribution conservatively estimates uncertainty.2.2.2 Sources of UncertaintiesThe following sources were considered in the uncertainty analysis:1. Stability of the light source2. Distance from the lamp post to the unit under test3. Stray light4. Nonequivalence between the calculated NREL irradiance (Wλi, NREL) and the NISTreported irradiance (Wλi, NIST).The voltage from the multimeter and resistance from the shunt resistor measurements at theNREL Optical Metrology Laboratory were related to the stability of the light source. There wasalso uncertainty in the distance gauge used to establish the distance between the standard lampand the cosine receiver of the spectroradiometer. Further, there was uncertainty as a result ofstray light generated by reflective surfaces in the laboratory that were in the field of view of thespectroradiometer. As mentioned in Section 2.2.1, there was uncertainty as a result ofnonequivalence between the NREL-calculated spectral irradiance and NIST-reported value, andthis was included as a source of uncertainty. The calibration certificate from NIST providesuncertainty on the spectral irradiance of the standard NIST lamp at several specific wavelengths.A rectangular distribution was associated with the above uncertainty.6
2.2.3 Calculating Sensitivity CoefficientsThe GUM method includes calculating the sensitivity coefficients (C) of the variables in themeasurement equation. These coefficients affect the contribution of each input factor to thecombined uncertainty of the spectral irradiance at a particular wavelength. Therefore, thesensitivity coefficient for each input was calculated by partially differentiating Equation (5) withrespect to each input. Wλi , NREL CVf , NREL VR , NREL * (1 fs , NREL) * CNIST *Wλi , NIST Vf , NRELRNREL * ( DNREL) 2(6) Wλi , NREL CVR , NREL Vf , NREL * (1 fs , NREL) * CNIST *Wλi , NIST VR , NRELRNREL * ( DNREL) 2(7)2 Wλi , NREL CRNREL Vf , NREL * VR , NREL * (1 fs , NREL) * CNIST *Wλi , NIST * DNREL RNREL( RNREL * DNREL2 ) 2(8) Wλi , NREL CDNREL Vf , NREL *VR , NREL * (1 fs , NREL) * CNIST *Wλi , NIST * R * 2 * DNREL DNREL( RNREL * DNREL2 ) 2(9) Wλi , NREL Cfs , NREL Vf , NREL *VR , NREL * CNIST *Wλi , NIST fS , NRELRNREL * ( DNREL) 2(10) Wλi , NREL CWλi , NIST Vf , NREL * VR , NREL * (1 fs , NREL) * CNIST Wλi , NISTRNREL * ( DNREL) 2(11)where CVf,NREL, CVR,NREL, CR,NREL,CDNREL, Cfs,NREL, and CWλi,NIST are sensitivity coefficients ofVf,NREL, VR,NREL, RNREL, DNREL, fs,NREL, and Wλi,NIST, respectively.However, for sources of uncertainties that were not associated with the measurement model, thesensitivity coefficient for each parameter had a value of unity and the component uncertainty wasequivalent to the standard uncertainty. These sources of uncertainty variables included thenonequivalence between the NREL-calculated spectral irradiance and NIST-reported spectralirradiance, and the randomness or standard deviation of the NREL Vf * If parameters.2.2.4 Standard UncertaintyStandard uncertainty of the Type B uncertainty (u) was calculated for individual inputs usingEquation (12). Where information of the expanded uncertainties for such inputs were estimatesbased on our experience or calibration results, the GUM method assumed a rectangulardistribution of the Type B parameters (estimates) (JCGM/WG 1 2008 ; Reda 2011; Taylor andKuyatt 1994) and divided the expanded uncertainty (U) of the individual parameter by squareroot of three. The calibration results had a normal distribution, and the expanded uncertainty wasdivided by two.7
u Uor u 3U2(12)Type A standard uncertainty was calculated by taking repeated indications (VIM §4.1) of theinput quantity value, and the sample mean and sample standard deviation (SD) could becalculated. The standard uncertainty (u) was approximated byu SDn(13)where n equals the number of repeated indications of the quantity value.2.2.5 Combined Standard UncertaintyIndividual standard uncertainties and their respective sensitivity coefficients can be combinedusing the root sum of the squares method (JCGM/WG 1 2008 and Kacker, Sommer, and Kessel2007). The result is called the combined standard uncertainty, as shown in the following equation(u is for all Type B and Type A standard uncertainty values), where C is unity for Type A and, insome cases, for Type B standard uncertainty (e.g., the nonequivalence between NIST irradiance(Wλi,NIST) and NREL-calculated irradiance (Wλi,NREL)).u n 1 (u*(14)C )2j 02.2.6 Expanded UncertaintyThe expanded uncertainty (U95) was calculated by multiplying the combined uncertainty (uj) by acoverage factor (k 1.96, for infinite degrees of freedom), which represents a 95% confidencelevel.(15)U 95 u * kThe expanded uncertainty U95 as a percentage was then calculated asU 95% U 95* 100Wλi , NIST(16)8
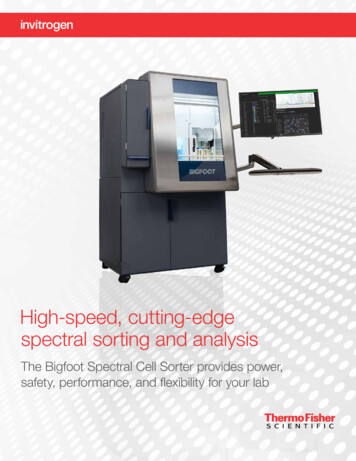
3 ResultsThe estimated uncertainty determined from this study followed rigorous measurement protocolsto ensure traceability to Système International d'Unités. The estimated uncertainty results of 10wavelengths are summarized in Table 3. NIST reports uncertainty on these 10 wavelengths, andthe purpose of this study was to determine how close we could reproduce these uncertaintiesusing our existing spectral irradiance measurement method. The expanded uncertainty wascalculated using Equation (16). The 250 nm (approximately 2%) and 2,400 nm (approximately1.5%) wavelengths had larger expanded uncertainty. Figure 2 shows the nonequivalence betweenthe NREL-calculated spectral irradiance and NIST-reported irradiance. The values are very closeto each other; however, the difference between the two was added to the expanded uncertainty.Further, the irradiance of the standard lamp was measured using a spectroradiometer system at aset current with offset of 5mA to evaluate the effect of altering the electrical power of that fromNIST (Figure 3). Current was then reset to the original set current to verify no drift in calibrationsetup or spectroradiometer system. As described in Section 2, the power supply at NREL can beset in 5mA increments; hence, at any time during a calibration there could be a /- 2.5mA errorin the set current. Therefore, a worst-case value of 5mA offset was used for this test. Theresulting irradiance difference of this test in the 300 nm to 1,630 nm region was found to be from0.2% to 0.4% for all the specified wavelengths. Alternatively, the effect of the difference inelectrical power on the irradiance was calculated as nonequivalence Wλi, NREL -Wλi, NIST; thelarger value of 0.4% from the 5mA offset or nonequivalence was then added to the overalluncertainty.Table 3. Combined Expanded Uncertainty Results for Spectral Irradiance (k 55 nm655 nm900 nm1600 nm2000 nm2300 nm2400 nm9
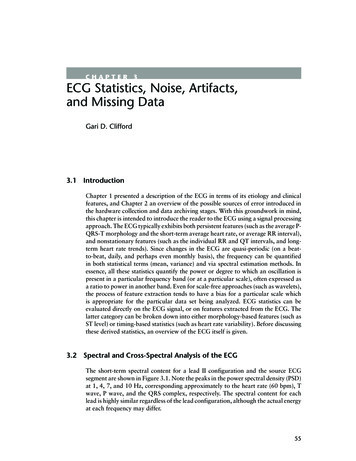
Spectral Irradiance 0140016001800200022002400Wavelength (nm)NIST Reported Spectral IrradiaceNREL Calculated Spectral IrradiaceFigure 2. Plot showing nonequivalence comparison between NIST-reported and NREL-calculatedspectral irradiance as a function of wavelength.Figure 3. Uncertainty in spectral irradiance as a result of the reduction in the set current.Among the uncertainty factors, the FEL lamp uncertainty obtained from NIST and the differencebetween the calculated NREL irradiance using Equation (4) and NIST-reported irradiance werethe most dominant part in the contribution list at each wavelength (Figure 2 and Figure 4). Forexample, Table 4 shows that the NIST-reported calibration uncertainty and the differencebetween the NIST-reported irradiance and NREL’s calculated irradiance were the largestcontributors to the expanded uncertainty, 52.3% and 31.3%, respectively.10
Relative expanded uncertainty (%)2.502.001.501.000.500.002004006008001000 1200 1400 1600 1800 2000 2200 2400Wavelength (nm)NIST Reported Uncertainty (%)NREL Estimated U95% UncertaintyFigure 4. Plot showing the uncertainty values from both the NIST-reported (calibration certificate) and NRELcalculated estimates.Table 4. Each Component Contribution to the Combined Standard Uncertainty for 250 nm aintyContributionSource of DNRELWλ,NISTEstimated Stray Light(NREL)Randomness (sdev) certainty (U95)ExpandedUncertainty 41.50E-061.57E-062.18E-03-1.74E-02-6.97E-041.01E 101.00E 003.66E-101.34E-1909.08E-071.00E 009.08E-078.25E-1331.31.57E-06(%)3.55E-062.0611100
4 ValidationOur uncertainty analysis was based upon a linearization of the measurement model (Equation 1).To validate this result, Monte Carlo simulations (JCGM 101 2008) were conducted using themeasurement model at two wavelengths: 250 nm and 1600 nm. These were selected forvalidation because they have higher and lower uncertainty, respectively. The simulation used ameasurement function that modeled the NREL spectral irradiance as the NIST spectralirradiance plus an uncertain, zero-mean bias. The bias was modeled by using the nonlinearmeasurement model (Equation 1) to compute Wλi,NREL - Wλi,NIST, where the sampling distributionfor this difference was adjusted to have zero mean. One million samples were drawn from thedistributions for the common inputs in the measurement model (Equation1) for the spectralirradiance at 250 nm and at 1600 nm. One million samples each for Wλi,NIST at 2
wavelength range from 250 nm to 2400 nm. However, the analysis in this report covers only the uncertainty of spectral irradiances produced from a standard lamp as a result of uncertainties in current, voltage, distance, stray light, and the NIST ca