Transcription
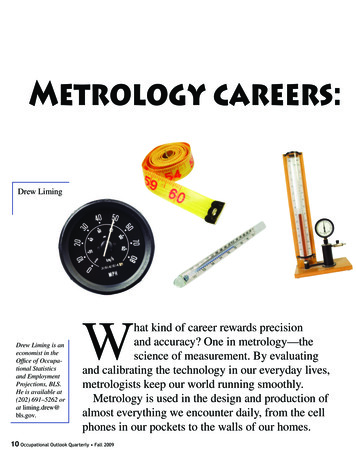
WE BRING QUALITY TO LIGHT.Handbook ofLED Metrology
Handbook of LED MetrologyINSTRUMENT SYSTEMS GmbHLED MetrologyContentsPage1. Introduction22. Terms and Definitions in Photometry and Colorimetry2.1 Radiometric quantities2.2 Photometric quantities2.3 Colorimetry33463 Basic Properties of LEDs3.1 Package design3.2 Electrical properties and ambient conditions7784 Optical Characteristics of LEDs4.1 Spatial radiation characteristics4.2 Luminous intensity and radiant intensity4.3 Luminous flux and radiant power4.4 Wavelength, color and spectrum11111315185 Requirements for Optical Measuring Instruments5.1 Comparison of photometer and spectroradiometer5.2 Requirements for a spectroradiometer5.3 Calibration202021246 Discussion of Sample Measurements with Error Analysis6.1 Effects of the dynamic measuring range6.2 Influence of stray light on white LEDs6.3 Influence of bandpass (spectral resolution)6.4 External influences6.5 Measurement in production2727303334357 Summary388 Bibliography40Version 1.1page: 1
Handbook of LED MetrologyINSTRUMENT SYSTEMS GmbH1. IntroductionIncredible developments in LEDs in recent years have generated a significantgrowth market with completely new applications. Full color displays onlybecame possible with the introduction of high-intensity blue LEDs, while whiteLEDs are becoming widely used in lighting engineering and the automobileindustry. These new applications have placed increasingly stringent demandson the optical characterization of LEDs, which serves as the benchmark ofproduct quality.Specific expertise is needed in order to obtain precise and reproducibleresults. This application note discusses the special characteristics of LEDsand provides recommendations for obtaining accurate measurement results.The goal here is to provide not only an introduction to LED metrology forreaders new to this subject area, but also a useful reference work for moreexperienced readers.A short introduction describes the basic terms and definitions used inphotometry and colorimetry, and details the physical properties that arespecific to LEDs. Later sections describe the test setups and methodologyrequired for accurate measurements. Possible sources of error arising frominteractions between LEDs and measuring instruments are also discussed.Readers who are short of time can go straight to the summary at the end ofthe brochure and then selectively read individual sections. However, werecommend that you read the entire brochure to obtain in-depthunderstanding of this subject area.The CIE (Commission Internationale de l Éclairage) is currently the onlyinternationally recognized institution providing recommendations for LEDmeasurements. The CIE publication 127 entitled LED Measurements waspublished in 1997 and is an important cornerstone of this application note.Version 1.1page: 2
Handbook of LED MetrologyINSTRUMENT SYSTEMS GmbH2. Terms and Definitions in Photometry and ColorimetryThe relevant optical quantities for LED metrology are defined underradiometry and photometry. This section provides a brief overview ofimportant terms that are essential for an in-depth understanding and correctuse of measuring instruments. A distinction is made between radiometricquantities describing physical radiation properties and photometric quantitiesdescribing effects on the human eye.2.1 Radiometric quantitiesRadiometry is concerned with the energy or the power of optical radiation fora given geometry of propagation. The spectrum covers the full range from UVto infrared light and is therefore independent of the sensitivity of the humaneye to brightness and color.There are four basic radiometric quantities:Radiant power or radiant fluxRadiant power Φe is defined as the total power dQe emitted by a light sourceper unit time dt (see Figure 1). The unit of radiant power is the watt [W].Φe dQ edtRadiant intensityRadiant intensity Ie is defined as the power dΦe emitted per unit solid angledΩ (see Figure 1). It is expressed in watts per steradian [W/sr].Ie dΦ edΩA detector with an active area A positioned at distance r from a light sourcemeasures radiant power dΦe. This configuration assumes a point source andthat therefore the inverse square law holds true. Distance r and the detectorarea dA define the solid angle dΩ.Version 1.1page: 3
Handbook of LED MetrologydΩ INSTRUMENT SYSTEMS GmbHdAr2IrradianceIrradiance Ee is obtained from the ratio of the radiant power dΦe and the areaof the detector dA. It is expressed in watts per square meter [W/m 2].Ee dΦ edAThe following relationship between radiant intensity Ie and irradiance Ee for apoint light source is derived from the above formula for irradiance Ee.Ee dΦ e I e dΩ I e 2dAdArRadianceRadiance Le is measured for extended, light sources (i.e. no point source)and is defined as the radiant power dΦe emitted from an area dAe per unitsolid angle dΩ. It is expressed in watts per steradian per square centimeter[W/sr cm 2]:Le d2ΦedA e dΩ2.2 Photometric quantitiesEach radiant quantity has a corresponding luminous quantity which considersthe visual perception of the human eye. The V(λ) curve describes the spectralresponse function of the human eye in the wavelength range from 380 nm to780 nm and is used to evaluate the corresponding radiometric quantity that isa function of wavelength λ. As an example, the photometric value luminousflux is obtained by integrating radiant power Φe (λ) as follows:Version 1.1page: 4
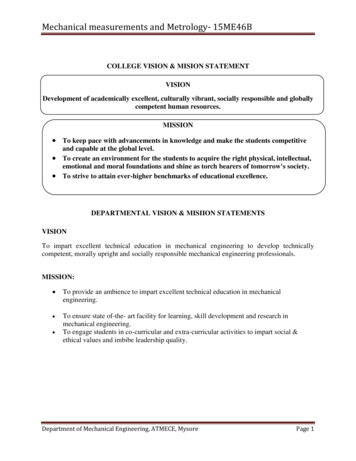
Handbook of LED MetrologyΦv KmINSTRUMENT SYSTEMS GmbH780nm Φ e (λ ) V (λ )dλ380nmThe unit of luminous flux Φv is lumen [lm]. The factor Km 683 lm/Westablishes the relationship between the (physical) radiometric unit watt andthe (physiological) photometric unit lumen. All other photometric quantitiesare also obtained from the integral of their corresponding radiometricquantities weighted with the V(λ) curve.The table below lists important radiometric and photometric quantities:RadiometryRadiant powerRadiant intensityIrradianceRadiancePhotometryLuminous fluxLuminous tWW/srW/m2W/m2 srUnitlmlm/sr cdlm/m2 lxcd/m2Table 1: gives an overview of radiometric and photometric quantities andtheir units.A1radiant power orluminous fluxA2radiant intensity orluminous intensityFigure 1: illustrates the definition of luminous flux and luminous intensity.Version 1.1page: 5
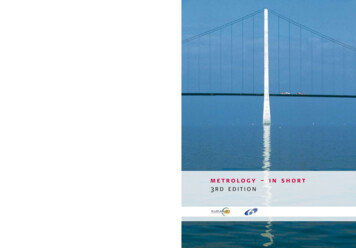
Handbook of LED MetrologyINSTRUMENT SYSTEMS GmbH2.3 ColorimetryColorimetry relates to the visual perception of color by the human eye andprovides a quantitative and qualitative description of color. In 1931 the CIEestablished the X, Y, Z tristimulus system which is based on the assumptionthat every color is a combination of the three primary colors red, green andblue [1]. The X, Y, Z tristimulus values are obtained by integrating the spectralpower distribution of radiation S (λ) and the three eye response curves x (λ),y (λ) and z (λ) over the 380 nm to 780 nm wavelength range (see Figure 2,left). The known x, y and z color coordinates are then derived from thetristimulus values. Figure 2 (right) shows this chromaticity space. There areother chromaticity spaces, e.g. u v and L a b that can be calculated bytransformation of the x,y,z values.520 nmCIE, 19310.82 observer550 nm1.50.6y-coordinatespectral tristim ulus values [a.u.]2.01.00.5λ dom .500 nmF0.4600 nmE650 nm780 nm0.2480 nm0.0450 nm0.0400500600wavelength [nm ]7000.0380 nm0.20.40.60.8x-coordinateFigure 2: left: The tristimulus functions x(λ) (dashed line), y(λ) (solid line) andz(λ) (dotted line).Right: 1931 CIE color diagram for 2 observer.Version 1.1page: 6
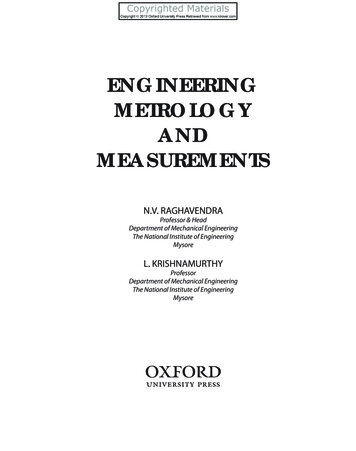
Handbook of LED MetrologyINSTRUMENT SYSTEMS GmbH3. Basic Properties of LEDsThis section describes the basic physical properties of LEDs. Some of theseproperties have a significant influence on optical measurements.3.1 Package designRadiation from LEDs is generated by a semiconductor chip that has beenmounted in a package. LEDs can now be obtained in a wide range of designsand types that exert a significant influence on the spatial radiationcharacteristics of the particular LED (see Figure 3). Lenses, mirrors ordiffusers can be built into the package to achieve specific spatial radiationcharacteristics. Production tolerances in the manufacture of the LED packagecan also play a role. For example, the mechanical and optical axes may notbe coincident (see figure 3 below).mechanical axisoptical axisFigure 3: shows various LED designs and an example of a skewed radiationcone of a LED.Version 1.1page: 7
Handbook of LED MetrologyINSTRUMENT SYSTEMS GmbHA reproducible test setup is therefore an important prerequisite for precisemeasurement of luminous intensity in order to guarantee that the detectoralways sees the same section of the emission cone.Figure 4 A precision test socket from Instrument Systems for 5 mm LEDs.Figure 4 shows a precision test socket from Instrument Systems for 5 mmLEDs. The three clamps always grip the LED package at the same point andthus permit identical alignment of the mechanical axis for all LEDs with thesame package. This setup follows the CIE recommendation that themechanical axis of the LED, rather than the optical axis, should be taken asthe reference axis for measurements [2].3.2 Electrical properties and ambient conditionsLEDs are normally operated at a constant current. The emitted light is afunction of the set forward current IF, and the compliance voltage Uf.Experiments show that the voltage is not stable instantly following the deviceenergization. Uf comes to stabilization as the temperature of the (lightemitting) diode junction stabilizes. The temperature rises due to electricalpower consumed by the LED chip and then stabilizes at a temperature valueTc TAmbient after a period of time. Because of this effect, the emitted light isnot stabilized until a stable forward voltage is attainedFigure 5 shows the stabilization over time of a white LED. The luminousintensity and the forward voltage is obtained every 10 seconds when aVersion 1.1page: 8
Handbook of LED MetrologyINSTRUMENT SYSTEMS GmbHcurrent begins to flow through the LED lasting until a constant forward voltagevalue is achieved.3.26U F [V]3.253.243.23I V [cd]2.462.432.402.37020406080100120time [sec.]Figure 5: shows the stabilization period of a white LED. Time [sec.] isentered on the x-axis and luminous intensity [cd], respectively forward voltageUF[V] on the y-axes.The stabilization procedure can last several seconds or up to a minute,although this is an extreme example and might be influenced by theproperties of the phosphor (for white LEDs). As soon as thermal equilibriumhas been reached in the chip, the value Tc is determined by measuring theheat exchange with the ambient surroundings. This occurs mainly via theelectrical contacts.Since the heat from the junction must be dissipated into the ambientsomehow, changing the ambient temperature affects the junction temperatureand hence the emitted light. A typical temperature coefficient for the forwardvoltage at constant current is approximately –1.5 to – 2.5 mV/K. At a givenVersion 1.1page: 9
Handbook of LED MetrologyINSTRUMENT SYSTEMS GmbHcurrent, therefore, the measured forward voltage is lower at highertemperatures.If the ambient temperature rises, the entire spectral power distribution isshifted in the direction of the longer wavelengths (except for blue LEDs). Theshift in peak wavelength is typically about 0.1 to 0.3 nm/K. This effect has anegligible influence upon the photometric values of green, yellow or amberLEDs because their peak wavelength is at the flatter portions of the V(λ)curve. However, the peak wavelength for red and blue LEDs are on the muchsteeper slopes of the V(λ) curve and this can lead to significant changes inthe photometric values (see Figure 12). This is why the current andtemperature stabilization is important for attaining constant spectralproperties.If the forward current is not constant, i.e. modulated, the temperature mayfluctuate. The average radiant power then no longer corresponds to theradiant power under constant current conditions. Similar problems apply topulsed LEDs, where a high current is switched on and off periodically.Differences in the value for luminous intensity may arise between multiplexoperation and constant-current operation despite comparable powerconsumption.Version 1.1page: 10
Handbook of LED MetrologyINSTRUMENT SYSTEMS GmbH4. Optical Characteristics of LEDs4.1 Spatial radiation characteristicsThe many different packages and types of LEDs generate different spatialradiation patterns. Precise knowledge of the angle-dependent distribution ofradiation is necessary for some applications. For example, a full-color (red,green, blue) LED display may appear white when observed at a normalangle if all three colors are illuminated simultaneously. However, if the LEDshave a different spatial distribution of radiation for the individual colors a colorchange occurs when the display is observed off axis.90120600.9intensity e 6: shows three very different spatial distribution patterns of radiationFigure 6 shows three typical LED radiation patterns: a diffuse LED withvirtually Lambertian distribution (dotted line), a narrow-angled specular LED(solid line), and a LED with two intensity peaks at 30 and 150 forbackground illumination of displays (Argus LED, broken line).Version 1.1page: 11
Handbook of LED MetrologyINSTRUMENT SYSTEMS GmbHA goniometer can be used to analyze the radiation pattern of an LED. TheLED is pivoted about its tip and the intensity is measured, i.e. the angle ϑ isscanned. This provides a profile of the radiated beam in one plane. In order torecord the two-dimensional radiation pattern the LED can also be rotatedabout its mechanical axis. This corresponds to angle ϕ in the sphericalcoordinate 406080angle θ [degree]Figure 7: shows the x color coordinate of an angle-dependent measurementof a white LED. A significant blue shift is seen in the center and edges of thebeam.Both a single profile and the complete spatial radiation pattern can bedetermined using the LED goniospectroradiometer (see Figure 10) fromInstrument Systems. The detector comprises a diffuser and a fiber bundlelinked to the spectroradiometer. The advantage of a goniospectroradiometeris that all relevant information such as the photometric integral, colorcoordinates, dominant wavelength, color temperature, etc. can be recordedsimultaneously with each single measurement. For example, the colorcoordinates of a white LEDs often show a significant blue shift because thelight path through the yellow phosphor is angle dependent (see Figure 7)Version 1.1page: 12
Handbook of LED MetrologyINSTRUMENT SYSTEMS GmbHThe detector should be positioned at a distance of 10–20 cm for measuringLambertian radiation distributions. If resolution is required to determine thestructure of very narrow-angled LEDs, the detector should instead bepositioned at a distance of 30–50 cm with an aperture limit at the detector.Angular scanning requires increments of 0.1 ϑ for typical narrow-angledLEDs with FWHM of 2 .4.2 Luminous intensity and radiant intensityLuminous intensity is the most frequently measured parameter. However, theunderlying concept for measuring radiant intensity and luminous intensityassumes a point source of light. One method of determining luminousintensity lv involves calibrating the detector in illuminance Ev and calculatingluminous intensity using the inverse square law Iv Ev r2. However, thevalidity of this calculation requires two conditions: The distance r between the detector and LED must be preciselydetermined. The many different designs available make it difficult todetermine the precise position of the emission center (also known as thegoniometric centroid) of the LED. The distance between the detector and LED must be large with respect tothe spatial width of the light source (far field condition).Many LEDs have a relatively large emitting area compared to the shortdistance that is generally used for a measurement and hence a point sourcecan not be assumed. Therefore the inverse square law no longer holds, andthe irradiance measured at the detector is not easily related to the intensity ofthe source.“Averaged LED intensity” conceptBecause of this, the CIE has developed the concept of “averaged LEDintensity” to solve the problem that occurs under near field conditions [2].This concept no longer corresponds to the physically precise definition ofluminous intensity but relates more to a measurement of illuminance at afixed distance. The LED is positioned in such a way that its mechanical axis isdirectly in line with the center point of a round detector with an active area of1 cm 2, and the surface of the detector is perpendicular to this axis.The CIE gives two recommendations for the distance between the LED andthe detector surface (see table below). The front tip of the LED is alwaysVersion 1.1page: 13
Handbook of LED MetrologyINSTRUMENT SYSTEMS GmbHtaken as the reference point for the distance in both cases. This guaranteesthat the same geometry is always used when measuring luminous intensity indifferent laboratories irrespective of the design of the LED.CIERecommendationCondition ACondition BDistance betweenLED tip anddetector316 mm100 mmSolid angle0.001 sr0.01 srTable 2: The CIE recommendations for the concept of averaged LEDintensity. The area of the detector is always 1 cm2. The relevant solid angle isdetermined by the distance between the LED tip and the detector.Figure 8 shows the realization of this concept in practice. The LED 430intensity probe developed by Instrument Systems comprises an optical probeof suitable length into which an LED test socket can be inserted. The distancebetween the tip of the LED and the detector – in this case a diffuser – isexactly 100 mm. Two baffles in the beam path help to reduce stray light. Afiber bundle is located behind the diffuser to guide the light into a calibratedspectroradiometer.Figure 8: shows the LED-430 measuring adapter that conforms to thestandard CIE condition B for 100 mm distance.Condition B (100mm) is the most commonly used geometry since it is alsosuitable for weak LED light sources. An optical probe such as the LED-440should be used in accordance with condition A for bright LEDs with a verynarrow emission angle.Version 1.1page: 14
Handbook of LED MetrologyINSTRUMENT SYSTEMS GmbH4.3 Luminous flux and radiant powerThe two principal methods for measuring total radiant power/luminous flux areusing either an integrating sphere or a goniophotometer. These twomeasuring principles are explained below.The integrating sphereThe integrating sphere is a hollow sphere, the interior of which is coated witha very stable material that is a diffuse reflector. Figure 9 shows a crosssection of an integrating sphere suitable for carrying out measurements ofluminous flux. The sphere has a port for the LED and a baffled port for thedetector.spectroradiometerLEDFigure 9: shows a cross-section of an integrating sphere. The LED port is atthe left and the detector is positioned at 90 (top ).The coating on the interior of the sphere ensures that the launched radiantflux Φ incident on area A in the interior of the sphere is reflected in such away that the radiance or luminance is equal in all directions. Under a certainangle the area A radiates to A and generates an indirect irradiance Eindthat is independent of the relative position of A to A [3]. The indirectirradiance Eind is therefore already equal over the entire surface of the sphereVersion 1.1page: 15
Handbook of LED MetrologyINSTRUMENT SYSTEMS GmbHafter one reflection. The irradiance E, that arises at a specific area A withinthe sphere can be calculated by integrating the indirect irradiance Eind overthe entire surface of the sphere. Taking multiple reflections into account thisirradiance E is proportional to the total radiation Φ and is measured by adetector.This only applies if the interior of the sphere has a Lambertian characteristicwith constant spectral properties, if the detector has perfect cosine correction,and if there are no absorbing surfaces in the sphere [3, 4]. However, thereare a number of error sources under experimental conditions. For example, itis not possible to create a perfectly diffuse reflector with constant reflectanceover the entire interior of the sphere. Spectral characteristics of the coatingand the size of the ports also constitute additional sources of error.The wide range of radiation characteristics shown by LEDs can introducecalibration errors in measuring luminous flux. An accuracy of 5% can beobtained for components with diffuse emission, but deviations of more than10% are possible with narrow-angled LEDs. Sphere diameters of 80 and 150mm have become established for measuring luminous flux. The larger sphereis recommended if it is important to keep measurement errors to a minimum,because the ratio of the sphere area to the size of the ports and the LED ismore favorable. However, this advantage results in a loss of intensity.Where to position the LED in the integrating sphere remains a matter ofcontroversy. In the latest CIE discussions it was agreed to position the entirepackage of the LED inside the sphere (ie up to the point where the contactsstart, see Figure 9). This setup is called 2π luminous flux measurementallowing the best match to the actual use of the LED in a final end product(e.g. in a backlight).The goniophotometerA goniophotometer offers another method for determining luminous flux andradiant power. It is best to envisage the LED enclosed by an imaginarysphere. A cosine-corrected detector moves on the surface of the spherealong specific paths at distance r (the sphere radius). The detector is used todetermine irradiance E arising as a result of the partial radiant flux dΦincident on detector area dA as a function of ϑ and ϕ.E(ϑ, ϕ ) dΦdAVersion 1.1page: 16
Handbook of LED MetrologyINSTRUMENT SYSTEMS GmbHIn order to determine total radiant power, the detector is moved incrementallyaround angle ϑ. Several measurements are taken for each angle ϑ with angleϕ varying from 0 to 360 . Individual zones are scan ned corresponding to aconstant degree of latitude of the sphere. Total radiant power Φ is thenΦ r2 2π π E(ϑ, φ) sin(ϑ ) dϑ dϕ00Alternatively, instead of moving the detector which requires considerablemechanical effort, the LED can be rotated about its tip. Measurements at thePTB (Physikalisch-technische Bundesanstalt) have shown that it is irrelevantwhether the detector or the LED moves [6]. The distance between the LEDand detector should be 30 cm. A measurement area of 1 cm2 isrecommended for diffuse LEDs. However, the active area should be reducedfor narrow-angled LEDs. Figure 10 shows the setup for this kind of LEDgoniophotometer. The angle ϕ is adjusted by rotating the LED about itsmechanical axis and angle ϑ by pivoting about its tip. The detector sits on anoptical rail to permit measurements at various distances.Figure 10. shows the LED goniospectroradiometer from Instrument Systemswhere the LED is moved instead of the detector.Version 1.1page: 17
Handbook of LED MetrologyINSTRUMENT SYSTEMS GmbH4.4 Wavelength, color and spectrumThe spectral power distribution of the optical radiation emitted by LEDs differsin many ways from other radiation sources. It is neither monochromatic like alaser nor broadband like a tungsten lamp but rather lies somewhere betweenthese two extremes. The spectrum of an LED has a specific peak wavelengthλp depending on the manufacturing process where the FWHM is typically acouple of tens of nanometers (Figure 11).1.0intensity [%]0.8λp0.60.4λc0.20.0400450 λ 0.5500550600wavelength [nm]Figure 11: The spectral power distribution of a blue LED and importantspectral parameters.The spectral parameters of LEDs are listed below:Peak wavelength λp :The wavelength at the maximum intensity of the spectrum. The peakwavelength is easy to define and is therefore generally given in LED datasheets. However, the peak wavelength has little significance for practicalpurposes since two LEDs may well have the same peak wavelength butdifferent color perception.Version 1.1page: 18
Handbook of LED MetrologyINSTRUMENT SYSTEMS GmbHFWHM:The spectral bandwidth at half intensity λ0,5 is calculated from the twowavelengths λ 0.5 and λ 0.5 on either side of λp: λ0.5 λ 0.5 - λ 0.5Center wavelength λ0.5m:The average wavelength corresponds to the wavelength halfway betweenthe half-wavelengths λ 0.5 and λ 0.5.Centroid wavelength λc:The centroid wavelength λc is the wavelength that divides the integral of aspectrum into two equal parts according to the following formula:λ2 λ S(λ ) dλλc λ1λ2 S(λ ) dλλ1The centroid wavelength is ideal for characterizing the radiometric propertiesof LEDs (e.g. infrared LEDs).Dominant wavelength:The dominant wavelength is determined from the color coordinates of themeasured spectrum. A straight line is taken through the color coordinates of areference illuminant and the measured color coordinate F in the color diagram(see Figure 2). The equal energy point E is generally taken as the referenceilluminant. The intersection S between the straight line and the boundary ofthe color diagram gives the dominant wavelength. It is a measure of the colorsensation produced in the human eye by the LED.Purity:Purity is defined as the ratio of the distance from the equal energy point E tothe color coordinate F and the distance from the equal energy point E tointersection S in the color diagram. Most LEDs are narrow band radiators,with a purity of nearly 100%, i.e. the color cannot be distinguished from amonochromatic beam.Version 1.1page: 19
Handbook of LED MetrologyINSTRUMENT SYSTEMS GmbH5. Requirements for Optical Measuring InstrumentsThis section describes the most important properties of optical measuringinstruments relevant to the precise measurement of optical LED parameters.There are two measuring procedures for determining the photometric andcolorimetric values of light radiation: The integration method based on a photometer The spectral resolution method based on a spectroradiometer5.1 Comparison of photometers and spectroradiometersPhotometers use a broadband detector in conjunction with a V(λ) filter tomeasure luminous intensity. The output current of this detector is directlyproportional to the photometrically measured value, i.e. a photometer forluminous intensity is calibrated in cd per photocurrent.A spectroradiometer measures the total spectral power distribution of theLED. Then the photometric value is calculated (usually in software) from thismeasured spectrum weighted by standard CIE tables. This basic differencebetween spectroradiometers and photometers is extremely important in LEDmetrology.V(λ) filters are well suited for carrying out measurements on standardilluminant A light sources (Planckian radiator with 2850 K color temperature).These sources have a maximum radiation distribution in the infrared regionwhich decreases gradually over the visible range of the spectrum. At 400nm,the value is only 8% of the maximum. If the V(λ) filter is optimized to thisradiation distribution, the accuracy of the correction in the slopes of the V(λ)curve is not so important because there is relatively little light in the bluerange of the spectrum. A filter deviation in the slopes only results in a slighterror of the measured photometric values. LEDs, however, have a completelydifferent spectral power distribution, which tends to be Gaussian with aspecific peak wavelength and a FWHM of a couple of tens of nanometers.The relatively poor correction of the filter, particularly at the slopes of the V(λ)function (see figure 12 dashed and broken curve), results in large deviationsin the luminous intensity and dominant wavelength particularly for blue, redand white LEDs. Errors of several 100% are not unusual for blue LEDs [4, 5]and correct evaluation of the blue peak in white LEDs is critical for anaccurate determination of the color coordinates (see also section 6.2).Version 1.1page: 20
Handbook of LED MetrologyINSTRUMENT SYSTEMS GmbH1intensity [%]0.10.011E-31E-41E-5400500600700wavelength [nm]Figure 12: Theoretical V-lambda function (dashed line) and measuredtransmission curve (broken line) of a real V(λ)-filter, a blue and red LED (solidlines), and radiation from standard illuminant A (dotted line).A precise spectroradiometer (see next section) avoids these errors becausethe photometric quantities are calculated from the spectral data with preciselydefined CIE functions. Spectroradiometers should therefore be used for LEDmetrology.5.2. Requirements for a spectroradiometerA spectrometer must meet certain basic requirements for carrying outradiometric measurements before it can be used as an accuratespectroradiometer. Accuracy depends on the interaction of all componentsincluding both the optical systems (monochromator, optical probe) andelectronics (detector, amplifier and analog/digital converter). Simple, low-costspectrometers generally fail to meet these high standards and can lead tosignificant errors and lack of correlation in measurements.Version 1.1page: 21
Handbook of LED MetrologyINSTRUMENT SYSTEMS GmbHThe following criteria should be considered for the monochromator or spectrograph:Spectral resolutionDepends on the slit width, focal length and dispersion of the grating and should be about3 nm. Measurements with poor spectral resolution can lead to errors, particularly fornarrow band LEDs.Wavelength accuracyShould be better than 0.5 nm. Wavelength deviations have linear effect on peak andcentroid wavelength, but errors of 1 nm also lead to similar deviations in calculating thedominant wavelength for red a
Handbook of LED Metrology INSTRUMENT SYSTEMS GmbH Version 1.1 page: 4 Irradiance Irradiance E e is obtained from the ratio of the radiant power d Φe and the area of the detector dA. It is expressed in watts per square meter [W/m 2]. The following relationship between radiant intensity I e and irradiance E e for a p