Transcription
LIBRARIESICHIMOKU CLOUD LIBRARYPlanetary 2 LibraryIntroduction:In 1969, Goichi Hosada, a journalist in Tokyo, developed a very versatile indicator that haswithstood the test of time. The Ichimoku Cloud, is also known as Ichimoku Kinko Hyo, whichtranslates into “One glance equilibrium chart.” The indicator defines support and resistance,identifies trend direction, gauges momentum, and provides trading signals. It can also be usedwith western indicators to help confirm their signals. The Ichimoku Cloud can lookoverwhelming at first, however it is very straightforward, the concepts are easy to understand,and its signals are clearly defined.This library is included for Platinum Club members, and may be purchased separately for theGold version of Trade Navigator.Benefits:Commodity Traders: Commodities traders can benefit from this versatile indicator that definessupport/resistance, identifies trend direction, and gauges momentum. Trends can be identifiedusing the Ichimoku Cloud, then, classic momentum oscillators can be used to identifyoverbought or oversold conditions.Forex Traders: In fast moving currency markets, Forex traders can identify the trend and lookfor potential signals within that trend with a quick glance.Stock Traders: The Ichimoku Cloud is usable during range bound markets, and its performanceoften improves when used over longer time frames.TN ‐L IB ‐0 21 ‐1011Page 1Ichimoku Cloud Library
LIBRARIESIncluded in this Library:Templates Ichimoku Cloud ‐ Prebuilt chart layout which replaces your chart’s current indicatorswith the Ichimoku Cloud settingsStudies Ichimoku Cloud ‐ Prebuilt group of functions which adds the cloud settings to an existingchartIndicators Chikou Span ‐ represented on the charts as the close of today's price action shifted back26 days or periodsKijun Line ‐ For showing momentumSenkou Span A ‐ plotted 26 periods in the future and forms the faster Cloud boundarySenkou Span B ‐ plotted 26 periods in the future and forms the slower Cloud boundaryTenkan Line ‐ For showing momentumFunction Descriptions:Tenkan‐sen:The default setting is 9 periods and can be adjusted. On a daily chart, this line is the mid pointof the 9 day high‐low range, which is almost two weeks.Kijun‐sen:The default setting is 26 periods and can be adjusted. On a daily chart, this line is the mid pointof the 26 day high‐low range, which is almost one month).Senkou Span A:This is the midpoint between the Conversion Line and the Base Line. The Leading Span A formsone of the two Cloud boundaries. It is referred to as "Leading" because it is plotted 26 periodsin the future and forms the faster Cloud boundary.Senkou Span B:On the daily chart, this line is the mid point of the 52 day high‐low range, which is a little lessthan 3 months. The default calculation setting is 52 periods, but can be adjusted. This value isplotted 26 periods in the future and forms the slower Cloud boundary.Chikou Span:Close plotted 26 days in the past. The default setting is 26 periods, but can be adjusted.TN ‐L IB ‐0 21 ‐1011Page 2Ichimoku Cloud Library
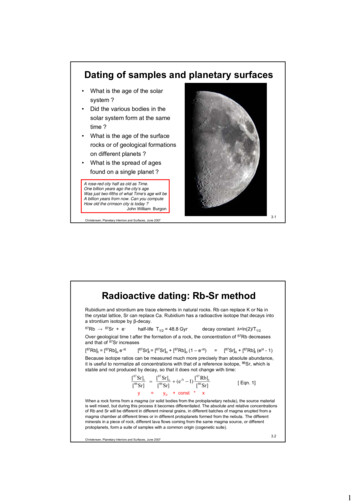
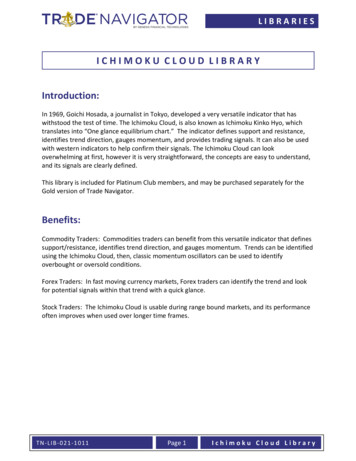
LIBRARIESThe Cloud or“Kumo” is the mostdominating featureof this type ofchart. The SenkouSpan A (green),which is theaverage of theKijun and Tenkanlines, and theSenkou Span B(red), based off the52 day high to lowrange, form theCloud. Due to thefact that Hosada'sidea was to have a“one look chart,”there are two quick ways to determine the overall trend using the Cloud.First, when market is above the Cloud the overall trend is bullish and when the market fallsbelow the Cloud, the trend is bearish.Secondly, the uptrend is also bullish when the Senkou Span A is rising and above the SenkouSpan B, which will produce a green Cloud.Bullish signals appear in the opposite formation, the Senkou Span A is falling and below theSenkou Span B, which will create a red Cloud. Span A and Span B are also used as support andresistance, since the Cloud is shifted 26 days, it identifies possible areas of future support andresistance.TN ‐L IB ‐0 21 ‐1011Page 3Ichimoku Cloud Library
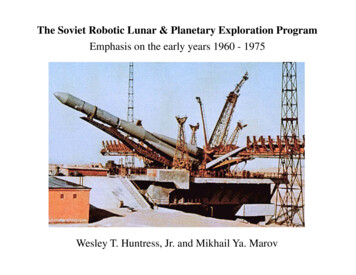
LIBRARIESThis chart showsthe S&P 500 Index(Trade NavigatorSymbol: SPX) on adaily bar period.The market hasbroken above thecloud and Span A isrising above Span Bcreating a bullishtrend in the market.In this chart itshows the DowJones IndustrialAverage (TradeNavigator Symbol: DJIA) on a dailybar period. Themarket has brokenbelow the cloudand Span A is fallingbelow Span Bcreating a bearishtrend in themarket.TN ‐L IB ‐0 21 ‐1011Page 4Ichimoku Cloud Library
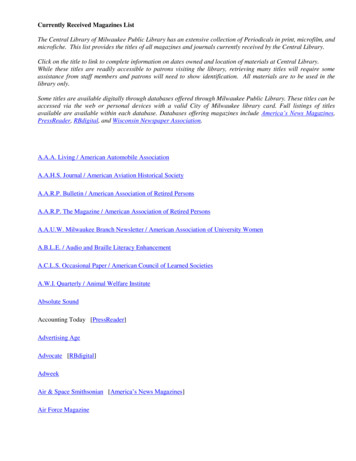
LIBRARIESTenkan‐sen and Kijun‐sen SignalsThe Tenkan (blue) and Kijun (red) lines are based off of the high to low range of the last 9 and26 days. Much like the MACD, these lines are useful for showing momentum in the market. Thetheories behind these lines are used much like a crossover in the MACD. For example, a bullishsignal the market must be above the Cloud and the Span A line must be rising above the Span Bline. With a strong bullish signal an investor should look for a cross of the Tenkan line above theKijun line. If this happens in the Cloud it can be considered a mild to medium signal, however, ifthis occurs above the Cloud it is considered a medium to high signal. If the cross above happensbelow the Cloud the signal is no longer valid due to the fact the market will be trading intoresistance.Moving on to the bearish signals, the market should be below the Cloud and the Span A line isbelow the Span B line, therefore, there is a bearish trend in the market.Investors should identify a crossover of the Tenkan line below the Kijun line for a valid signal. Ifthe cross below happens above the Cloud the signal is no longer valid due to the fact themarket will be trading into support. Where this crossover happens, can tell the investors, thestrength of the trend or if the trend will continue.Below is a chart of the Euro FX Futures Contract (Trade Navigator Symbol: G6E‐067) based on adaily bar. In this chart the Cloud turns from red to green signaling a possible change in trend.Once the market breaks above the Cloud and the Tenkan line crosses above the Kijun line abullish signal is confirmed. The Tenkan Line also starts to pull away from the Kijun line as thetrend gets stronger.Some investorsprefer to hold theirpositions until theTenkan like crossesbelow the Kijunline, this indicatesthe trend is losingstrength andtrading back intosupport.TN ‐L IB ‐0 21 ‐1011Page 5Ichimoku Cloud Library
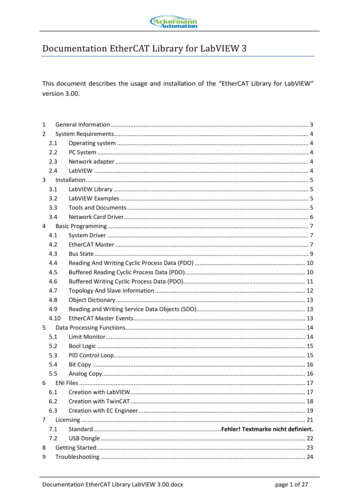
LIBRARIESThis is a chart of theForex pairing of theU.S. Dollarcompared to theJapanese Yen(Trade Navigatorsymbol: USD‐JPY)based on a dailybars.The first crossover of the Tenkan line below the Kijun line occurs at the top of the cloud. Oncethe market closes outside of the cloud a downtrend is confirmed. The Tenkan line then crossesback above the Kijun line and the market is held at Span A where there is resistance. Themarket continues to ride the Span A line for a couple of weeks. Then the Tenkan crosses onceagain below the Kijun line and closes outside of the cloud, for a re‐entry signal. In a largerdowntrend these signals can be very rewarding to investors.Market and Kijun‐sen SignalsThe market will often pull back to the Cloud and meet resistance or support. In this case whatan investor should be looking for is the market to cross the Kijun line (red). This indicates thatthe market is either overbought or oversold. A bullish signal, the market will meet the Cloudbullish signals and then pull back under the Kijun line. This shows that the market is in a shortterm oversold area within a larger uptrend. Once the market breaks above the Kijun line thebullish trend can continue.Often an investor can enter into the market based on this signal or wait for the Tenkan line tocross above the Kijun line, for a confirming signal. The market must line up with the Cloud'sbearish signals and the market should bounce above the Kijun line for bearish signals. This tellsinvestors that the market is in a short term overbought areas within a larger downtrend.After the market pulls back below the Kijun line the bearish signal occurs. Again, the investorcan enter into the market with the break below the Kijun line or wait for a confirming crossoverof the Tenkan line below the Kijun line.TN ‐L IB ‐0 21 ‐1011Page 6Ichimoku Cloud Library
LIBRARIESThis chart showsVerizonCommunicationsInc. (TradeNavigator Symbol:VZ) on a daily bar.The overall trend inthe market is upwith the marketbeing above thegreen Cloud. Themarket then pullsback to the Cloudand closes belowthe Kijun lineshowing the markethas reached a shortterm oversold area.The market stays in the Cloud for a couple of days then closes above the Kijun line and abovethe Cloud. A few days after the Tenkan line then crosses the Kijun line for a confirmation signal.This chart showsChicago Wheat(Trade NavigatorSymbol: W2‐067)based on a dailybar. The overalltrend in the marketis down when themarket reaches atipping point. Themarket then crossesover the Kijun line,signifying an area ofoverbought. Theprices try to reachthe Cloud but nevermake it and thencross below theKijun line in mid‐March, soon after the Tenkan line crosses below the Kijun line to confirm thebearish move.TN ‐L IB ‐0 21 ‐1011Page 7Ichimoku Cloud Library
LIBRARIESIn mid‐April the market turns back into the Cloud and is met at resistance. After a sidewaysperiod in early May the prices move back below the Kijun line and close outside of the Cloud toconfirm another downtrend. Shortly thereafter, the Tenkan line crosses below the Kijun line toconfirm the bearish move.Chikou SpanThe Chikou Span is represented on the charts as the close of today's price action shifted back 26days or periods. Using the Chikou Span as an additional filter can be helpful as well. Forexample, If the Tenkan line crosses above the Kijun line in a bullish trend, the Chikou Spanconfirms the trend if the line is above the cloud. Stronger signals occur when the Chikou Span isabove the price 26 periods ago. The Chikou Span is also used in a similar fashion durning adowntrend. The Chikou Span must be below the cloud and for stronger signals be below theprice action.Confirming BullishSignalTN ‐L IB ‐0 21 ‐1011Page 8Ichimoku Cloud Library
LIBRARIESConfirming BearishSignalSynopsisThere are four basic bullish and bearish signals that are covered with the Ichimoku Cloud.Trend following signals rely on the Cloud formed by Senkou Span A and Span B. Momentum ofthe market focuses on the Tenkan‐sen and Kijun‐sen, that respond similar to the MACD.Overbought and Oversold areas are determined by the market crossing above or below theslower high to low average of the Kijun‐sen line.Investors need to remember that it is important to not get lost in the lines of these charts butto focus on the clear and direct signals that the Ichimoku Cloud indicator can produce. TheCloud offers support and resistance during larger trends and foreshadows what is to come. Asalways, it is more advantageous to take advantage of bullish signals in an uptrend and bearishsignals in a larger downtrend.The Ichimoku Cloud can also be used in conjunction with western indicators. Traders canidentify the trend using the Cloud and then use classic momentum oscillators to identifyoverbought or oversold conditions.TN ‐L IB ‐0 21 ‐1011Page 9Ichimoku Cloud Library
LIBRARIESBullish Signals:Price moves above Cloud (trend)Cloud turns from red to green (ebb‐flow within trend)Price Moves above the Kijun Line (momentum)Tenkan Line moves above Kijun Line (momentum)Bearish Signals:Price moves below Cloud (trend)Cloud turns from green to red (ebb‐flow within trend)Price Moves below Kijun Line (momentum)Tenkan Line moves below Kijun Line (momentum)TN ‐L IB ‐0 21 ‐1011Page 10Ichimoku Cloud Library
withstood the test of time. The Ichimoku Cloud, is also known as Ichimoku Kinko Hyo, which translates into “One glance equilibrium chart.” The indicator defines support and resistance, identifies trend direction, gauges mo