Transcription
Value Stream MappingBasics
Learning ObjectivesAt the end of this module, you will be able to: Sketch a basic value stream map Demonstrate basic value stream analysis Recognize steps for process improvementusing value stream mapping and analysisVSM Basics V7.6 - Slide 2 2012 Massachusetts Institute of Technology
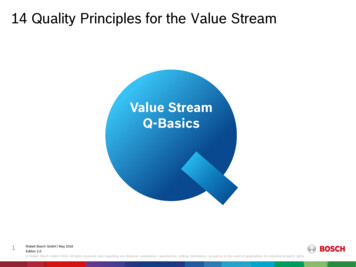
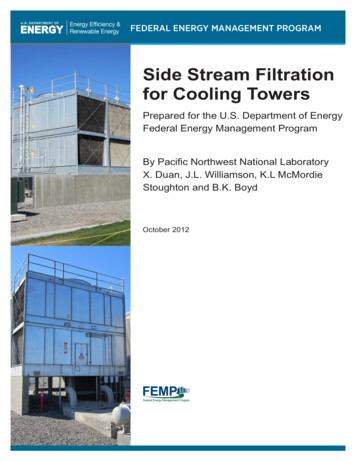
Hot Dog Stand Process Map 11 - Clean upImage by MIT OpenCourseWare.1- Take order10 - Set up2Inorder9 - Deliver tocustomer8 - Addbeverage3 - Get orderCook dogs7OrderOK?NoYes6OutorderYes4 - Put in bun,wrap, add fruitNo5Anotherdog?How can Sasha and Andy improve their productivityto meet growing customer demand?VSM Basics V7.6 - Slide 3 2012 Massachusetts Institute of Technology
Five Lean ThinkingFundamentals Specify value: Value is defined by customer in terms ofspecific products and services Identify the value stream: Map out all end-to-end linkedactions, processes and functions necessary fortransforming inputs to outputs to identify and eliminatewaste Make value flow continuously: Having eliminated waste,make remaining value-creating steps “flow” Let customers pull value: Customer’s “pull” cascades allthe way back to the lowest level supplier, enabling just-intime production Pursue perfection: Pursue continuous process ofimprovement striving for perfectionRef: James Womack and Daniel T. Jones, Lean Thinking (New York: Simon & Schuster, 1996).VSM Basics V7.6 - Slide 4 2012 Massachusetts Institute of Technology
Value Stream Map (VSM) A tool used to improve a process by identifying addedvalue and eliminating waste A process map that follows the value creation process “strap yourself to the product (or service)and see where you go” A process map with data added Times: processing, wait, cycleQuality: number of rejectsInventoryResources Number of peopleSpaceDistance traveled Whatever else is useful for analyzing the processVSM Basics V7.6 - Slide 5 2012 Massachusetts Institute of Technology
Steps for Creating a VSM1. Define customer value and the process “Walk” the process to identify tasks and flowsIdentify value-added and waste process steps2. Create the “current state” VSM Gather data on resources, time, quality for each step3. Analyze map to determine opportunities forimprovement Identify bottlenecks and other flow impedimentsBrainstorm actions to eliminate waste and add value4. Create a “future-state” map to visualize thedesired and realistic next state5. Create action plans to move toward future stateVSM Basics V7.6 - Slide 6 2012 Massachusetts Institute of Technology
Step 1: S&A Customer Valueand Process MapCurrent Demand50 customers100 hot dogs Image by MIT OpenCourseWare.1- Take order10 - Set up2Inorder9 - Deliver tocustomerCustomer ValueGood foodFaster service8 - Addbeverage3 - Get orderCook dogs11 - Clean up7OrderOK?No6OutorderYesYes4 - Put in bun,wrap, add fruitNo5Anotherdog?This process map follows the value creation process Value/waste assessed at each process step VSM Basics V7.6 - Slide 7 2012 Massachusetts Institute of Technology
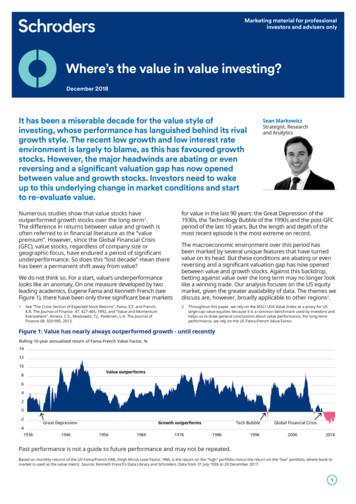
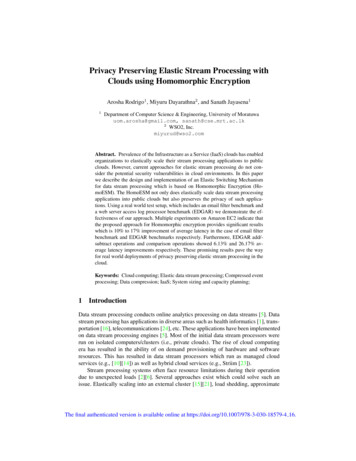
Step 2: Add Data T 48 secImage by MIT OpenCourseWare.Qual 100%T 11 secT 30 secQual 100%Qual 100%1- Take orderQual 90%T 10 secT 60 secQual 100%9 - Deliver tocustomerYes8 - AddbeverageNo – 10%10 - Set upT 48 secQual 100%2InorderT 30 sec3 - Get orderCook dogs7OrderOK?4 - Put in bun,wrap, add fruitT 110 secT 44 secQual 100%Qual 100%11 - Clean up6OutorderT 33 secYes5Anotherdog?NoT 22 secDisplay of relevant data completes basic VSMImages by MIT OpenCourseWare.VSM Basics V7.6 - Slide 8 2012 Massachusetts Institute of Technology
S&A Takt And Cycle TimesCurrent demand50 customersOpen from 10AM - 2PMAvailable time4hrs 60min /hr 4.8min 288 secCustomer demand 50 customersCycle time (summed from previous data) 7.4 min 446 secTakt time Valid alternate calculation –assume setup/cleanup is done “when things are slow”10 - Set up11 - Clean upAvailable time4hrs 50min /hrTakt time 4.0min 240 secCustomer demand 50 customersCycle time (excluding set up & clean up) 5.8 min 350 secCycle time takt time, but two workers – can demand be met?VSM Basics V7.6 - Slide 9 2012 Massachusetts Institute of Technology
Step 3: Value Stream AnalysisSashaAndyImage by MIT OpenCourseWare.Image by MIT OpenCourseWare. With your team, take 15 minutes to Calculate the total Value added time Non value added time Wait time Calculate the total “touch time” that Sasha andAndy spend on a single order Be ready to report your answers to the classVSM Basics V7.6 - Slide 10 2012 Massachusetts Institute of Technology
Utilization and CapacityVAT is only slightly over 50% Opportunities for improvementAvailable time 4 hours 240 minWorktime: Touch time per order X number of ordersSasha’s tasks:/60 min X 50 cust. minAndy’s tasks:/60 min X 50 cust minUtilization: Worktime / time availableSasha’s: ( min / 240 min) X 100% %Andy’s: ( min / 240 min) X 100% %Capacity: Time available / touch time per orderAndy working at 100% (240min X 60) / sec VSM Basics V7.6 - Slide 11 2012 Massachusetts Institute of Technology
Utilization and CapacityVAT is only slightly over 50% Opportunities for improvementAvailable time 4 hours 240 minWorktime: Touch time per order X number of orders133 minSasha’s tasks:159 /60 min X 50 cust. Andy’s tasks: 224 /60 min X 50 cust 187 minUtilization: Worktime / time available55133Sasha’s: ( min/ 240 min) X 100% %Andy’s: ( min/ 240 min) X 100% %18778Capacity: Time available / touch time per order22464Andy working at 100% (240min X 60) / sec We will consider complications like varying orders orirregularly spaced customers in the Variation ModuleVSM Basics V7.6 - Slide 12 2012 Massachusetts Institute of Technology
Summary - S&A Value StreamAnalysis (VSA) Current production (50 customers) is a little belowcurrent capacity (64 customers) of Andy and Sasha Andy and Sasha are both underutilized Process improvement needed to meet growingdemandBut utilization is not balanced between themCycle time of 7.43 min per customer(or even 5.8 min) too long Should be able to shorten cycle time to meetdemands of customers for faster serviceBottom LineSasha and Andy should implement processimprovement for week 3 to meet growing demand!VSM Basics V7.6 - Slide 13 2012 Massachusetts Institute of Technology
Improvement BrainstormSashaAndyImage by MIT OpenCourseWare. Image by MIT OpenCourseWare.Help Sasha and Andy figure what to improve How can utilization be improved?How can cycle time be reduced?What has to be done to serve 75 customers?What has to be done to serve 100 customers?VSM Basics V7.6 - Slide 14 2012 Massachusetts Institute of Technology
Brainstorm Bursts 11 - Clean upImage by MIT OpenCourseWare.1- Take order9 - Deliver tocustomer8 - Addbeverage7NVAOrderInspectionOKYesNo10 - Set up2InOrder3 - Get orderCook dogsBalanceWork?4 - Put in bun,wrap, add fruit6OutOrderYes5NVAAnotherdogInspection?NoVSM Basics V7.6 - Slide 15 2012 Massachusetts Institute of Technology
Steps for Creating a VSM1. Define customer value2. Create a “current state” map “Walk” the process to identify tasks and flowsGather data on resources, time, quality for each3. Analyze map to determine opportunities forimprovement Identify value-added and wasteBrainstorm actions to eliminate waste and add value4. Create “future-state” map to visualize the desiredstate5. Create action plans to move towards future-stateVSM Basics V7.6 - Slide 16 2012 Massachusetts Institute of Technology
Why is VSM a Useful Tool? Helps visualize interactions and flows Shows linkages between information and productflows Provides a common language for talking about aprocess Helps to identify: the constraint(s) - any resource whose capacity isless than customer demand;wastes as well as their sourcesAdapted from: M. Rother and J. Shook, Learning to See, Lean Enterprise Institute, 1998VSM Basics V7.6 - Slide 17 2012 Massachusetts Institute of Technology
Tips for Creating a VSM Involve entire team Actually walk the process - follow the materialand information through the process, startingat the beginning Use Post-it notes and butcher paper Use symbols or icons that are meaningful tothe process but common enough to beunderstood by all involvedVSM Basics V7.6 - Slide 18 2012 Massachusetts Institute of Technology
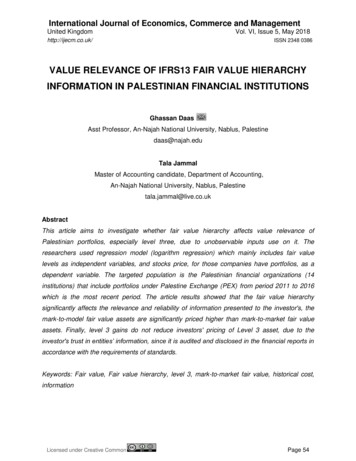
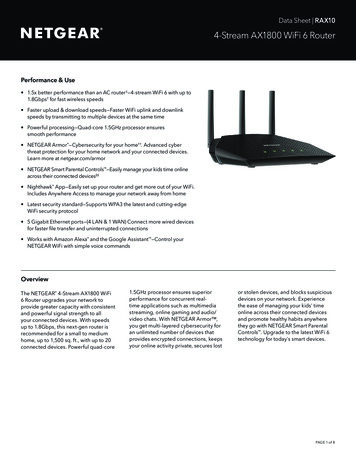
“Industrial Strength” ExampleJefferson Healthcare Clinic - Current State MapOVERALL CLINIC DATAEXTERNALPROVIDERSReceptionReception- Cancel by reason - see chart A- Payor mix – commercial 38%ROSV1- # of Pts on panel – 5997- Days out for first 3rdSalmonreminder(PTFP)Document delays – 2%Scriptsvisit – 3.75EnterpriseObtainDemographics“mini-reg” &Send Call patientto scheduleInput t forvisitRoom &performvitals, etc.ReceptionRN2.219.11.6- Schedule on 1 st call – 0%EnterprisePre-reg,Schedule, &Send packetReg PktV2Reception- Schedule on 1 st call – 100%- # of Pts on panel 5886- Days out for new visit - tient- # of Pts on panel - 5998- No shows – 2%- On-time starts – 37%- Days out for first 3 rd visit 2.00- On-time starts – 37%- Time by diagnosis – Chart D- Days out by provider- see chart C- Document delays – 12%- Volume by hour – Chart EEMRMediTechMediTechReferralsCheck-outpatientWalk tohospitalRegister forAncillaryServicesHOSPTIALAncillary ServicesHospitalRegistration4.8 walkor rMD, PA31.29.7- Volume by Diagnosis – See chart BEXTERNALPHARMACIES- Days out by provider - See CReg PktV2- Satisfaction – overall 74.4Visit ClinicPhone callPhone call- Schedule on 1 st call – 0%- Market share - Hospital 46.7%eWait forex provtoreturninfoInputMed HistoryPATIENTPhone callEMRrghaReceptionEnterpriseReceiveMed History& Call toSchedulescDiWait forpt toreturnpacketRequestMedHistoryrecordsPATIENT DATA- Volumes - 131 visit/dayDischargeReceptionMedHistorygeReg PktV1- Utilization 88%- Available hours per day – 67harReceive call& Sendregistrationpacket- Contact Hours 59/day- Avg. Pts per hour - 1.83DiscEnterprise- Blocked Hours – 67/day- Cost per visit - 125.3914.0L/T2.32.1- Referral volume – 14.5 %3.1C/T- Volumes by service – 13.0%- Lead-time by service - variesROSV2Input MedHistoryfollowingCheck-inReception- Document delays – 30%LEGEND PTFP Scheduling Hospital Services OPC Scheduling Patient JMPG Scheduling Patient on schedule Clinic flow (all sites)- Days out by provider – See Chart CDays out for first 3 rd visit – 1.16Courtesy of Jefferson Healthcare, Port Townsend, WA. Used with Permission.VSM Basics V7.6 - Slide 19 2012 Massachusetts Institute of Technology
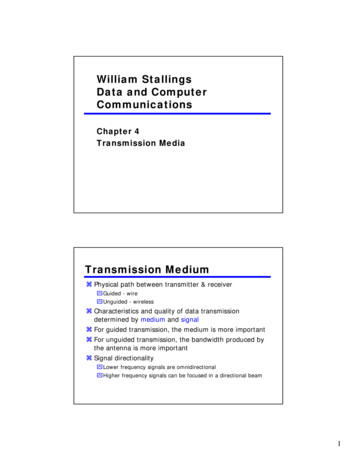
OrganizationAdditional Graphic Elements“Swim Lanes” organize tasksby time and organizationTime“Castle Wall” shows task and wait timesTTWTTTWTTTWTSUMSWTTTMany ways to clarify the processand present data in easy-to-understand formCourtesy of Jefferson Healthcare, Port Townsend, WA. Used with Permission.VSM Basics V7.6 - Slide 20 2012 Massachusetts Institute of Technology
More InformationCourtesy of Lean Enterprise Institute. Used with permission.VSM Basics V7.6 - Slide 21 2012 Massachusetts Institute of Technology
Reading ListJimmerson, C., Value Stream Mapping for Healthcare MadeEasy, Productivity Press, New York, NY, 2010McManus, H., “Product Development Value Stream Mapping(PDVSM Manual)”, Release 1.0, Sept 2005. Lean AdvancementInitiative.Rother, M. and Shook, J. Learning to See, v1.2, The LeanEnterprise Institute, Cambridge, MA June 1999VSM Basics V7.6 - Slide 22 2012 Massachusetts Institute of Technology
AcknowledgementsContributors Sharon Johnson – Worcester Polytechnic Inst. Jose Macedo – Cal Poly San Luis Obispo Hugh McManus – Metis Design Ted Mayeshiba – USC Earll Murman – MITVSM Basics V7.6 - Slide 23 2012 Massachusetts Institute of Technology
MIT OpenCourseWarehttp://ocw.mit.edu16.660J / ESD.62J / 16.853 Introduction to Lean Six Sigma MethodsIAP 2012For information about citing these materials or our Terms of Use, visit: http://ocw.mit.edu/terms.
Let customers pull value: Customer’s “pull” cascades all the way back to the lowest level supplier, enabling just-in-time production . Steps for Creating a VSM . 1. Define customer value and the process “Walk ” the process to identify tasks and flows Identify value-added and waste process steps . 2. Create the “current state” VSM Gather data on resources, time .