Transcription
10/21/2013MaximizedValue Stream MappingTheory and practical applicationcase studyChristopher MartinChristopher Martin Production planning supervisor at Case IH– Process improvement specialist with over 2decades of exposure: production operations planning, materialsmanagement and control, process improvement,database/systems design and development– Project activity in support of fabrication, welding,painting and assembly on several production lines. President – Central Nebraska APICS Chapter1
10/21/2013Elements to Cover Value stream mapping – definition/theoryCurrent state mapAction plan to future stateFuture state mapCase Study – VSM at the Case IH Grand Islandfacility Workshop – Video Console VSMWhat is Value Stream MappingVSM: process of mapping the primary materialand information flows in converting rawmaterial to finished product or creating a serviceof value that a customer is willing to pay for.Levels that can be mapped:Process : Plant : Multiple plants: Cross company2
10/21/2013Benefits of VSM Visualize entire processCommon languageDemonstrates links between operationsFlow decisions easy to identifyWaste identifiedContinuous improvement tool - iterationsVSM Primary Maps Current state map– How we are today including key measurement andcommunication flows Future state map– Where we plan to be a year or two from nowbased on proposed process improvement activity3
10/21/2013Steps to a Current State Map Walk the process – start upstreamEstablish customer requirementsDetermine major product familiesPick a primary flow and major productWalk again, measure key elements, countinventory Draw current state mapEstablish Customer Requirements Define takt time – pieces per day, week,month, year – rate customer requires product– 21 units per day in 8 hours, 100% utilization Factor 0.5 hr lunch, 2 - 15 min breaks Avaliable time 7 hours 420 mins– 420/ 21 20 min takt time Goal is to produce 1 unit every 20 mins4
10/21/2013Determine Major Product and Flow Delineate major processes– Simplify but cover major steps in the flowOrderIngredientsReceiving32Take OrderPrepare Bill21Payment Process2Mix IngredientsBake PizzaCut/ Box PizzaSort for DeliveryPut in Warmer21232Get IngredientsMeasurePrepare Boxes222Mix IngredientsBake PizzaCut/ Box PizzaSort for Delivery2123Measure Process Data Typical data to measure – varies with product– Cycle Time : Changeover time : Uptime : Lead time– EPE – 'leveled' production time : Scrap rate– # of Operators : Pack size : Available time Use smallest time measurement feasible forproduct – seconds, minutes, hours, days5
10/21/2013Determine system triggers/ Info flow Examples of symbols used:ElectronicWithdraw KanbanInformationProduction KanbanPullKanban PostPushSupermarketCustomer/ SupplierProcessShipping TruckData TablePrimary elements to consider VA - value added activity– impacts the fit, form or function of a product orservice that a customer is willing to pay for – eginstall gas cap on tank NVA - non value added activity– elements in the conversion process that adds novalue to the product or service – eg move gas capto point of installation6
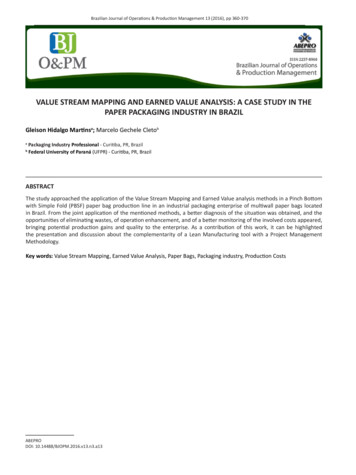
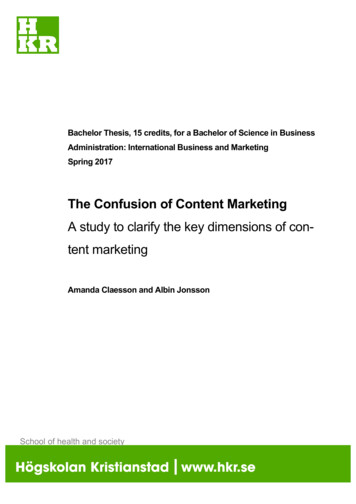
10/21/2013Draw Current State Map – eg: PizzaProduction ControlTake orders, prepare bils, order rawmaterials, issue instruction to make pizzaSuppliersCustomersCash/ CC ReceiptDailyBillsOnce Per WeekTicketsMix IngredientsBake PizzaBox PizzaDailySort for Delivery2123IICycle Time: 5 minsCycle Time: 25 minsCycle Time: 2 minsCycle Time: 3 mins# of Employees: 2# of Employees: 1# of Employees: 2# of Employees: 3Shifts: 3.Shifts: 3Shifts: 3Shifts: 37 Days0 Days5 mins0 Days25 mins0 Days2 mins0.25 Days3 mins7.25 Days35 minsReview map for process inefficiencies Waste – 7 primary symptoms of problems- Over-production : Waiting : Transportation- Inventory : Motion : Over-processing : Defects-NVA vs VA timeOver or under taktPush systemsLine balance7
10/21/2013Ask Primary Questions What is causing the waste?Where can we use continuous flow or pull?Where is best to trigger production?What is the bottleneck?How do we improve the bottleneck?How do we level production?Determine Plan of Action Implement kanbanAdd kitting areas with kit cartsUse standard packaging from suppliersBalance lines and reallocate resourcesRearrange work stations for efficiencyMix model production where feasible8
10/21/2013List opportunity to improve – eg Pizza Implement electronic signalsIncrease frequency of deliveryReduce raw material inventory valueImprove efficiency of boxing operationsIncrease speed of deliveryDraw Future State Map – eg PizzaProduction ControlTake orders, prepare bils, order rawmaterials, issue instruction to make pizzaCustomersSuppliersCash/ CC ReceiptBillsHourlyOrderScreenTwice Per WeekMix IngredientsBake 3 DaysCycle Time: 5 minsCycle Time: 25 mins# of Employees: 2# of Employees: 1Shifts: 3.Shifts: 3Pre-makeboxesCut/ Box PizzaDailySort for Delivery13Cycle Time: 0.25 minsCycle Time: 3 mins# of Employees: 1# of Employees: 3Shifts: 3Shifts: 3IMake Box1Boxes3 Days3 Days0 Days(1 mins - internal)0 Days5 mins0 Days25 mins0 Days0.25 mins0.10 Days3 mins3.10 Days33.25 mins9
10/21/2013Develop Project Plan/ Kaizen Journal Add key responsible persons Add timelines with milestone measurements Develop teams – include primary operatorsCase Study: Case IH – Grand Island10
10/21/2013Case Study – Case IH – Grand Island Case IH is a global leader in agriculturalequipment. With headquarters in the UnitedStates, Case IH has a network of more than4,900 dealers and distributors that operates inover 160 countries.– Corporate WebsiteThe Challenge: Grand Island Plant 2 major product lines and 7 minor productsOver 200,000 pieces installed dailyManufacturing in 4 buildingsWarehousing 2 miles awayVarying production shiftsSuppliers from all over the globe11
10/21/2013The Challenge – complex layout/ paceMain Spine for AssemblyFabricationFeeder LinesSupermarketsSub-Areas etcWeldMain Paint – 1 of 3systemsThe Challenge – Product & Process Major value product – Axial Flow Combine– 3 major models, 20 model variations, thousandsof option combinations Major process flow– Welding and assembly in multiple buildings usingmultiple paint systems. Several lines supportmajor product with complex movement of parts.12
10/21/2013The Decision Product– Pick high volume model AFX High Capacity Process– Pick major component that travels majorprocesses – fab, weld, paint, assemble, ship Grain TankThe Decision: ComponentsComponent Growth13
10/21/2013The Decision: PathMain Spine for AssemblyFabricationFeeder LinesSupermarketsSub-Areas etcWeldMain Paint – 1 of 3systemsMeasurements Primary measurements taken– Cycle time : Area lead time : Utilization– Takt time – different paces due to mixed model vsdedicated lines– Inventory : EPE : Changeover time– Number of shifts/associates14
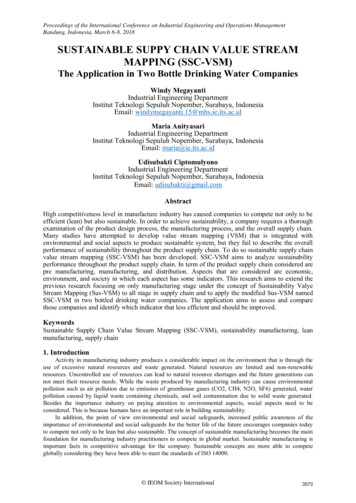
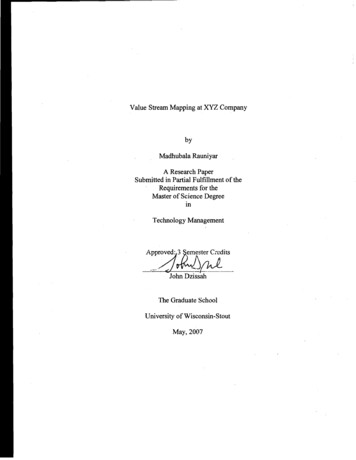
10/21/2013Current State Map – 2009Central Planning6 week FrozenOrder sequenceWeekly requirements1 yr forecastSuppliersCustomersMRPWeeklyDailyMRP/ leanFloleanFloBuild Card/Line set SheetBuffer – 0 to 2 unitsLaser Cut2.5 DaysForm0.5 days0.80 hrsWeld6 days0.03 hrsPaint0.3 days0.95 hrsGT AssemblyUMF LineMain/ Trim1 day4.84 hrs3 Days5.06 hrs3.1713.3 days6.01 hrs20.86 hrs2009 observation highlights High inventory especially pre-assembly areasDelays across lines despite Andon systemImbalance/overtime /high cycle timesExcessive transportationComplicated electronic signals difficult tomatch with physical movement15
10/21/2013Challenges to Future State beyond 09 Reduce inventory while doubling outputBalance lines to reduce resource waste/taktImprove material delivery flow/reliabilityLink major lines for continuous flowOptimize fabrication operationsUse world class manufacturing (WCM) asprimary driverFuture State Map 2013 - increased volCentral Planning6 week FrozenOrder sequenceWeekly requirements1 yr forecastSuppliersCustomersKanban pullsfrom WHMRPWeeklyDailyMRP/ leanFloDynamicNestingleanFloSMED onBrakesLaser CutBuild Card/Line set SheetMixedmodel GTFormWeldPaintBuffer – 0 to 2 unitsGT AssemblyUMF LineMain/ TrimFIFOKanbanflowSequencedpull fromSMReduceWIP fromSteelsupplierReducedFleetImplementFIFO2.0 Days0.5 days0.80 hrs2.5 days0.03 hrs0.1 days0.45 hrsReducedTakt acrossassembly0.5 day4.84 hrs1.87 hrs1.33 hrs0.3 Days4.8 hrs5.9 days14.12 hrs16
10/21/2013Overall results Almost doubled output with same shift planReduced lead time/inventory by 7.4 daysReduced cycle time by 40%Reduced assembly takt by 50%Millions saved due to improvement activityChanged overall culture of the plantChallenges to the next Future State Continue expansion to all major componentsReduce inventory between weld and fabOptimize paint and fabrication operationsContinue line balancing and reduce cycle timeRemove buffers, expand continuous flowConsistently include all associates in changes17
10/21/2013Workshop VSM of a small video game console– Study current system and improve it– Increased demand to 100 units per daySituation at a glance Weekly electronic requirements feedMRP system to control daily ordersPlant ships daily to the customer with delaysSuppliers ship daily to the plantHigh overtime including weekendsStruggle to properly balance workforce18
10/21/2013Plant Specification – 4 work cells– Motherboard – C/T - 10 mins, Inv 50 completed,100 pre-staged boards, 2 associates, 8 hour shift– Console – C/T - 25 mins, Inv 25 completed, 3associates, 8 hour shift– Controller – C/T - 15 mins for controller and 5mins to install to the body, Inv 25 completed, 2associates, 8 hour shift– Test – C/T - 5 mins testing and 5 mins to package,Inv 75 completed packages, 2 associates, 8 hourshiftAction Items Complete a current state map based on yourplant observations Review this map and develop a proposed setof actions to improve the production system Complete a future state map based on yourrecommendations19
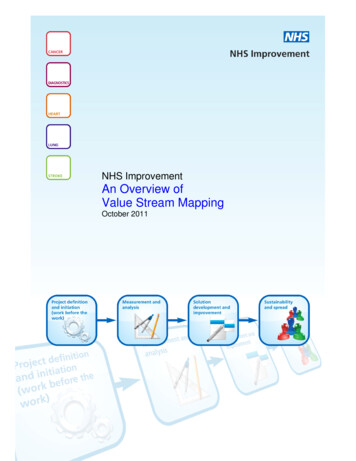
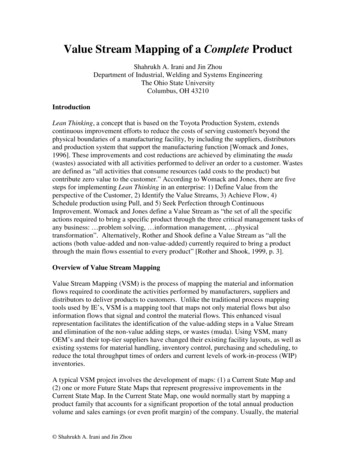
10/21/2013Current State Map – Video ConsoleProduction ControlWeeklyCustomers100/ DaySuppliersDailyDailyDaily RequirementsMotherboardConsoleController232I25 pcs50 pcsTest225 pcsI75 pcs100 pcsCycle Time: 10 minsCycle Time: 25 mins# of Employees: 2# of Employees: 3install: 5 minsShift: 8 hoursShift: 8 hoursTotal: 20 mins1 Days0.5 Days10 minsCycle Time: cont 15 minspack – 5 minsTotal – 10 mins# of Employees: 2# of Employees: 2Shift: 8 hoursShift: 8 hours0.25 Days25 minsCycle Time: test – 5 mins0.25 Days20 mins0.75 Days10 mins2.75 Days65 minsActions to improve to Future State Reduce cycle times towards 4.8 min taktReduce inventoryImprove pace operation – console assemblyImprove transportation to customerBalance lines to streamline and achieve pullStreamline raw material delivery20
10/21/2013Future State Map: Video ConsoleProduction ControlWeeklyTakt Time8*60100 4.8 minsSuppliersVaryfrequencyto paceCustomers100/ DayChangetrucking CoDaily RequirementsMilk RunMilk runCycle rdConsoleController232TestFIFO350 pcsMin - 10 pcsMax – 25 pcsAdd kanbantriggeredreplenishmentI25 pcsMin - 10 pcsMax – 25 pcsCycle Time: 10 minsCycle Time: 20 minsCycle Time: cont 15 mins# of Employees: 2# of Employees: 3# of Employees: 2Shift: 8 hoursShift: 8 hoursShift: 8 hours2 stationsCycle Time: test – 5 minspack – 5 minsinstall – 5 mins# of Employees: 3Shift: 8 hours0.5 Days0.25 Days10 mins0.25 Days20 mins0.25 Days15 mins15 mins1.25 Days55 minsRestrictSupermarketThank YouChristopher MartinChristopher.martin@cnh.com(308) 379-8980 or (308) 850-6443LinkedIn :http://www.linkedin.com/profile/view?id 12189482521
10/21/2013Surveyhttp://tinyurl.com/lr3pjct22
Value Stream Mapping Christopher Martin Production planning supervisor at Case IH – Process improvement specialist with over 2 decades of exposure: production operations planning, materials management and control, process improvement, database/systems design and developme