Transcription
THE JOURNAL OF FINANCE VOL. LXV, NO. 5 OCTOBER 2010Hedge Fund Contagion and Liquidity ShocksNICOLE M. BOYSON, CHRISTOF W. STAHEL, and RENÉ M. STULZ ABSTRACTDefining contagion as correlation over and above that expected from economic fundamentals, we find strong evidence of worst return contagion across hedge fund styles for1990 to 2008. Large adverse shocks to asset and hedge fund liquidity strongly increasethe probability of contagion. Specifically, large adverse shocks to credit spreads, theTED spread, prime broker and bank stock prices, stock market liquidity, and hedgefund flows are associated with a significant increase in the probability of hedge fundcontagion. While shocks to liquidity are important determinants of performance, theseshocks are not captured by commonly used models of hedge fund returns.USING MONTHLY HEDGE FUND INDEX DATA for the period January 1990 to October2008, we find that the worst hedge fund returns, defined as returns that fallin the bottom 10% of a hedge fund style’s monthly returns, cluster acrossstyles. Further, using both parametric and semi-parametric analyses, we showthat this clustering cannot be explained by risk factors commonly used toexplain hedge fund performance. Bekaert, Harvey, and Ng (2005 p. 40) definecontagion as “correlation over and above what one would expect from economicfundamentals.” With this definition, the clustering we observe is contagion. Toour knowledge, this is the first study to test for and document the existence ofhedge fund contagion.To understand the determinants of hedge fund contagion, we turn to a recent paper by Brunnermeier and Pedersen (2009) for theoretical motivation. Intheir model, an adverse shock to speculators’ funding liquidity (the availabilityof funding) forces them to reduce their leverage and provide less liquidity tothe markets, which reduces asset liquidity (the ease with which assets trade).When the impact of the funding liquidity shock on asset liquidity is strongenough, the decrease in asset liquidity makes funding even tighter for speculators, causing a self-reinforcing liquidity spiral in which both funding liquidityand asset liquidity continue to deteriorate. An important implication of their Boyson is at Northeastern University, Stahel is at George Mason University and the FDIC, andStulz is at The Ohio State University, NBER, and ECGI. We wish to thank Nick Bollen, StephenBrown, William Greene, Cam Harvey, David Hsieh, Andrew Karolyi, Andy Lo, Marno Verbeek, anAssociate Editor, two referees, and participants at seminars and conferences at the CREST-Banquede France conference on contagion, the ECB, the FDIC, Imperial College, Maastricht University,The Ohio State University, RSM Erasmus University, UCLA, the 2009 AFA annual meeting, the2009 WFA annual meeting, Villanova University, and Wharton for useful comments. We are alsograteful to Rose Liao and Jérôme Taillard for research assistance. We thank Lisa Martin at HedgeFund Research for assistance regarding her firm’s products.1789
The Journal of Finance R1790study is that these liquidity spirals affect all assets held by speculators thatface funding liquidity constraints, leading to commonality in the performanceof these assets. Discussions of the recent credit crisis emphasize the role of liquidity spirals, such as the impact of the subprime crisis on margins that led toa sharp reduction in liquidity in many if not most asset markets by the secondhalf of 2008, when the clustering of hedge fund worst returns we documentis most dramatic.1 Because hedge funds are quintessential speculators of thetype envisaged by Brunnermeier and Pedersen (2009), their model can be usedto guide an investigation of contagion among hedge fund styles. Their modelpredicts that shocks to asset liquidity and hedge fund funding liquidity leadto poor performance of assets in which hedge funds are marginal investors,and hence to hedge fund contagion. While the predictions of their model maybe most significant during a severe financial crisis like the credit crunch thatbegan in 2007, we study periods of coincident poor performance in hedge fundssince 1990 and show that large adverse shocks to asset and hedge fund fundingliquidity make hedge fund contagion more likely.We use monthly hedge fund index return data from Hedge Fund Research(HFR) for eight different hedge fund styles to investigate the existence of hedgefund contagion. Since hedge fund returns are autocorrelated and affected bya number of risk factors, we first filter the raw hedge fund returns usingAR(1) models augmented with factors from Fama and French (1993), Fungand Hsieh (2004), and Agarwal and Naik (2004). We then use the residuals(i.e., “filtered returns”) from these models in our analysis. Using the filteredreturns should strongly reduce the possibility that we attribute to contagionclustering due to exposure to commonly known risk factors or to autocorrelationin monthly returns, but it does so at the cost of perhaps making our analysistoo conservative. In particular, the analysis would be too conservative if thefactors themselves were affected by contagion, so that through our filtering weeliminate part of the effect of contagion. Consistent with this concern, we findthat our results are typically stronger without the filtering.Our first test of contagion uses the filtered data in a quantile regressionanalysis. The quantile regression estimates the conditional probability that avariable falls below a given threshold (quantile) when another random variableis also below this same quantile. Advantages to this approach are that it putsno distributional assumptions on the data, it may be estimated for a large rangeof possible quantiles, and it allows for heteroskedasticity. Using this approach,we show that for all quantiles below the median, the conditional probabilitythat a given hedge fund style’s returns will be in the same quantile as theequally weighted average of all other hedge fund styles’ returns is much higherthan would be expected if there were no dependence, providing strong evidenceof clustering in filtered below-median returns. Strikingly, there is no evidenceof clustering for above-median returns.Next, we implement a parametric test of contagion, a logit model that hasbeen previously used in the literature (see Eichengreen, Rose, and Wyplosz1 SeeBrunnermeier (2009).
Hedge Fund Contagion and Liquidity Shocks1791(1996), and Bae, Karolyi, and Stulz (2003)). Our analysis, which is performedseparately for each hedge fund style index, uses as the dependent variablean indicator variable set to one if the index of interest has a return in thebottom decile (a “worst return”) of that index’s entire time series of returns,and zero otherwise. The key independent variable for this analysis is COUNT,which ranges in value from zero to seven and is defined as the number of otherhedge fund styles that have worst returns in the same month. The logit resultsare consistent with the quantile analysis in that the coefficients on COUNTare positive and statistically significant for all eight hedge fund style indices.Hence, both the semi-parametric and parametric approaches provide evidenceof clustering in worst returns that cannot be attributed to autocorrelation inreturns or to changes in factors commonly used to explain hedge fund returns,or in other words, contagion.The second part of the paper investigates whether shocks to asset liquidityand hedge fund funding liquidity increase the probability of contagion. For thisinvestigation, we identify variables for which an extreme adverse realizationis likely associated with a tightening of asset liquidity and hedge fund fundingliquidity. We call these variables contagion channel variables. These variablesinclude the Chordia, Sarkar, and Subrahmanyam (2005) measure of stock market liquidity, a measure of credit spreads, the TED spread, returns to banksand prime brokers, changes in repo volume, and flows to hedge funds. We investigate whether extreme adverse shocks to the contagion channel variablescan explain hedge fund contagion using a multinomial regression analysis.The dependent variable is a measure of the intensity of contagion. To modelextreme adverse shocks for each of the contagion channel variables, we createdummy variables set to one when the corresponding channel variable experiences a large adverse shock that decreases liquidity (defined as a realizationin the worst 25th percentile for that variable) and zero otherwise. Since we usemonthly data, it is not obvious how quickly shocks to contagion channel variables will be reflected in hedge fund performance. We therefore perform twoseparate analyses for each of the contagion channel shock dummy variables,one in which the shock is measured contemporaneously and one in which theshock is lagged one month. We find that both contemporaneous and laggedchannel shock dummies are linked to high levels of contagion intensity acrosshedge fund styles.Since we show that liquidity shocks are strongly related to hedge fund contagion, our final analysis examines whether our finding of contagion couldbe due to an omitted liquidity risk factor in the initial filtering regressions.The idea of liquidity as a risk factor is consistent with work by Amihud (2002),Pástor and Stambaugh (2003), Acharya and Pedersen (2005), and Chordia et al.(2005). To test this idea, we add to the initial filtering process innovations tothe continuous measures of the contagion channel variables. We find that whilemost of the coefficients on the innovation factors are statistically insignificant,the coefficient on TED spread innovations is negative and significant for five ofthe eight hedge fund indices, indicating that hedge fund returns are negativelyimpacted by widening TED spreads. However, despite the addition of these new
1792The Journal of Finance Rfactors to the filtering process, results from the logit models (that use the residuals from this process) still provide strong evidence of contagion, and resultsfrom the multinomial regressions still indicate a strong relationship betweenshocks to liquidity and contagion, with the exception that shocks to the TEDspread have a somewhat weaker effect. Thus, while commonly used models ofhedge fund returns do not capture the exposure of hedge funds to large shocksto liquidity, this exposure cannot be accounted for by simply adding changes inliquidity proxies to these models.To our knowledge, we are the first to document the existence of contagionin hedge fund returns, after controlling for autocorrelation and common riskfactors. Additionally, we are the first to link hedge fund contagion to liquidityshocks, and thus to provide an initial test of the Brunnermeier and Pedersen(2009) model. In a related paper, Adrian and Brunnermeier (2009) use quantileregressions to document the increase in a measure of the risk of financial institutions, that is, value-at-risk (VaR), conditional on other financial institutionsexperiencing financial distress. They explain financial institution VaR contagion using various factors including credit spreads, repo spreads, and returnson the main markets. In a recent paper, Dudley and Nimalendran (2009) investigate correlations among hedge fund styles conditional on extreme returnsof hedge fund styles and find support for a role for funding liquidity. Consistentwith our finding that shocks to bank stock performance increase the probability of hedge fund contagion, Chan et al. (2006) find a positive correlationbetween bank returns (measured using a broad-based bank index from CRSP)and hedge fund returns. Billio, Getmansky, and Pelizzon (2009) examine hedgefund risk exposures in a regime switching model and show that when volatilityis high, the four strategies they examine have exposures to proxies for liquidity and credit risk, consistent with our results that shocks to credit spreadsincrease the probability of hedge fund contagion. Finally, while we use indexdata and find contagion across hedge fund styles, Klaus and Rzepkowski (2009)use individual fund data and provide evidence of contagion effects within hedgefund styles.The paper is organized as follows. In Section I we describe the data forthe hedge fund index returns and the explanatory variables. Section II usesmonthly hedge fund indices and documents contagion within the hedge fundsector. Section III examines possible economic explanations for hedge fundcontagion using a number of contagion channel variables. Section IV examinesthe possibility that our contagion results are driven by an omitted variable. Weattempt to interpret our results and conclude in Section V.I. Hedge Fund DataThe hedge fund style returns are the monthly style index returns provided byHFR. The returns are equally weighted and net of fees. The indices include bothdomestic and offshore funds. These data extend from January 1990 to October2008 for a total of 226 monthly observations. There are eight single-strategyindices: Convertible Arbitrage, Distressed Securities, Event Driven, Equity
Hedge Fund Contagion and Liquidity Shocks1793Hedge, Equity Market Neutral, Global Macro, Merger Arbitrage, and RelativeValue Arbitrage.2 These indices include over 1,600 funds, with no requiredminimum track record or asset size. Additionally, these indices are not directlyinvestible; that is, they include some funds that are closed to new investors. Toaddress backfilling and survivorship bias, when a fund is added to an index, theindex is not recomputed with past returns of that fund. Similarly, when a fundis dropped from an index, past returns of the index are left unchanged. We usethe HFR database for the analyses we report in the paper, but we also repeatall our tests using the Credit Suisse/Tremont indices, since recent researchsuggests that funds sometimes migrate from one database to another and thatno database provides comprehensive coverage of all funds.3 Results using thelatter indices are reported in the Internet Appendix.4II. Tests for Contagion Using HFR Index DataA. Filtering the Index DataA preliminary review of the raw hedge fund index data in the Internet Appendix indicates relatively high positive correlations among hedge fund styles,significant autocorrelation within hedge fund styles, and significantly nonnormal returns. For example, simple correlations range from a low of 0.27between Convertible Arbitrage and Global Macro indices to a high of 0.83 between Distressed and Event Driven. In addition, the correlations between thehedge fund indices and the Russell 3000 index are also high, ranging from 0.32for Equity Market Neutral to 0.75 for Equity Hedge. Ljung-Box autocorrelation tests reject the null hypothesis of no autocorrelation for up to six lags atthe 1% level for all indices except Merger Arbitrage, which is significant atthe 2% level. Finally, Jarque-Bera tests indicate that for all indices the nullhypothesis of normally distributed returns is rejected at the 1% significancelevel.To control for the exposure to common risk factors, we regress the returnsof each style individually on a number of variables. We use these factors hereso that in later tests we do not mistakenly attribute to contagion correlations in returns that are related to common risk factors, consistent with ourdefinition of contagion as correlation over and above that expected based oneconomic fundamentals. To control for broad market exposure, we use threemarket factors: an equity market index (the Russell 3000), a broad-based bondindex (the Lehman Brothers bond index), and a broad currency index (thechange in the trade-weighted U.S. dollar exchange rate index published bythe Board of Governors of the U.S. Federal Reserve System), as well as thereturn on the 3-month T-bill. We include the monthly change in the 10-yearconstant maturity Treasury yield and the change in the monthly spread of2 Seewww.hedgefundresearch.com for definitions of each style category.Fung and Hsieh (2009).4 An Internet Appendix for this article is available online in the “Supplements and Datasets”section at http://www.afajof.org/supplements.asp.3 See
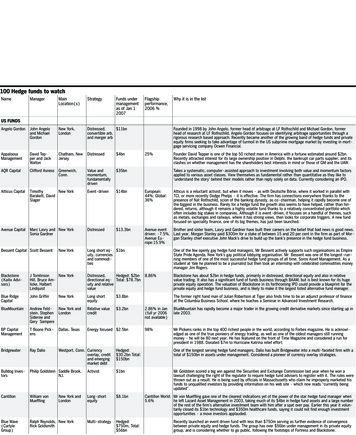
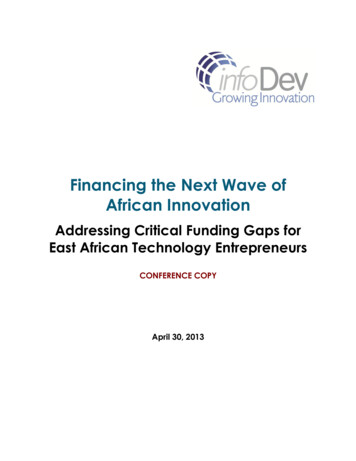
1794The Journal of Finance RMoody’s Baa yield over the 10-year constant maturity Treasury yield, based onFama and French (1993) and Fung and Hsieh (2004). We also use ABS (assetbased strategy) factors and a size spread factor (Wilshire Small Cap 1750monthly return minus Wilshire Large Cap 750 monthly return), both fromFung and Hsieh (2004).5 The ABS factors are lookback straddles on bonds,currencies, commodities, short-term interest rates, and equities. We also include the negative portion of the S&P 500 to proxy for a put option, basedon Agarwal and Naik (2004). We received the ABS factors from William Fungand David Hsieh; all other factors are from Thomson Datastream. Finally, weuse an AR(1) term in each model to control for autocorrelation. The residuals from these filtering models are then used in our analyses. The regressionresults (see the Internet Appendix) indicate that the explanatory variablesare relevant in explaining the performance of hedge funds, with adjustedR2 values ranging from 0.23 for Equity Market Neutral to 0.79 for EventDriven.Table I presents summary statistics, autocorrelations, and normality testsfor the filtered residuals. Comparing these results to the raw data, there is asignificant decrease in correlations among hedge fund indices. The correlationsbetween filtered hedge fund indices and the filtered Russell 3000 index alsodrop dramatically. Finally, autocorrelation has been reduced greatly as onlythree of the eight indices exhibit significant autocorrelation, as compared toseven out of eight for raw returns.B. Contagion Tests Using Quantile RegressionsWe next investigate whether hedge fund indices exhibit excess correlationsin the tails of the distributions, using the filtered index data. We use twodifferent approaches for the investigation. The first approach uses quantileregressions, which make it possible to estimate the probability of a given hedgefund return conditional on the performance of all other hedge fund indices. Thesecond approach uses logit regressions. The two approaches provide consistentresults.Based on a quantile regression approach, we show visually the existence ofcontagion among hedge fund styles using a so-called “co-movement box” as inCappiello, Gérard, and Manganelli (2005).6 The quantile regression estimatesthe conditional probability that a random variable yt falls below a given quantile qY,θ conditional on a different random variable xt also falling below thesame quantile qX,θ . In an unconditional setting the probability Pr(yt qY,θ )is by definition equal to θ , but the conditional probability is different fromθ when the two variables are not independent. Other financial studies usingthe quantile regression approach include Koenker and Bassett (1978), Engle5 See, for example, Fung and Hsieh (1997, 1999, 2001, 2004), Ackermann, McEnally, and Ravenscraft (1999), Liang (2004), Mitchell and Pulvino (2001), and Agarwal and Naik (2004).6 Much of the following description of the model follows Cappiello et al. (2005). For further detailon quantile regressions and the co-movement box, see Cappiello et al. (2005).
Table IConvertible arbitrageDistressed securitiesEvent drivenEquity hedgeEquity market neutralMerger arbitrageGlobal macroRelative valueRussell 3000 returnReturn on LB bond Index in FRB Dollar IndexMedianStandard deviationSkewnessExcess kurtosis0.30 1.00 0.0470.9530.3302.336 0.0400.906 rageEquityHedgeEquityMarketNeutralMergerArbitrage 0.0021.268 0.0983.8420.0060.7850.0190.3190.0570.827 1.2195.0250.31 0.541.000.25 0.27 0.34 1.000.15 0.19 0.20 0.35 1.000.27 0.33 0.49 0.000.16 1.00Panel B: Simple Correlations0.0220.8740.2141.401Panel A: Summary StatisticsEventDrivenHFR Hedge Fund Indices0.050.27 0.40 0.43 0.14 0.081.000.0101.7500.1200.571GlobalMacro0.49 0.49 0.40 0.31 0.25 0.26 0.14 1.00 .00 0.010.000.001.000.5374.220 0.7571.730Russell3000Index 0.03 0.01 0.010.02 0.01 0.030.01 0.020.16 1.000.0981.006 0.4450.650Return onLB bondIndex(continued) 0.03 0.010.000.010.000.01 0.01 0.030.15 0.22 1.000.0201.002 0.4680.917 in FRBDollarIndexMain Market FactorsSummary statistics for monthly data on filtered returns for eight HFR monthly hedge fund indices and three market factors used in the paperare reported below. The indices include Convertible Arbitrage, Distressed Securities, Event Driven, Equity Hedge, Equity Market Neutral, MergerArbitrage, Global Macro, and Relative Value and are described more fully in Section II. The market factors are from Datastream and include thereturn on the Russell 3000 Index, the change in the Federal Reserve Bank competitiveness-weighted dollar index (the FRB Dollar Index), and thereturn on the Lehman Brothers U.S. Bond Index. The number of observations is 224. Correlations between the variables, the autocorrelations, aswell as Jarque-Bera test statistics for normality are reported below the summary statistics. A indicates significance at the 5% level.Summary Statistics of Filtered Monthly Returns on HFR Indices and Market Factors:January 1990 to October 2008Hedge Fund Contagion and Liquidity Shocks1795
Jarque-Bera Testp-valueLjung-Box test utralMergerArbitrageGlobalMacro15.3 0.0251.6 0.00747.8 0.004.80.5716.7 0.013.20.7918.5 0.00130.2 0.000.80.68277.6 0.00Panel D: Jarque Bera Normality Test8.80.193.20.2016.3 0.01Panel C: Autocorrelation Test for Significance at Six eHFR Hedge Fund IndicesTable I—Continued226.1 ex––––Return onLB bondIndex–––– in FRBDollarIndexMain Market Factors1796The Journal of Finance R
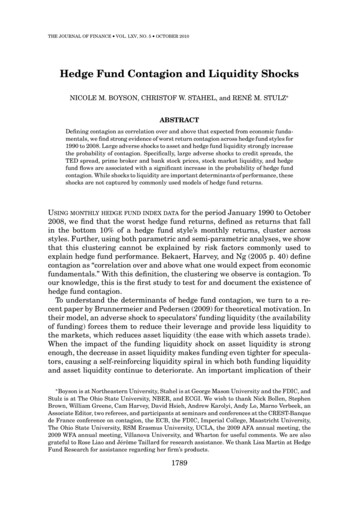
Hedge Fund Contagion and Liquidity Shocks1797and Manganelli (2004), and Adrian and Brunnermeier (2009). The conditionalprobability is easily estimated through an OLS regression using quantile coexceedance indicators.7 Advantages to this semi-parametric methodology arethat OLS estimates are consistent and that no distributional assumptions needbe imposed on the data, which allows for heteroskedasticity.The estimated co-dependence is plotted in a co-movement box, which is asquare of unit side where the conditional probabilities are plotted against quantiles. When the plot of the conditional probability lies above (below) the 45 line,which represents the unconditional probability of no dependence between thevariables, there is evidence of positive (negative) conditional co-movement between xt and yt . In our analysis, yt represents the return on an individual hedgefund index, while xt is the equally weighted average return on all other hedgefund indices. Results from the analysis are presented in Figure 1. To constructthe figure, we calculate the probabilities at the 1st and 99th quantiles, as wellas for 5% increments between the 5th and 95th quantiles. These results providestrong evidence that the conditional probability of a hedge fund index having areturn in any quantile below the 50th percentile is increased significantly whenthe equally weighted index of other hedge fund returns is also below the samequantile. For example, at the 10th quantile, the Event Driven index has abouta 55% probability of being in the 10th quantile when the equally weightedindex of other hedge fund styles is also in the 10th quantile, compared to anunconditional probability of 10% if there were no dependence.Importantly, this conditional probability for quantile returns above the 50thpercentile is close to (and often lower than) the unconditional probability ofno dependence. The co-movement box thus illustrates an asymmetry in thedata: when returns are low, dependence among hedge fund indices increasesbut there is no corresponding increase when returns are high. Although theresults hold for all indices, they are strongest for the Equity Hedge and EventDriven styles and weakest for the Equity Market Neutral style.These results provide preliminary evidence of contagion among poor returnsin hedge fund indices. However, it is difficult to interpret the statistical significance of this analysis. We next perform logit analyses to further test forcontagion in the sense that we directly estimate the probability of an extremereturn in a hedge fund style conditional on whether other hedge fund stylesexperience extreme returns.C. Contagion Tests Using a Logit ModelFor the logit model tests of contagion, we use a lower 10% cutoff of theoverall distribution of returns to identify worst returns among hedge fundstyles (i.e., returns that are in the bottom decile of all returns for an index’sentire time series). Since there are 224 observations for each style, we have 23worst returns for each style. A 5% cutoff gives only 11 observations, too few for a7 Co-exceedancequantile).occurs when both random variables exceed a pre-specified threshold (i.e.,
1798The Journal of Finance RFigure 1. Co-movement box: Relationship between individual hedge fund index performance and average of all other hedge fund indices. The estimated co-dependence betweenthe return on an individual hedge fund index and the equally weighted average return on all otherhedge fund indices is estimated using a quantile regression approach, and the results are plottedin a co-movement box. This box is a square of unit side that plots the conditional probability thata hedge fund index has a return below or above a certain percentile conditional on the same eventoccurring in an equally weighted average of all other hedge funds. This plot of conditional probability is graphed for each index at 5th percentile increments. When the plot of the conditionalprobability lies above (below) the 45 line, which represents the unconditional probability of nodependence between the variables, there is evidence of positive (negative) co-movement betweenthe two variables.meaningful analysis, but the results from Figure 1 indicate that there is nothingspecial about the 10% cutoff in that we find strong evidence of clustering for allquantiles below the median. The logit model is a parametric test that addressesthe issue of contagion by estimating whether a given hedge fund style is morelikely to have a worst return when other styles also have worst returns. Logitmodels have been used extensively in the contagion literature (see, for instance,Eichengreen et al. (1996), and Bae et al. (2003)).
Hedge Fund Contagion and Liquidity Shocks1799Table IIContagion Tests Using Filtered Return DataThe event of a worst return in each hedge fund style is separately modeled as the outcome of abinary variable and estimated as a logit regression. The independent variable is COUNT, whichtakes a value from zero to seven and is the number of other hedge fund indices that also haveworst returns for the month. Below the coefficients are the t-statistics in parentheses. R2 MAX isthe scaled coefficient of determination suggested by Nagelkerke (1991). Coefficients with , ,and are statistically significant at the 1%, 5%, and 10% levels, respectively.Convertible DistressedArbitrage SecuritiesEventDrivenEquityHedgeEquityMarket MergerNeutral ArbitrageGlobalMacroConstant 2.62 2.97 3.07 2.96 2.62 2.83 2.51 ( 7.73)( 7.91)( 7.16) ( 5.82) ( 8.47) ( 7.16) ( 6.64)Other hedge fund index indicator variable0.73 0.81 COUNT0.46 (2.70)(3.82)(3.71)0.73 (2.78)R2 MAX16.47.718.120.30.45 (2.94)8.00.63 (3.19)13.80.36 (1.86)4.5RelativeValue 3.01 ( 8.90)0.77 (4.45)20.5The dependent variable is an indicator variable set to one if the hedge fundindex under study has a filtered return in the bottom decile of all returns forthat index and zero otherwise. To measure the extent of clustering of worst returns, we add the variable COUNT, which is equal to the number of hedge fundstyles—other than the style whose performance is under study—that have aworst return in the same month. A positive and significant coefficient on thisvariable indicates that worst returns for a particular style cluster with worstreturns in the other styles. Results are presented in Table II.8 The coefficientson COUNT are always positive and statistically significant, providing strongevidence that returns cluster across hedge fund styles. These results are consistent with the co-movement box from Figure 1.9 In reaching this result, weattempt to explain hedge fund style worst returns using a large number offactors from the literature and controlling for autocorrelation in hedge fundreturns, yet these factors do not explain the clustering we observe. As a result,we believe this clustering can be referred to as contagion, where contagion is8 We relax the distributional assumptions underlying the logit models and allow for overdispersion by adjusting the standard errors when estimating the regressions.9 As a robustness check, we also perform an analysis that includes as an independent variablethe 10% winsorized equally weighted return on all other hedge fund indices except the indexunder study. We also include indicator variables based on the main market variables from thefiltering exercise (stocks, bonds, and currencies) that are set to one if the main market variablehas a 10% negative tail return, and we include measures of volatility from the main markets sinceprior literature suggests that volatility itself may be related to clustering. Coefficients on the mainmarket indicator variables are not consistent in sign or significance, indicating no evidence ofcontagion from main markets to hedge funds. Also, coefficients on the volatility variables and theequally weighted hedge fund variable are rarely significant. Most important, seven of the eightcoefficients on the COUNT variable remain positive and statistically significant at the 5% level
hedge fund returns do not capture the exposure of hedge funds to large shocks to liquidity, this exposure cannot be accounted for by simply adding changes in liquidity proxies to these models. To our knowledge, we are the first to document the existence of contagion in hedge fund returns,