Transcription
Hedge fund investing indistressed securitiesCapturing the unique valuecreated by corporate andeconomic turnaroundsApril 2008Research, Analysis and Strategy Group Current stressed/distressed market environment offersample trading opportunities for hedge funds The implicit value of distressed securities is often significantlyThomas Della CasaMark Rechsteinerhigher than the prevailing market priceAyako LehmannInvesting early is better than lateThe team can be contacted at:MICH-RASG@maninvestments.comA member of Man Group
Table of contentsExecutive summary.3Growth of the credit market .4The credit cycle .5Recent developments (Summer 2007 until March 2008) .7Introduction to the credit/distressed universe .8Distressed securities . 9Distressed hedge fund investing.9Distressed universe . 11Investment strategy . 11Sub-strategies within distressed hedge fund investing.13Active versus passive . 13Outright short . 14Long/short . 14Capital structure arbitrage . 14Value/ Deep value . 16Rescue financing. 17Performance characteristics of distressed hedge funds .17Credit outlook – it may get worse before it gets better.22Conclusion .24Appendix .25Hedge fund investing in distressed securities2 / 25
Executive summaryThe sharp correction in the US subprime market in mid-2007 was the catalyst for what has been a near perfectstorm in global credit markets. Competing fears of recession, default, inflation and the possible collapse of alarge financial institution and subsequent fire-sale of their loan book helped chase liquidity from the market andlead to a substantial re-pricing of all forms of credit risk.Distressed securities are primarily debt securities which originate from companies that are in the process ofreorganisation or liquidation under local bankruptcy law, or companies engaged in other extraordinarytransactions such as balance sheet restructurings. Distressed securities typically trade at a yield-to-maturity ofmore than 1,000 bps over US Treasuries (UST) or below 80 cents on the dollar. Looking at the US high yieldmarket today approximately USD 200 billion, or 28%, would be considered distressed, up from only USD 8 bn ayear ago. Trading in distressed securities is highly inefficient, partly because of forced selling. A hedge fundspecialising in credit is often able to purchase securities at a substantial discount to its intrinsic value.In this paper, we briefly examine the historical growth and the cyclical nature of credit markets. Then we focuson recent developments and provide an overview of distressed hedge fund investing. Finally, we touch on thelikely outcome of the current credit crisis and discuss how hedge funds can profit. We base our analysis on theUS high yield and leveraged loan market which, despite the growth of other market sectors in recent years,remains the largest and most actively traded distressed securities market.Currently, the leveraged loan market trades below its previous cyclical lows whereas the high yield market is inbetter shape. Hence, at current prices, the loan markets offer a more compelling opportunity. We examined theprevious bear market in 2002 to estimate the best time to enter the distressed market and found compellingevidence that investing early, before the bottom, offers more upside than investing late. Therefore, werecommend increasing allocations in anticipation of a J-curve like recovery. It is not necessary to pick thebottom of the market to generate above-average returns.Readers should also keep in mind that distressed managers do not solely play the credit market cycle. Whilethey tend to perform better during bull markets (by harvesting their ‘investment seeds’) they can also makemoney in downturns, for example with outright shorts and hedges. Additionally, turbulent markets often deliverpricing opportunities that will improve future performance.Hedge fund investing in distressed securities3 / 25
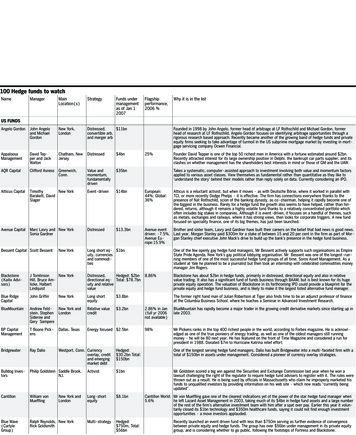
Growth of the credit marketFor the purpose of this report, we concentrated on the two largest corporate debt markets: high yield bondsand leveraged loans (bank debt of non-investment grade companies). While some distressed funds also includestructured credit products (such as mortgage backed securities), trade claims, leases, receivables vendorfinancing and other debt-like instruments, most managers focus on loans and high yield bonds.Since the vast majority of managers solely invest in the US, we will not cover European or Asian distressedtopics. In the US, the bankruptcy process is consistent and well established whereas in Europe and Asia eachcountry is different and laws are often ambiguous.In the US a distressed opportunity typically arises when a company, unable to meet all its debts, files forChapter 11 (reorganisation) or Chapter 7 (liquidation) bankruptcy. Chapter 7 involves shutting a company’sdoors and parcelling out its assets to its creditors. Chapter 11 gives the company legal protection to continueoperating while working out a repayment plan, known as a plan for reorganisation, with a committee of its majorcreditors.At the end of 2007, the high yield market was worth USD 888 bn and the leveraged loan market USD 1,061 bn.While the high yield market has not grown since 2002, the loan market has grown rapidly during the last fewyears and last year overtook the high yield market for the first time.Figure 1: Growth of the US high yield market 1977 – 2007New Issue VolumeHigh Yield Market SizeSource: Credit Suisse. *As at 31 December 2007. Includes non-investment grade USD-denominated straight corporate debt. Floating rateand convertible bonds and preferred stocks are not included.Figure 2: Growth of the US institutional leveraged loan market 1989 – 20071061New Institutional Loan VolumeInstitutional Loan Market Size746426472366332255 1634 258 23 1453884512655145501413217622522324111864Source: Credit Suisse. As at 31 December 2007. Includes USD-denominated grade fully-drawn term loans.Hedge fund investing in distressed securities4 / 25
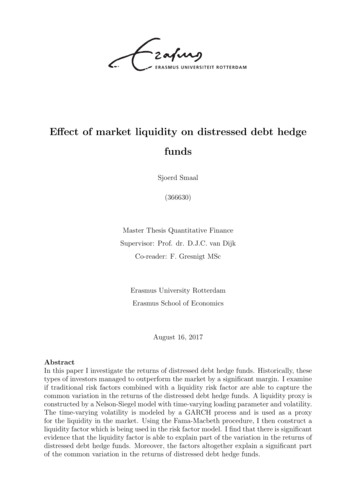
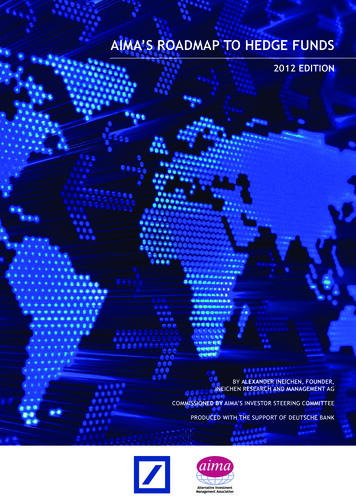
The rapid growth of the loan market during the last few years has occurred on the back of a boom in largeleveraged buyout deals, often financed by issuing leveraged loans. At the height of the credit boom lastsummer, over 30% of all M&A deals in the US were announced by private equity firms.The credit cycleCredit markets are cyclical and generally follow the economic cycle. As can be seen in the figure below, therewere two significant bear markets in credit before and during the last two US recessions (1989/90 and2001/2002). The default rate always lags the credit spreads (credit risk spreads over US Treasuries (UST),spreads to worst, STW) as the market prices in the estimated default rates for the subsequent 18-24 months.Historically, spreads have been a leading indicator of economic weakness and widened before the economicdownturn was evident.When the economy is healthy, as it was from 2003-2006, default rates decline and risk spreads tighten. Thisenvironment is supportive for long credit strategies as investors benefit from rising bond prices and falling creditspreads in addition to the current income from coupon payments. When spreads widen, as in the late 1980s,2001/2002 and H2 2007/YTD 2008, credit risk is re-priced and while the current default rate is still low, higherfuture default rates are priced in. Credit spreads are sensitive to liquidity which is a leading indicator to equitiesand the economy. Therefore leveraged loans are usually the first to correct, followed by high yield bonds andeventually equity markets. Please keep in mind that high yield bonds, as any fixed income investment, exhibit aninverse relationship between price and yield.Figure 3: Default rate versus high yield spreads18.0 %High-yield spreadsHigh-yield default rate125016.0 %14.0 %10.0 %25-year average 4.2%5006.0 %4.0 %2502.0 %00.0 -02Dec-03Dec-04Dec-05Dec-06Dec-07Default rate8.0 %750Spread to worst (bps)12.0 %100021-year average 535bpSource: JPMorgan, Default Monitor March 2008. January 1987 to March 2007.As at 31 March 2008, STW are at 794 bps. This is still some way below the previous two peaks of around 1,000bps, but significantly higher than last summer. The average default rate has been 4.2% and average creditspreads 535 bps since 1987. It is important to keep in mind that spreads do not follow the economic cycleexactly. For example during 2002 spreads widened as the economy was recovering, primarily due to accountingfraud (Enron, WorldCom) and larger issues of corporate disclosures. Usually, spreads peak at the end of arecession or closely thereafter (e.g. 1980, 1991).Hedge fund investing in distressed securities5 / 25
It is also worthwhile to compare the credit cycle to equities. Both are risky asset classes and exhibit sensitivity tothe economy. However, they can be in different stages with respect to risk appetite. The next graph shows thefour different phases of the credit market cycle.Figure 4: The credit/equity cycle (prices)Source: Citi Investment Research/Datastream, Man Investments.Phase 1:Credit spreads tighten (i.e. credit markets rise) while equity markets still fall: Most interestingphase to be long distressed or credit risk in general as STW quickly come in. Balance sheetsare being repaired and troubled companies restructured. In this situation credit outperformsequities.Phase 2:Credit spreads continue to tighten while equity markets are rising: Everybody is happy andvolatility across all asset classes is low or declining.Phase 3:Credit spreads are rising (i.e. credit markets fall) while equity markets still rise: Late stage of theequity bull market as credit enters the emerging bear market. In this phase, corporate debtstarts growing faster than profits and volatility is increasing. During the current cycle, this phaselasted only four months as equities peaked in October 2007 while credit markets began theirdecline in July.Phase 4:Both equity and credit are in a bear market (current phase): This phase is bad for all risky assetclasses. During this phase, investors can slowly build up exposure in the credit markets beforephase 1 begins again. Entering the markets in this phase can yield the best future returns butrequires patience as initial returns are often negative (J-curve or U curve).Hedge fund investing in distressed securities6 / 25
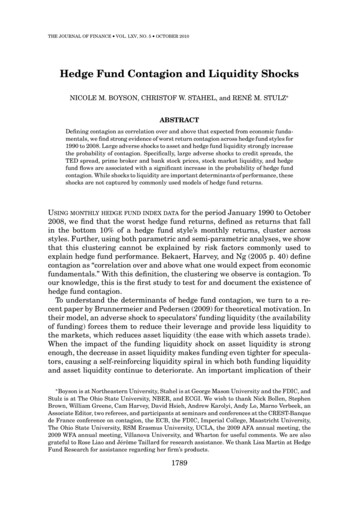
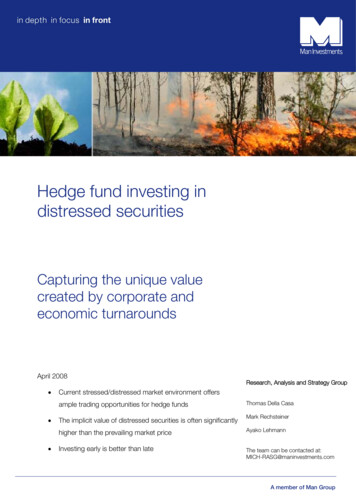
Figure 5: US equities and high yield spreads (with phases indicated)180012503412341234160010001400S&P 50012007501000800500S&P 500 050607Spread to worst (bps)US High YieldSpreads (RHS)60008Source: Citi Investment Research. January 1988 to 27 February 2008.We think that this framework, although simplistic, is extremely helpful in demonstrating the cyclical nature ofequity and credit markets. Moreover, an understanding of where we are in this cycle will help forecast futuretrends. Late phase 4 and early phase 1 are the best periods to invest. Since we are in phase 4, we think that itis an appropriate time to begin slowly building exposure in credit markets. Of course, nobody knows how longthis phase will last and it is possible that credit spreads will widen a few hundred basis points more. Theimportant finding is that credit markets lead equity markets, i.e. they usually recover before equity markets do.Currently, credit markets price in a higher probability of a recession than equity markets. Morgan Stanleyestimates that if credit pricing is correct, equities have to undergo a further correction of 10-15% from midMarch levels.Recent developments (Summer 2007 until March 2008)The slowdown in the US housing market in early 2007 had a spill over effect on to structured products thatbundled US home loans. This crisis in US subprime lending triggered a wave of selling in the credit markets inJuly and August 2007. Almost overnight, investors lost their appetite for risk and banks were left with hundredsof billions of unsold loans on their balance sheets. As investors were increasingly pricing in a serious downturn inthe US, risk appetite diminished further and all but the best credits were re-priced. Rating agencies, which wereblamed for being to generous with subprime-related securities, quickly downgraded large quantities of lowerquality paper.Structured credit products, such as CDOs (Collateralised Debt Obligations), became hard to value as marketliquidity disappeared almost completely. During November and December general credit risk was re-priced as itbecame apparent that the problem had spread from Wall Street to Main Street. Forced liquidations were thedriving force in the first quarter of 2008 as credit markets became trapped in a negative spiral. The need toreduce risk forced investors to sell assets into an illiquid market. Those fire sales drove prices down furtherwhich, in turn, prompted more investors to reduce risk. As a result, loan demand was acutely reduced. Thisprecipitated a supply/demand mismatch resulting in the current credit crunch.The leveraged loan market has experienced unprecedented volatility and price declines in a very short period oftime. This has been the result of a number of factors including an overhang of new issuances, theHedge fund investing in distressed securities7 / 25
disappearance of CLOs (Collateralised Loan Obligations) and declining LIBOR rates (the loans’ interest rates aretied to LIBOR). With an assumed recovery rate of 70%, leveraged loans currently trade at prices that reflectdefault levels not previously experienced in the market. Due to technical factors, some loans even trade belowtheir recovery value.Figure 6: Market has re-priced risk in leveraged companiesSource: Underlying manager of RMF Investment Management, a wholly owned subsidiary of Man Group plc/adjusted by Man InvestmentsResearch.Unlike previous credit downturns, leveraged loans have corrected more sharply than more liquid, higher volatilityassets such as high yield bond and equities. This indicates that the current correction is driven primarily byliquidity concerns unlike the historical pattern of volatility led corrections where more volatile assets would adjustto a greater extent than less volatile assets. Hence, while high yield spreads are narrower than 2002 levels,loans are currently wider.The three key factors that have changed since the credit crunch of 1989-90 are disintermediation, availability ofderivatives and the rapid increase in liquidity from 2003-2006. These factors meant financial markets reactedmuch faster and in a more exaggerated fashion to stressful events. In the loan market, for example, pricesdropped much quicker than in previous corrections.Introduction to the credit/distressed universeThe credit/distressed universe primarily consists of debt securities of companies that are in the process ofreorganisation or liquidation under local bankruptcy law, or companies engaged in other extraordinarytransactions such as balance sheet restructurings. Companies can become distressed for any number ofreasons such as: Too much leverage on their balance sheet Liquidity problems Credit downgrades Poor operating performances that require reorganisation Accounting irregularities Inadequate cash flows Competitive pressureTrading in distressed securities is highly inefficient, partly because of forced selling. When a security defaults oris downgraded, investors such as high yield mutual funds, endowments, CLOs and any other investor whosemandates does not permit them to hold such securities are frequently obliged to sell them, often at a discount.The leveraged loan market, for example, has recently witnessed forced selling due to CLO liquidations. Some ofHedge fund investing in distressed securities8 / 25
these vehicles had to unwind positions when prices dropped below USD 90 to remain in compliance with theirinvestment guidelines.The implicit value of distressed securities is often significantly higher than the prevailing market price.Furthermore, sellers may react emotionally in anticipation of a potential bankruptcy and overlook or ignore thecompany’s true worth. In addition, distressed investing requires a highly specialised skill set – most investors donot have the skills or the information required to properly assess the value of a distressed company or its likelyevolution through the bankruptcy process. Those that do can generate outsized returns.Distressed debt investors require strong negotiating skills, asset valuation skills and industry expertise. Theytypically come from a legal background, in which they have had exposure to the bankruptcy process,particularly in the US. In addition, sourcing of and access to distressed deals is often only possible if one has alarge network in this particular investment field.Distressed securitiesThe distressed securities universe is huge and includes all kinds of securities of below investment grade debt.The investments may include high yield bonds, below par/distressed bank loans, debtor-in-possession loans1,second lien notes, seller paper2, trade claims/receivables, ‘busted’ convertibles3 and municipals, credit defaultswaps, credit default indices, preferred stock as well as common stock, rights/warrants, equity ‘stubs’4, PIPES5,collateralised debt, bond and loan obligations, futures, options, swaps and indices, bridge and mezzanine loans,bonds including both corporate and municipal, real estate assets including leasehold interests, among others.The structured credit universe is a different category altogether. It has only been in existence for the last six toseven years and has so far been considered by only a handful of hedge fund managers, as the proper valuationand risks of the structures is fairly complex making it more difficult to analyse arbitrage opportunities.Distressed debt instruments trade at a yield-to-maturity of more than 1,000 bps over US Treasuries or pricesbelow 80 cents of a dollar. As of 31 March 2008 approximately USD 200 bn of the USD 888 bn US high yieldmarket could be considered distressed, up from only USD 8 bn a year ago.Distressed hedge fund investingHedge fund managers focussing on distressed securities tend to perform best during bull markets as they thenharvest profits from the ‘investment seeds’ sown during previous economic downturns and recessions. In thatsense, distressed hedge fund investing has some similarities to private equity investments, where it also takesconsiderable time until profits are returned. Nevertheless, even in a good economy there can be bargains. Theauto and airline sector, for example, offered ample opportunities during 2004-2006 even though the economywas strong. Distressed investing is largely a bottom-up strategy where returns depend less on the overall creditmarket cycle than on company or sector-specific factors.1Debtor-in-possession loans: loans of a company that continues to operate while under the Chapter 11 bankruptcy process.Seller paper: Notes issued by companies, filling the gap in the capital structure after traditional financing sources have been exhausted. Unlike third partyfinancing, terms for seller papers are privately negotiated and thus bear an intrinsic risk.3Busted convertible: convertible trading well below its conversion value.4Equity stubs: Stocks in a company that are over-leveraged as a result of recapitalisation. They are very speculative and risky, but have an unlimited potential ifthe company manages a turnaround.5PIPES: private investment in public equity, i.e. a private company’s or other qualified investor’s purchase of stock in a company at a discount to the currentmarket value per share for the purpose of raising capital.2Hedge fund investing in distressed securities9 / 25
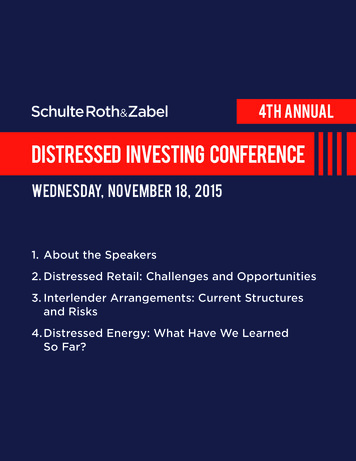
Figure 7: Distressed hedge funds find value across the full credit cycleSource: RMF Investment Management, a wholly owned subsidiary of Man Group plc. Schematic illustration.As the figure above shows, the lifecycle of a troubled company can be broadly divided into five different stages:pre-default, early, mid and late bankruptcy as well as emergence.A company in the pre-default stage is in the process of restructuring its balance sheet, often due to poor riskmanagement. In the early bankruptcy stage, the affected company tries to negotiate an out-of-court exchangeoffer with its creditors. In such a case the company usually offers an equity stake in exchange for an extensionof the debt maturities or even a reduction of debt.During the mid-bankruptcy stage, the company decreases leverage, thereby stabilising its balance sheet. Hedgefund managers often purchase pre-structured debt at this stage.In the late bankruptcy stage, companies have almost recovered and hedge funds purchase post-restructureddebt. The final emergence stage refers to the strong recovery of a company.The majority of strategies employed by distressed hedge fund managers involve investments in ‘belowinvestment grade’ securities. This means that successful strategy and security identification largely depends onthe individual manager’s industry knowledge, bottom-up securities selection expertise and the correctidentification and/or diversification of risks associated with securities. Successful credit/distressed trading thusrequires in-depth knowledge in the following areas: Understanding the true risk and values involved Legal background Previous exposure to the bankruptcy process Restructuring expertise Negotiation skills Correct valuation Large network to source/access distressed dealsHedge fund investing in distressed securities10 / 25
Distressed universeDistressed hedge funds only make up a small portion of the total hedge fund universe. According to HedgeFund Research, 5.64% of the entire hedge fund universe was managed by distressed hedge funds as atDecember 2007. Nevertheless, figure 8 below shows that assets managed by distressed hedge funds havegrown rapidly since 2002, when the credit cycle had its last peak.Figure 8: Estimated growth of assets / net asset flow of distressed hedge funds 1990 – 2007Source: Hedge Fund Research, Inc. Data as at end December 2007.Looking at the whole of 2007, 9.42% of total net hedge fund asset inflow went into distressed hedge funds. Thisfigure is expected to increase quite a bit in 2008, as several hedge fund managers have already indicated thatthey are planning to launch a dedicated credit/distressed fund in order to benefit from the current marketturmoil. As investors are flocking to funds that specialise in distressed debt, competition might dampen returns ifpickings are too slim.Investment strategyMost of the distressed hedge fund managers apply both a top down and bottom up approach for theirinvestment process. The top down approach looks at the development of macro themes whereby potentialinvestment ideas are originated in a number of different ways, including: Monitoring market behaviour and price movements of specific securities Networking with contacts in a variety of industries Networking with contacts on the buy and sell side Monitoring news and other events Reviewing industry journals, research reports and publicationsHedge fund investing in distressed securities11 / 25
During this process, hedge fund analysts try to anticipate specific industries undergoing a) rapid change, b)cyclical recession or c) regulatory adversity in order to determine potentially attractive investment opportunitiesin their target industries.Once these target industries have been identified, a bottom up approach is executed on a company level,whereby fundamental research is carried out. Hedge fund analysts thus: Assess, through quantitative and qualitative analysis, the company’s fundamental business, itscreditworthiness, and its competitive strengths and weaknesses, including its current market share, marginsand future growth prospects Analyse historical trends Develop and maintain a framework for detailed financial modelling Review the capital structure along with a complete analysis of the covenants in its debt instruments Search for positive catalysts for debt and equity appreciation/refinancing opportunities/ free cash flowgeneration Examine bankruptcy and potential regulatory, tax and legal issues that may subject the company toadditional risks Review public documents and available research reports Maintain dialogue with management, industry participants, analysts and consultantsOnly when both the top down and bottom up analysis have been carried out can the hedge fund manager moveon to the investment execution. This includes understanding the market/trading dynamics, creating positions ata discount to asset value as well as optimising the risk/return profile within the capital structure. Different toother hedge fund strategies, distressed hedge funds do not tend to use leverage.Once a portfolio has been set up, its positions are reviewed on a regular basis as part of the risk managementprocess. Beside standard risk management measures such as Value-at-Risk (VaR) calculations and review ofprice movements of each security in the portfolio versus expectations, risk management for distressed hedgefund investing also covers the following aspects: Arbitrage risk models that analyse individual relationships among securities Diversification through sector and position limits Leverage limitations Credit information: market share, historical margins and future growth prospects Quantify tail risk in portfolio Analyse cost and effectiveness of various hedging instruments Liquidity analysis – how long does it take to liquidate a positionHedge fund investing in distressed securities12 / 25
Sub-strategies within distressed hedge fund investingSome distressed hedge fund strategies can overlap with private equity strategies. However, there is a keydifference between the two. While private equity investors usually work with the management on a day-to-daybasis, hedge funds are less involved in the operative leadership of company. Instead, they concentrate ontrading opportunities surrounding the company’s outstanding stock and bond securities.Active versus passiveHedge fund managers focussing on the distressed universe can be categorised as active or passive. Activemanagers are more situation specific and thus show a lower correlation to the overall credit market. Activemanagers can be further split into ‘control’ and ‘non-control’. ‘Active control’ managers – as the name suggests- get more involved in the daily business of their target company, meaning that they can also take a seat in theboard or work on site with the company, working closely with the management. Active control managers thusacquire control and block positions – usually more than one third of the impaired asset class – in order to havean appropriate influence. ‘Active non-control’ managers on the other hand do not lead restructurings, eventhough they own a large enough chunk of the company’s shares. As active distressed hedge fund managersreceive company inside information they are restricted with regards to trading. Hence, they cannot sell theirpositions until the bankruptcy process is complete. Also, active managers find opportunities in all creditenvironments whereas passive funds are more cyclical.Passive managers are more trading oriented, benefit from cyclical opportunities and tend to focus on largecaps. As they only rely on public information, they are not restricted with regards to trading positions. Theyusually base their analysis on liquidation break-through analysis and apply shorting as well as relative valuetrades, mainly in the high yield sector. Their performance tends to have a higher correlation to credit marketsthan their active counterparts. Furthermore, while active managers typically focu
Hedge fund investing in distressed securities Capturing the unique value created by corporate and . large financial institution and subsequent fire-sale of their loan book helped chase liquidity from the market and . Distressed securities are primarily debt securities which originate fro