Transcription
SANDIA REPORTSAND2017-12665Unlimited ReleasePrinted November, 2017Practical Application Limits of Fuel Cellsand Batteries for Zero Emission VesselsJohn J. Minnehan and Joseph W. PrattPrepared bySandia National LaboratoriesAlbuquerque, New Mexico 87185 and Livermore, California 94550Sandia National Laboratories is a multimission laboratory managed and operatedby National Technology and Engineering Solutions of Sandia, LLC, a wholly ownedsubsidiary of Honeywell International, Inc., for the U.S. Department of Energy’sNational Nuclear Security Administration under contract DE-NA0003525.
Issued by Sandia National Laboratories, operated for the United States Department of Energy byNational Technology and Engineering Solutions of Sandia, LLC.NOTICE: This report was prepared as an account of work sponsored by an agency of the UnitedStates Government. Neither the United States Government, nor any agency thereof, nor any oftheir employees, nor any of their contractors, subcontractors, or their employees, make anywarranty, express or implied, or assume any legal liability or responsibility for the accuracy,completeness, or usefulness of any information, apparatus, product, or process disclosed, orrepresent that its use would not infringe privately owned rights. Reference herein to any specificcommercial product, process, or service by trade name, trademark, manufacturer, or otherwise,does not necessarily constitute or imply its endorsement, recommendation, or favoring by theUnited States Government, any agency thereof, or any of their contractors or subcontractors. Theviews and opinions expressed herein do not necessarily state or reflect those of the United StatesGovernment, any agency thereof, or any of their contractors.Printed in the United States of America. This report has been reproduced directly from the bestavailable copy.Available to DOE and DOE contractors fromU.S. Department of EnergyOffice of Scientific and Technical InformationP.O. Box 62Oak Ridge, TN 37831Telephone:Facsimile:E-Mail:Online ordering:(865) 576-8401(865) hAvailable to the public fromU.S. Department of CommerceNational Technical Information Service5301 Shawnee RdAlexandria, VA 22312Telephone:Facsimile:E-Mail:Online order:(800) 553-6847(703) lp/order-methods/2
SAND2017-12665Printed November 2017Unlimited ReleasePractical Application Limits of Fuel Cells andBatteries for Zero Emission VesselsJohn J. Minnehan and Joseph W. PrattEnergy Innovation Department (8366)Sandia National LaboratoriesP.O. Box 969Livermore, California, 94551AbstractBatteries and hydrogen fuel cells provide zero emission power at the point of use. They arestudied as an alternative powerplant for maritime vessels by considering 14 case studies ofvarious ship sizes and routes varying from small passenger vessels to the largest cargo ships.The method used was to compare the mass and volume of the required zero emission solution tothe available mass and volume on an existing vessel considering its current engine and fuelstorage systems.The results show that it is practically feasible to consider these zero emission technologies formost vessels in the world’s fleet. Hydrogen fuel cells proved to be the most capable while batterysystems showed an advantage for high power, short duration missions. The results provide aguide to ship designers to determine the most suitable types of zero emission powerplants to fit aship based on its size and energy requirements.3
ACKNOWLEDGMENTSMIDN John Minnehan:Thank you to all those that organize the United State Naval Academy – Sandia NationalLaboratories connection and allow Midshipmen to spend time working with the researchers andmentors at Sandia.Additional thanks to everyone that proofread, edited, and commented on this study. This studycould not have been successful without the guidance of Dr. Joe Pratt, and the assistance of thefollowing: Hornblower, especially Nick LinderRed and White Fleet, especially Joe BurgardStaci DorseyMAC ProgramDr. Joe Pratt:The Military Academic Collaboration (MAC) program is a wonderful opportunity for thebrightest men and women at our country’s military institutions to directly contribute to issuesrelated to United States’ security; in this case, energy security. Their time at Sandia is short butas evidenced here can be quite impactful.I thank John for bringing his dedication, professionalism, curiosity, and critical thinking to thisproject. For jumping in with both feet and having some fun in the process. And especially forhis current and future service to our country.Thank you also to all who support and organize the MAC program, especially Staci Dorsey atSandia.4
CONTENTSFigures.7Tables.8Executive Summary .11Nomenclature .131.Introduction and Background .151.1.Background of the Present Problem .151.2.Objective .151.3.Method Overview .161.3.1.Battery and Fuel Cell Information .161.3.2.Vessel Case Studies .171.3.3.Engine Specifications .171.3.4.Units .172.Fuel Cells, Hydrogen, and Batteries .192.1.Fuel Cells .192.1.1.Why fuel cells?.192.1.2.What is a fuel cell and how does it work? .192.1.3.Proton Exchange Membrane Fuel Cells (PEMFCs) .202.1.4.Fuel Cell Data and Specifications .222.1.5.Hydrogen Fuel Storage for Fuel Cells .252.2.Batteries .262.2.1.Why Batteries? .262.2.2.Battery History .262.2.3.How do Batteries work? .272.2.4.Battery Data and Specifications .273.Vessel Case Studies .313.1.Calculations.313.1.1.Fuel Cell and Hydrogen System Mass and Volume .323.1.2.Battery System Mass and Volume .333.1.3.Maximum Available On-board Mass and Volume .333.2.Vessel Assessments .353.2.1.Emma Maersk – 9321483 .363.2.2.Colombo Express – 9295244 .373.2.3.Pride of Hull – 9208629 .393.2.4.Spiegelgracht – 9197911 .413.2.5.Atlantic Klipper – 9454761.423.2.6.Capricorn – General Cargo – 8728098 .443.2.7.Atlantic Dawn – 9671450 .453.2.8.Maersk Frontier – 9034767 .473.2.9.Alfa Nero – 1009376.483.2.10. Zalophus .503.2.11. Northwestern – 7719179 .513.2.12. Trondheimsfjord 2 – 9432189.533.2.13. Hein Senior - 9092642 .545
3.2.14. Trearddur Bay .563.3.Combined Results and Discussion .573.3.1.Power and Energy Limits .573.3.2.Volume, Displacement, and Energy Limits .594.Conclusions and Recommendations .654.1.Conclusions of the Study .654.2.Recommendations and Questions for Future Studies .66Appendix A .69Distribution .706
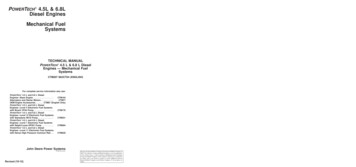
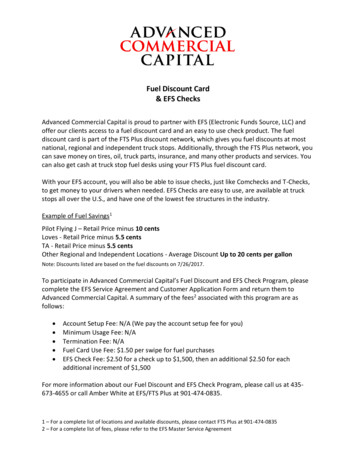
FIGURESFigure 1.1 Predicted maritime CO2 Emissions over the next three and a half decades: The toplines illustrate what could happen if nothing is done to reduce emissions; thebottom lines illustrate result of a 60% efficiency improvement and use of non-fossilfuels. . 15Figure 2.1: The relationship between electrolysis and its reverse reaction, the reaction that occursin hydrogen fuel cells. Left: Electrolysis of water; Right: Fuel Cell Reaction; Notethat the current flows in opposite directions. . 20Figure 2.2 Visual graphic of the individual plates that make up a fuel cell stack; note that thebipolar plates have channels etched into them for fueling and ventilation (not toscale). 21Figure 2.3: Thermal efficiency of a Hydrogenics HD-30 PEM fuel cell (thick blue line) and anMTU 16V4000 diesel engine (thin red line) as a function of the partial load. Forthe HD-30, the maximal power (100% load) is 33 kW. For one of the MTU16V4000 diesel engines, the maximal power is 1700 kW. The figure assumes aLHV value of hydrogen of 119.96 MJ/kg, and a LHV value for diesel fuel of 43.4MJ/kg. Figure from Pratt and Klebanoff. . 22Figure 2.4 Specific Power: Based off values from Table 2.1 and Table 2.2 . 24Figure 2.5 Power Density: Based off values from Table 2.1 and Table 2.2 . 25Figure 2.6 Specific Energy for battery modules and systems: Based off of Table 2.4, Table 2.5,and Table 2.6. . 29Figure 2.7 Energy Density of battery modules and systems: Based off Table 2.4, Table 2.5 andTable 2.6. . 29Figure 3.1: General power-mass characteristics of common marine diesel engines used today. . 34Figure 3.2: General power-volume characteristics of common marine diesel engines used today. 34Figure 3.3 Installed Power of a vessel (MCR) versus the Energy required for a specific route andmultiples of that route . 58Figure 3.4: Approximate mission energy upper limits of zero emission powertrain technologybased on available volume. . 60Figure 3.5: Approximate mission energy upper limits of zero emission powertrain technologybased on available volume, zoomed in to show detail around the origin. . 60Figure 3.6: Relationship between estimated available volume and overall vessel displacementshowing that one can generally be substituted for the other for purposes ofestimating the applicability of different powertrain types to different vessel sizes. 61Figure 3.7: Approximate mission energy upper limits of zero emission powertrain technologybased on vessel displacement. . 62Figure 3.8: Approximate mission energy upper limits of zero emission powertrain technologybased on vessel displacement, zoomed in to show some detail near the origin. . 62Figure 3.9: Approximate mission energy upper limits of zero emission powertrain technologybased on vessel displacement, zoomed in to show points very close to the originrelevant to small vessels. . 637
TABLESTable 2.1: System Fuel Cell Data: Taken from various websites and brochures, some values arecalculated in order to get the same data for all fuel cells,,, . 23Table 2.2: Module Cell Data: Taken from various websites and brochures, some values arecalculated in order to get the same data for all fuel cells (same references as abovetable, plus Ref. ) . 24Table 2.3: Gravimetric and volumetric specs for the hydrogen storage systems considered in thisstudy. . 26Table 2.4: System Battery Data for low C-rate battery systems. . 28Table 2.5: System Battery Data for high C-rate battery systems. . 28Table 2.6 Module Battery Data: The green filled cells correspond to batteries marketed for lowpower output for long periods of time whereas the pink cells correspond to batteriesmarketed for high power outputs for short periods of time. 28Table 3.1: Summary of available volume and mass characteristics for the vessels in the study. . 35Table 3.2: Estimated specifications of the Emma Maersk . 36Table 3.3: Route information used for the Emma Maersk. 36Table 3.4: Characteristics of zero emission power systems needed on the Emma Maersk for theroute studied. . 37Table 3.5: Estimated specifications of the Colombo Express. 38Table 3.6: Route information used for the Colombo Express. . 38Table 3.7: Characteristics of zero emission power systems needed on the Colombo Express for asingle trip on the route studied. . 39Table 3.8: Estimated specifications of the Pride of Hull . 39Table 3.9: Route information used for the Pride of Hull. . 40Table 3.10: Characteristics of zero emission power systems needed on the Pride of Hull for asingle trip on the route studied. . 40Table 3.11: Estimated specifications of the Spiegelgracht . 41Table 3.12: Route information used for the Spiegelgracht. . 41Table 3.13: Characteristics of zero emission power systems needed on the Spiegelgracht for asingle trip on the route studied. . 42Table 3.14: Estimated specifications of the Atlantic Klipper . 43Table 3.15: Route information used for the Atlantic Klipper. . 43Table 3.16: Characteristics of zero emission power systems needed on the Atlantic Klipper for asingle trip on the route studied. . 43Table 3.17: Estimated specifications of the Capricorn . 44Table 3.18: Route information used for the Capricorn. . 44Table 3.19: Characteristics of zero emission power systems needed on the Capricorn for a singletrip on the route studied. . 45Table 3.20: Estimated specifications of the Atlantic Dawn . 46Table 3.21: Route information used for the Atlantic Dawn. 46Table 3.22: Characteristics of zero emission power systems needed on the Atlantic Dawn for asingle trip on the route studied. . 46Table 3.23: Estimated specifications of the Maersk Frontier . 47Table 3.24: Route information used for the Maersk Frontier. . 47Table 3.25: Characteristics of zero emission power systems needed on the Maersk Frontier for asingle trip on the route studied. . 488
Table 3.26: Estimated specifications of the Alfa Nero . 49Table 3.27: Route information used for the Alfa Nero. . 49Table 3.28: Characteristics of zero emission power systems needed on the Alfa Nero for a singletrip on the route studied. . 49Table 3.29: Estimated specifications of the Zalophus . 50Table 3.30: Route information used for the Zalophus. . 50Table 3.31: Characteristics of zero emission power systems needed on the Zalophus for a singletrip on the route studied. . 51Table 3.32: Estimated specifications of the Northwestern . 52Table 3.33: Route information used for the Northwestern. . 52Table 3.34: Characteristics of zero emission power systems needed on the Northwestern for asingle trip on the route studied. . 52Table 3.35: Estimated specifications of the Trondheimsfjord 2 . 53Table 3.36: Route information used for the Trondheimsfjord 2. . 53Table 3.37: Characteristics of zero emission power systems needed on the Trondheimsfjord 2 fora single trip on the route studied. . 54Table 3.38: Estimated specifications of the Hein Senior . 55Table 3.39: Route information used for the Hein Senior. . 55Table 3.40: Characteristics of zero emission power systems needed on the Hein Senior for asingle trip on the route studied. . 55Table 3.41: Estimated specifications of the Trearddur Bay . 56Table 3.42: Route information used for the Trearddur Bay. Refer to text for clarifications on theroute. . 57Table 3.43: Characteristics of zero emission power systems needed on the Trearddur Bay for asingle trip on the route studied. . 57Table 3.44: The code for the different shapes on Figure 3.3. Note that the battery-only symbol israrely used. . 589
10
EXECUTIVE SUMMARYAs the demand for fossil fuels continues to increase in our ever industrializing world, thesenonrenewable resources will begin to deplete and prices will rise. At the same time, burningfossil fuels produces greenhouse gases (GHGs) and pollutes the air in our atmosphere. Pollutionon the level seen in large cities like New York and Shanghai pose a threat to the air we breatheand changes the climate across the world. One major consumer of fossil fuels is the marineindustry. Whether it is a fishing vessel off the coast of Alaska or a container ship that steamsfrom Los Angeles to Singapore, the whole industry is dependent upon fuels like diesel and heavyfuel oil. This reliance will not decrease if nothing is done to create a reliable, cleaner source ofenergy.Among the various clean sources of energy, fuel cells and batteries stand out as possiblesolutions. Fuel cells powered by either liquid hydrogen (LH2) or compressed hydrogen gas, andbatteries are currently commercially available and are scalable to high powers. This study seeksto determine the limits of scaling today’s commercially available technology to maritime vesselsconsidering 14 case studies of various ship sizes and routes. Vessels varied from small fishingvessels and passenger boats on limited routes to the largest cargo ships in the world travellingacross the oceans.The method used was to take the specifications of different commercially available fuel cell,hydrogen storage systems, and battery systems and analyze the trends to predict the mass andvolume of possible replacements of internal combustion engines (ICEs). Then, limits on how bigthe overall systems can be were set based the currently available engine and fuel volume andmass on the studied vessel. The results were examined individually and as a whole to look forcommonalities and trends.The results showed that all but one of the fourteen vessel case studies can be practically poweredby a zero emission fuel cell or battery power plant. The fuel cells proved to be the most versatileand the LH2 fueled fuel cell more so than the 5000 psi. Batteries provided interesting results.They were only possible on the smaller ships and could only provide enough energy to travel onetrip. On top of that, in one case they were shown to be more effective than hydrogen fuel cells onvessels that have short voyages but require a relatively high amount power.The limiting factor in all cases was not power generation or energy storage of the technologyitself but rather available volume. The results of all case studies were compiled to provide aguide to ship designers to determine early the most suitable types of zero emission powerplantsto fit a ship based on its available volume or displacement and the energy requirements of itsroutes.Ultimately, this was a high level study that uses several approximations, and requires furtherresearch to make concrete claims. However, the results show that it is practically feasible toconsider zero emission technologies for most types of vessels in the world’s fleet.11
12
MCRMDOMTNOAAPEPEMFCPtR&DSOATTEUBeamBlock coefficientActivation EnergyFuel CellGreenhouse GasHeavy Fuel OilInternal combustion engineIntermediate Fuel OilInternational Maritime OrganizationLoad FactorLiquid HydrogenLower Heating ValueLength Overall[U.S.] Maritime AdministrationMaximum Continuous RatingMarine Diesel OilMetric ton (1,000 kg)[U.S.] National Oceanic and Atmospheric AdministrationPotential EnergyProton Exchange Membrane Fuel CellPlatinumResearch and developmentSpeed of AdvanceDraft20 foot equivalent unit13
14
1.INTRODUCTION AND BACKGROUND1.1.Background of the Present ProblemAir emissions including greenhouse gases (GHGs) and criteria pollutants are affectingenvironments around the world, from smoggy skies in Beijing to the melting of the polar icecaps. Large portions of these GHGs, such as carbon dioxide (CO2), come from burning differenttypes of fuel in cars, ships, planes, and power plants. The massive containerships that steamacross the oceans burn tons of fuel per day. However, ships are vital to global trade, provide jobsand transportation, and support offshore industries such as fishing.Figure 1.1 illustrates the potential increase in maritime-related carbon dioxide emissions ifnothing is done over the next few decades. As the need to eliminate GHG emissions increases,the maritime industry will face pressure to reduce their carbon footprint. Recently, theautomotive, aerospace, and energy production industries have begun implementing ways ofproducing clean, zero emission energy; the maritime industry lags behind in that development.One possible solution for the maritime industry is to consider zero emission technology such ashydrogen fuel cells and batteries. As fossil fuels become scarcer and more expensive the urgencyof finding a solution continues to increase.1.2.ObjectiveThe objective of this study is to determine the best role for batteries and fuel cells in realizing awide range of zero emission marine vessels. The driving questions behind this objective are:Figure 1.1 Predicted maritime CO2 Emissions over the next three and a half decades: The top lines illustrate what couldhappen if nothing is done to reduce emissions; the bottom lines illustrate result of a 60% efficiency improvement and useof non-fossil fuels. 11Figure 14 from “Third IMO GHG Study 2014 – Final Report,” International Maritime Organization.15
Which marine vessels can battery-only systems power and which ones require hydrogenfuel cells using today’s commercially-available technology?Is there a limit to the power and energy demand hydrogen fuel cells can support withtoday’s commercially-available technology?In the aim to reduce the emission of (GHG) by marine vessels, what is the best role forbatteries and hydrogen fuel cells in the propulsion plants of marine vessels?This study will attempt to answer those questions to the fullest extent possible.1.3.Method OverviewDetermining definitive generalizable limits for zero emission technology on maritime vessels isan impractical goal. It would require generating vessel plans for the entire design space of thetens of thousands permutations of vessel types and missions encountered in the world today andevaluating the feasibility of each.The intent of this study is not to provide definitive limits, but rather to provide a rough guide tothe areas in the design space which appear to have higher or lower potential for zero emissiontechnology adoption. With this information, areas that appear favorable can be examined inmore detail for near-term deployment efforts, while areas that appear impractical with today’stechnology can help define development goals for future deployments.With this more modest goal in mind, rather than examining all possible vessel combinationstoday, we can drastically reduce the work required by carefully selecting just a few types in usetoday as representatives of the larger design space. Furthermore, rather than conducting a fulldesign of each of these vessels, we select a specific vessel in service today and perform a simplecomparison of power and energy requirements based on overall mass and volume specifications.The results provide vessel designers with an easy-to-use method to quickly estimate suitability ofzero emission battery and hydrogen fuel cell power systems for a wide variety of marine vessels.1.3.1. Battery and Fuel Cell Inf
Practical Application Limits of Fuel Cells and Batteries for Zero Emission Vessels . John J. Minnehan and Joseph W. Pratt . Prepared by Sandia National Laboratories Albuquerque, New Mexico 87185 and Livermore, California 94550 . Sandia National Labor