Transcription
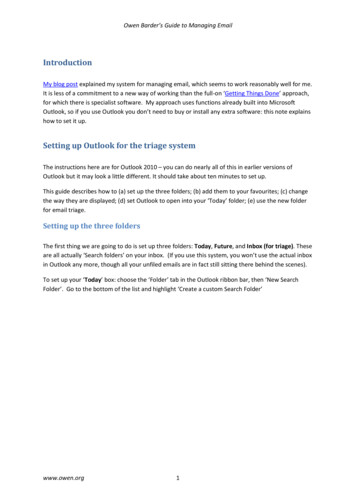
EYE ON THE MARKET OUTLOOK 2022Reflation: EndgameThese superheroes all contribute in their own way to a rise in prices, wages,economic growth and asset prices. See inside cover for details. In this year’sOutlook, we look at the consequences of reflation for equity markets thatare already pricing in plenty of good news. Special topics include China andthe regulatory purge, dividend investing, real assets (commercial real estate,timber and infrastructure), investments in fintech and cybersecurity firms, ESGimpacts on portfolios and the high cost of Brexit.By Michael CembalestChairman of Market and Investment Strategy for J.P. Morgan Asset & Wealth Management
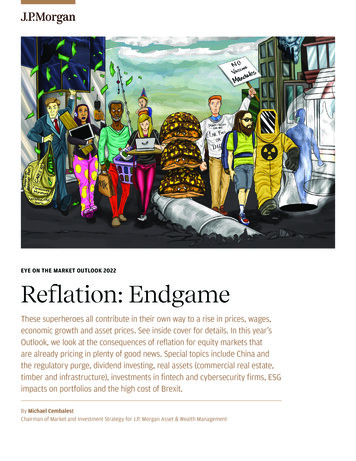
EYE ON THE MARKET OUTLOOK 2022Our Reflation: Endgame coverThis year’s cover depicts how these superheroes all contribute in their own way to a rise inprices, wages, economic growth and asset prices:Politicians creating the largeststimulus on recordVaccine resistersCOVID monetary and fiscal stimulus across thedeveloped world was 2x–3x larger than similarstimulus after the Global Financial Crisis, andthat’s before including 2021 bills and proposed USinfrastructure and reconciliation spending. Oneby-product: 1 trillion in positive US wealth effectsfrom rising stock markets, rising home prices andincreased refinancing by homeowners.The US has one of the largest unvaccinatedpopulations in the developed world at 30%. Thiscohort increases community spread, reduces thelabor supply, sustains the shift to goods spendingand creates the need for more gov’t spendingto support employment and incomes. A recentsurvey: 37% of unvaccinated US workers saidthey would quit if faced with employer-mandatedvaccination or testing.Work from home employeesLabor force drop-outs and switchersDue to COVID, services spending collapsed andgoods spending surged, driving goods priceinflation to the highest levels since the 1970’s.Categories with 20% spending increases vs preCOVID levels: household, telecommunicationsand computer equipment; home furnishings andpower tools; recreational goods and clothing.Many are import-intensive and semiconductorintensive, worsening supply chain bottlenecks.Several million people dropped out of the laborforce, or shifted sectors or states. The CensusBureau estimated in December that 2.5 millionpeople were not working due to concerns aboutgetting or spreading COVID. Job switching out ofmanufacturing and agriculture into self-employedtransportation and construction has tightened thelabor force as well. One consequence: excess jobseekers in some states and excess job openingsin others.A large jump in retireesCOVID drove a surge in US retirement withroughly 1.5 million more people leaving the laborforce than usual from January 2020 to August2021. Academic research points to an increasedpace of retirement when 401k account andhousing values are rising sharply.Working mothers facing childcareconstraintsThe reopening of schools improved this issue, butthe Census Bureau still estimated in December thatmore than 5 million people were not working dueto child care constraints. Most of these people areworking mothers: female labor force participationrates declined twice as much as male participationrates since February 2020.Oil, natural gas and coal producersThermal energy producers have reverted intotheir shells, reducing capital spending on newprojects by 75% from peak levels. Global demandfor thermal energy is unchanged, leading toenergy price inflation and food price inflation aswell given rising demand for biodiesel.Healthcare regulators in Asia, the USand EuropeLockdown rules are still much tighter in Asia,leading to underutilized factories, supply chainshortages, etc. In China, COVID protocols areamongst the tightest in the world. In the US,Kaiser estimates that 2.5 million people left ajob in late 2021 due to vaccination requirementsenacted by healthcare regulators and/orcompany policy.Missing immigrant workersVisas issued to immigrants and temporaryworkers collapsed during the pandemic, resultingin 700,000 fewer workers in the US labor supply.This follows on the pre-COVID Trump era whennet immigration fell to its lowest levels since the1980’s. Another factor driving wage inflationhigher.
MARY CALLAHAN ERDOESJ.P. Morgan Asset & Wealth ManagementIn the midst of what has felt like a persistent pandemic, I hope you are staying strong, hopeful andoptimistic.that optimismin theface thatof adversitycomesinto focusin my investmentHow Itdois yousummarizea yearwas inthatmanyrespectsindefinable?On onepartnerhand,the Europeansovereigndebt Endgame.crisis, contracting housing markets and highMichaelCembalest’s2022 Outlook,Reflation:unemployment weighed heavy on all of our minds. But at the same time, recordcorporate profits and strong emerging markets growth left reason for optimism.For the past 19 years, Michael has looked beyond the headline news to thoughtfully craft uniquemarketfor thelookyearback,ahead.In thisOutlook,with inflationmetricsnear theirSoinsightsrather thanwe’dlikeyear’sto lookahead.evenBecauseif there’sone thingthatwe’velearnedfrom thepastyears,it’s that andwhilewe can’tpredictthe future,highestlevelsin two decadesandan elweteamcan willcertainlyhelpyoupreparefor it. for continued global growth—and why you shouldand hisshow youwhytheyare optimisticbe, too.Cembalest has spent the past several months working with our debuildis aourcomprehensiveAs always,helpingacrossyou betteryour portfoliosfor thetofuturetop priority. Weviewhope youmacroeconomiclandscape.In doingso, we’veuncoveredenjoyofthisthepiece,and we wish yougood health,happinessand successin 2022.some potentiallyexciting investment opportunities, as well as some areas where we see reason toproceed with caution.Happy New Year,Sharing these perspectives and opportunities is part of our deep commitment toyou and what we focus on each and every day. We are grateful for your continuedtrust and confidence, and look forward to working with you in 2011.Most sincerely,
EYE ON THE MARKET MICHAEL CEMBALEST J.P. MORGANAccess our full coronavirus analysis web portal hereJanuary 1, 2022Greetings and Happy New Year. In this year’s Eye on the Market Outlook, my team and I cover theelephant in the room: the consequences of reflationary dynamics which appear to have moved beyondwhat the Fed expected a few months ago. While I have never seen a superhero movie, their marketingposters gave us the idea for the cover: who and what are the drivers of the largest inflation spike inmany years. In the Executive Summary, we cover goods supply shocks, labor market shortages andcommodity price spikes, and their implications for inflation and equity markets in 2022. We follow upwith a review of US equities at a time of pent-up household and corporate demand but also highvaluations; the real assets which comprise a growing share of many client portfolios; and three policyissues affecting portfolios in 2022 and beyond, including the regulatory purge in China.Michael CembalestChairman of Market and Investment StrategyJP Morgan Asset ManagementTABLE OF CONTENTSExecutive Summary . 2PUBLIC EQUITIES: DIVIDENDS, CYBERSECURITY and FINTECH[1] Equity dividends: like it or not, dividends are a critical component of yield based investing. 16[2] Cybersecurity investing: innovation and evil collide, providing opportunity for investors. 18[3] F is for Fintech and also for fear, fraud and foreclosure . 21REAL ASSETS: COMMERCIAL OFFICE PROPERTY, INFRASTRUCTURE and TIMBER[4] US office market fundamentals: already improving despite COVID. 24[5] Infrastructure investing: devil is in the details (electricity distribution, solar power and bulk storage) . 27[6] Timber: steady yields with potential upside in a world searching for real sequestration . 30POLICY ISSUES: CHINA’S REGULATORY PURGE, BREXIT and ESG INVESTMENT FACTORS[7] China portfolio inflows continue despite 2021 regulatory purge and slowing growth . 34[8] Brexit and the high price of national sovereignty . 36[9] ESG portfolio benefits look clearer but precede the 2021 recovery of traditional energy sectors . 39INVESTMENT PRODUCTS ARE: NOT FDIC INSURED NOT A DEPOSIT OR OTHER OBLIGATION OF,OR GUARANTEED BY, JPMORGAN CHASE BANK, N.A. OR ANY OF ITS AFFILIATES SUBJECT TOINVESTMENT RISKS, INCLUDING POSSIBLE LOSS OF THE PRINCIPAL AMOUNT INVESTED1
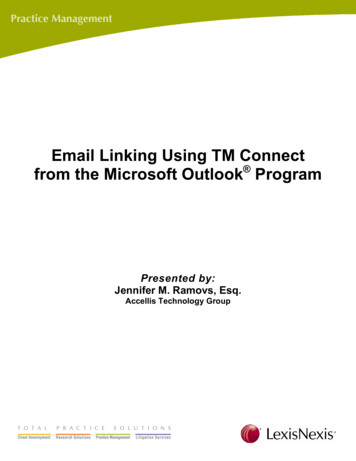
EYE ON THE MARKET MICHAEL CEMBALEST J.P. MORGANAccess our full coronavirus analysis web portal hereJanuary 1, 2022Reflation: EndgameExecutive SummaryThe superheroes on the cover have all contributed in their own way to a reflating world: higher nominal growth,higher wages, higher prices and rising asset prices. While the COVID recession was deeper, the global recoveryis on track to eliminate spare capacity at a much faster pace than after prior recessions. Global inflation is closeto the highest level in 20 years, driven by surging goods prices and changing consumption patterns due to COVID,the inability of a just-in-time corporate sector to respond, soaring government debt 1, monetary policy thatdwarfs anything seen after the Global Financial Crisis a decade ago, and energy policies which reduce the supplyof thermal energy much faster than they reduce demand.Global output gap (spare capacity measure)Global headline CPI inflation0%6%%, annualized quarterly change%, actual GDP relative to potential GDP-1%Global Financial Crisis-3%4%-4%3%-5%2%-6%COVID-19-7%-8%Q4 2021 est.5%Average of priorthree expansions-2%051%1015202530Quarters from start of recovery354045Dev world government debt & central bank balance sheetsUS , trillions140%130% 30 25 20110%90% 15Central bankbalance sheets80%200920112013201520172019Source: JP Morgan Economic Research. November 2021.20212008201220162020Faster growth in the US money supply this time aroundM2 money supply institutional money market fund balances, index145140Government debt120%100%2004Source: JP Morgan Economic Research. November 2021.Source: JP Morgan Economic Research. Q3 2021. Dotted line forecast.% of GDP0%2000 10 5Global Coronavirus Crisis135130125120115Global Financial Crisis(Aug 2008-Sept 2022Source: St Louis Fed, ICI, J.P. Morgan Asset Management. Nov 2021.For the latest developments on COVID, Omicron, immunity escape, vaccine efficacy, booster shots andvaccinated vs unvaccinated outcomes by state, please see our COVID web portal linked above in the header1In mid-December, the CBO reported that if temporary provisions in the “Build Back Better” bill were madepermanent, it would add 2.75 trillion to the deficit as opposed to adding 158 billion as written. The latestnegotiations point to a smaller bill given objections by Senator Manchin (D-WV). Even so, any revised smallerbill might still rely on temporary provisions which could be inflationary if made permanent.2
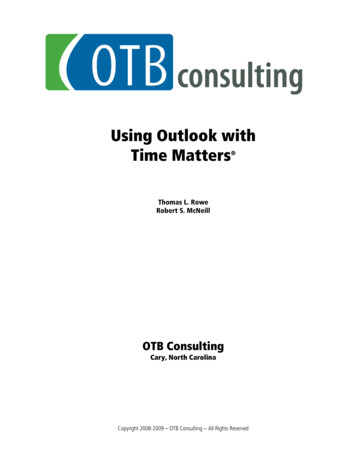
EYE ON THE MARKET MICHAEL CEMBALEST J.P. MORGANAccess our full coronavirus analysis web portal hereJanuary 1, 2022While leading manufacturing indicators have been weakening, we don’t interpret them as we normally would(i.e., a worrisome decline in demand). This time around, widely reported supply chain shocks are responsible.That’s why we’re optimistic that with gradual resolution of supply chain delays, global growth will rebound.US manufacturing PMIDev markets manufacturing PMIEmerging markets manufacturing656560Index (50 expansion)Index (50 expansion)60New ordersOutput60555550504545404035New ordersOutput3025201920202021Source: Bloomberg. November 2021.Index (50 expansion)New ordersOutput55504535403025201920202021Source: Bloomberg. November 2021.35201920202021Source: Bloomberg. November 2021.One important trend we’re monitoring: the surge in goods spending vs services which sparked the supply chainmess in the first place. In the US and Europe we’re already seeing a shift back to services, and inventory growthalready contributed to US Q3 2021 GDP growth. But in the meantime inflationary pressure is broadening,confirmed by the November US PCE report showing the largest increase in rental inflation in 20 years and a largenumber of categories whose prices are rising 4%. While COVID spending shifts triggered supply chain delays,there are structural issues in the US which made them a whole lot worse (see next page).A surge in US goods spendingA surge in Europe goods spendingDifference in rolling 6-quarter growth rates, goods - servicesDifference in rolling 6-quarter growth rates, goods - -15%1950-2%1960197019801990200020102020Source: BEA, JPMAM. Q3 2021.Global goods and services price level-4%2002 2004 2006 2008 2010 2012 2014 2016 2018 2020 2022Source: Eurostat, JPMAM. Q3 2021.US goods vs services inflation% deviation from 2018-2019 trendy/y % change in core es ource: JP Morgan Economic Research. November 2021.Goods inflation-5%1970 1975 1980 1985 1990 1995 2000 2005 2010 2015 2020Source: BLS, JPMAM. November 2021.3
EYE ON THE MARKET MICHAEL CEMBALEST J.P. MORGANAccess our full coronavirus analysis web portal hereJanuary 1, 2022Supply chain problems: not just the byproduct of COVID and the surge in goods spendingTwo years ago, Jamie asked me to prepare a report on structural issues that stand in the way of higher USgrowth. We looked at the opportunity cost of wars and elevated military spending; land use regulationswhich constrain density where it should be higher; state licensing requirements which impede labormobility; the impact of racial inequality in education, lending and criminal justice; the high cost of gunviolence, opioids and incarceration; and commercial litigation and class action costs.COVID and the supply chain mess surfaced more growth constraints that can be added to the list. Thesestructural issues may impede Biden’s infrastructure projects as well. Containership problems in Los Angeles and Long Beach were exacerbated by local regulations thatprevented the stacking of containers more than two at a time, ordinances preventing port owners frompaving and consolidating plots they already own to accommodate more storage, and land useregulations that require two to nine years before warehouses can be built on empty land No US port ranks in the top 50 globally in terms of cost or efficiency. The Los Angeles port ranks #328and the Long Beach port comes in at a dismal #333. Contracts that prevent port automation, laborcosts, limits on operating hours, weekend closures and other factors are partial reasons. Note that thesemi-automated port of Virginia is free of backlogs despite handling record volumes, and ranks #85.There was a “60 Minutes” episode in November that focused on the LA/LB ports that made no mentionof their relatively poor productivity; I wonder why its producers didn’t ask questions about the laborand automation issues involved The Jones Act and Foreign Dredging Act raise port handling and dredging costs and put pressure ontrucks and rail to transport goods that should be carried by ship instead. Section 301 tariffs of 221% onimported Chinese truck chassis cut trucking capacity and exacerbate supply chain delays at aninopportune time US rail projects take longer to complete and are more expensive than projects elsewhere. US railprojects with minimal tunneling take six months longer to complete than non-US projects, whileunderground rail can take 1.5 years longer. Domestic rail projects also cost 50% more on a per-milebasis than in Europe and Canada, and 250% more in New York City. One example: a Metro Line inToulouse, France was built underground at 176 million per mile while Houston’s Green Line is at-gradeand cost 223 million per mile Despite a worsening US trucker shortage that has existed for many years, the US effectively barsMexican trucking companies from operating in the US. The number of American trucks available forinland delivery is reduced since many of them are picking up cargo at the Mexican border From 1960 to 1994, the real unit cost of construction materials and construction workers in the US wasunchanged yet real interstate highway spending per mile rose by 400%. What changed: the power oflocal governments and/or citizens groups to delay or block development. Environmental ImpactStatements used to be 10 pages; due to litigation, the current EIS is more than 600 pages plusappendices that can exceed 1,000 pages, and can take 4.5 years to complete. No ground can be brokenon federal or private projects until an EIS makes it through the legal gauntlet. One California publicpolicy nonprofit argues that the state’s environmental protection law is often used inappropriately todelay or stop transit and sustainable transportation projects that would have significant benefit to theenvironment, such as solar farms, infill housing and mass transitSources: Cato Institute; Wall Street Journal; Eno Center for Transportation; Niskanen Center; World Bank/IHS Markit;Congressional Research Service; George Washington School of Public Policy; Yale Law School4
EYE ON THE MARKET MICHAEL CEMBALEST J.P. MORGANAccess our full coronavirus analysis web portal hereJanuary 1, 2022Anchored, loitering and slow-speed containerships in the vicinity of Los Angeles and Long Beach ports are stillhovering at the highest levels on record, waiting to unload 750,000 20-foot equivalent containers with 30billion in imported goods. Other supply shock measures we’re tracking: manufacturer delivery times, autoproduction and backlogs, freight rates, trucking demand and air cargo rates. One consequence: the US NFIBsurvey shows the largest % of firms reporting inadequate inventories since 1975, and by a very large margin.There are preliminary signs that US auto and regional delivery times are improving from very delayed levels.Global manufacturing delivery timesAuto production by region3014Millions of units, trailing 12 month sumIndexLonger lead times35124010845Japan65055US4Shorter lead times22000601998200220062010201420182022Source: Bloomberg, JP Morgan Economic Research. November 2021.Germany200520102015Container freight rate between LA and ShanghaiTruckstop market demand index 14,000250Index, demand for trucks vs supply of trucksUS / 40ft box 12,0002020Source: Automotive News, regional automobile manufacturers associations,JPMAM. November 2021.Shanghai to Los AngelesLos Angeles to Shanghai200 10,000150 8,000 6,000100 4,00050 2,000 0201220142016Source: Bloomberg. December 23, 2021.2018US class 8 truck purchase trendsThousands of trucks2020Months, backlog / build50Backlog-to-buildratio45403510252015Retail trucksales10520201412Net truckorders300201720182019Source: Bloomberg. October 2021.0Jan '19Jul '19Jan '20Jul '20Source: Bloomberg. December 24, 2021.202220212022Jan '21Jul '21Air cargo rates: Shanghai to North AmericaUS / kg 18 16 14 128 106 84 62 40 2Jan-19Jul-19Jan-20Jul-20Jan-21Jul-21Jan-22Source: Bloomberg, JPMAM. December 27, 2021.5
EYE ON THE MARKET MICHAEL CEMBALEST J.P. MORGANAccess our full coronavirus analysis web portal hereJanuary 1, 2022The global supply shock is more a consequence of surging demand than of weak output; in most sectors,output is quite strong (just not strong enough to meet soaring demand). Global goods production, worldexports, containerships in service, LA port throughput, US truck tonnage and global semiconductor shipmentsare all well above trend. So are US housing completions.Port of LA container import throughputWorld exports vs shipping capacityPercent change vs Dec 2019Index (100 Dec handise exports (3 month avg)-50%-60%2005Containerships in service20072009201120132015201720192021Source: Bloomberg, IMF, JPMAM. December 24, 2021.US truck tonnage hauled702010201220142016Source: Bloomberg, JPMAM. November 2021.20182020Global semiconductor shipment volumesIndex (100 2015)125Billions of 1620172018201920202021Source: Bloomberg. November 2021.202005201020152020Source: WSTS, IC Insights. Q2 2021. Dotted line 2021 forecast.US housing: supply vs demandIndex (Dec 2019 100)150140Home sales (US )Completions listings (units)Completions only (units)130120110100902018201920202021Source: National Association of Realtors, US Census, JPMAM. Nov 2021.6
EYE ON THE MARKET MICHAEL CEMBALEST J.P. MORGANAccess our full coronavirus analysis web portal hereJanuary 1, 2022The strength in output and new orders is a positive sign, and we do not see long-lasting weakness in globaldemand despite rising tariffs and declining cross-border foreign direct investment. In theory, there could betailwinds for growth and US/Chinese asset prices if the Biden administration reduced tariffs on China, perhapsjustifying it as a means of reducing inflation and boosting employment and income. But we consider thisunlikely; if anything, Senate Majority Leader Schumer has kept China issues on the agenda by advancing the USInnovation and Competition Act, which includes sanctions on China for human rights issues, its trade with NorthKorea and state-sponsored cyberattacks. In addition, China is only 62% compliant with its Phase One trade dealagricultural purchases from the US. The Trump tariffs illustrated below are estimated to have reduced USemployment by 245,000 jobs, to have reduced annual US household income by 675- 2,000, and to havereduced S&P earnings by 7%-8% 2.US-China tariff rates toward each other and rest of worldUS-China trade subject to tariffs25%80%%, trade-weighted tariff rate, constant 2017 trade levels by industryPhase one agreementTradewarChinese tariffson US exports20%US tariffs onChinese exports15%%70%60%50%TradewarPhase one agreementChinese exportssubject to US tariffsUS exports subjectto Chinese tariffs40%Chinese tariffson ROW exports10%30%20%5%US tariffs on ROW exports0%2018201920202021Source: Peterson Institute for International Economics. March 2021.10%0%2018201920202021Source: Peterson Institute for International Economics. March 2021.Global foreign direct investment flows% of global GDP6%5%4%3%2%1%0%197019801990200020102020Source: IMF, World Bank. 2019.Sources: US-China Business Council (“US-China Economic Relationship: A Crucial Partnership at a Critical Juncture”, January2021), National Foundation for American Policy, JP Morgan Global Markets Strategy.27
EYE ON THE MARKET MICHAEL CEMBALEST J.P. MORGANAccess our full coronavirus analysis web portal hereJanuary 1, 2022How will supply shock delays get resolved? Supply shocks have happened before, with 8 highlighted in the firstchart. They typically get resolved within a few months as capital spending catches up to demand. COVID is acomplicating factor, but we expect that to happen this time as well. The second chart shows how automobilerelated semiconductor capital spending is expected to double in 2022 vs prior trends. This is critical for supplychains given increased semiconductor values per car. According to Trend Force, capex by the top 10 semifoundries surpassed 50 bn in 2021, up 43% y/y with another 15% increase in 2022, increasing global 8-inch and12-inch wafer capacity by 6% and 14%. Increased vaccination in Asia will help supply chains as well.US ISM supplier deliveries indexGlobal automotive semiconductor capex80225Index75Index (100 2002 - 2021 average in real terms)200Longer lead times17570Includes global capexspending by NXPI, ON,TXN, ADI, 011201620210Average since 2002Average forecast: current - 2024Source: Bloomberg, JPMAM. Nov 2021. Red dots start of supply disruptionSource: GS, JPMAM. Q3 2021.Contribution of electronics & semiconductors to car costGlobal semiconductor producer capacity utilization 50035% 40030% 30020%25%80%70%15% 20010% 100 090%60%5%20002010202020300%MCUs, power and analog40%50%Image sensor45%Capacitors 60050%Semiconductor price per car (lhs)Automotive electronics cost per car (rhs)Wafer 700% of total car cost 100%FoundryUS per carUS manufacturing sector401981Source: Deloitte, IHS. April 2019. Dotted line & shaded bars indicate estimates. Source: GS. October 26, 2021.Semiconductor industry concentration vs expansion100%90%80%Industry concentration: Top 3 companies global market shareCapacity expansion, 2021-22 estimated averageRegional GDP-weighted vaccination ratesUnique people vaccinated as % of 0%10%0%Developed MarketsMal, Thai, Kor, Indo, Phil, Sing, Viet10%FoundryWaferSource: GS. October 26, 2021.Capacitors Image sensorMCUs,Power, andAnalog0%Jan '21Apr '21Jul '21Oct '21Jan '22Source: OWID, JPMAM. December 28, 2021.8
EYE ON THE MARKET MICHAEL CEMBALEST J.P. MORGANAccess our full coronavirus analysis web portal hereJanuary 1, 2022So, we believe that supply chain problems will be resolved in 2022 and 2023 through vaccination, more capitalspending and a shift in spending from goods back to services. As that’s happening, developed world consumersare in good shape and should be able to support the economic expansion. Developed world household balancesheets and savings rates look strong, and in the US, there’s still a large gap between the strong pace of final salesand weaker inventory accumulation. US household debt service burdens are also at the lowest levels on record.The risk: as shown in the last chart, a large boost in US consumer spending came from the lowest credit quintileof borrowers, suggesting some sensitivity to the end of fiscal stimulus.Developed World household balance sheets% of GDP700%Developed World household savings rate% of GDP Savings as % of personal income120% 22%Household assets650%110% 20%100%600%90%550%80%500%Household debt450%70%60%400%50%18%16%14%12%10%40%350%1970 1975 1980 1985 1990 1995 2000 2005 2010 2015 2020Source: BEA, ECB, regional statistical offices, JPMAM. Q3 2021.8%1970 1975 1980 1985 1990 1995 2000 2005 2010 2015 2020Source: BEA, regional statistical offices, JPMAM. Q3 2021.US excess spending potential has piled upUS unprecedented sales to inventory gap tn, rolling 4-quarter spending potential in excess of consumptiony/y % change in real values 3.515%Final salesPrivate inventories 3.010% 2.5 2.05% 1.5 1.00% 0.5-5% 0.0- 0.51972 1977 1982 1987 1992 1997 2002 2007 2012 2017 2022-10%196019701980Source: Fed, BEA, JPMAM. Q3 2021. Spending potential: 65% of taxableincome, 100% of transfer pmts, 10% of housing wealth and 1.5% of fin. wealth. Source: BEA, JPMAM. Q3 2021.Debt levels vs debt servicePercent of disposable income for US households150%140%14%Household debt level (lhs)Household debt service ratio 015014013011%1109%2000US consumer spending: transaction amounts by Equifaxcredit risk score, Index (100 December 2017)12%10%1990Highest risk borrowers1201009080Lowest risk borrowers701985199019952000Source: Fed, BEA, JPMAM. Q3 2021.20052010201520208%602018201920202021Source: Equifax, Commerce Signals, AEI Housing Center. November 17, 2021.9
EYE ON THE MARKET MICHAEL CEMBALEST J.P. MORGANAccess our full coronavirus analysis web portal hereJanuary 1, 2022We expect goods-related supply chain issues to be resolved, and for goods price inflation to fall as the Fedhas been expecting. However, US labor shortages appear to be a chronic issue, driving up wage inflation intight labor markets. As we explained last October, worker shortages are the result of accelerated retirementvs trend, immigration declines, increased self-employment that draws labor away from where it’s needed andCOVID impacts (vaccinated people afraid to return to work, working parents unable to find child care andunvaccinated people fired/furloughed from their jobs). The latest data from the BLS shows US low skill wagesrising at almost 7% per year.The charts below show the tightest labor markets in 30-40 years. Other labor market indicators also showtight conditions: all-time highs in workers saying jobs are plentiful, rising job openings and voluntary quits, andall-time lows in layoffs. Record highs in job openings are not just in leisure & hospitality but also manufacturing,transportation, warehousing, retail, professional business services, education and health. Hourly earnings andemployment costs are rising 4%-5%, close to the highest levels seen in the last three decades.The infrastructure and pending reconciliation bills could deploy up to 2 trillion, directly as governmentpurchases and indirectly via tax cuts and transfers. At a time of very tight labor markets, where are the workersgoing to come from, what impact will this have on wages and what impact will it have on the Fed?Worker shortagesUS small businesses with hard to fill job openings855%% of small business survey respondentsMillions of workers50%7Other labor force departures65445%40%Increased self-employment35%Temp. worker and immigrant visa decline30%25%Excess retirees over trend320%215%People earning more from UIbenefits than in prior jobs110%5%19850199019952000200520102015Source: BLS, Census, GS, JPMAM. October 2021.Source: Bloomberg, NFIB. November 2021.US small businesses planning to raise workercompensation, % of small business survey respondentsUS small businesse
Dec 22, 2021 · Michael Cembalest’s 2022 Outlook, Reflation: Endgame. For the past 19 years, Michael has looked beyond the headline news to thoughtfully craft unique market insights for the year ahead. In this year’s Outlook, even with inflation metrics near their highest levels in two decades and an e