Transcription
Fibonacci RetracementMade Easy is just one of the range of freeresources that you can find at www.tradersbulletin.co.ukCheck out the website for more trading tools, reviewsand tutorials.Mark RoseTrader’s l be honest here one of the reasons I resisted Fibonacci trading for along time was that it was fiddly. You needed to plot lines onto your charts you might have to download special software for it and there was a bigmargin for error.I also had a fundamental issue with the ‘esoteric’ angle that many Fibonaccidevotees apply to this. We’re not solving the Da Vinci code here, and we’renot watching for oscillations in the moons of Jupiter we just want to knowwhen traders will stop buying and start selling or vice versa.However, over the years, two things have again and again brought me backto Fibonacci 1. I want to know where prices will turn, and how far they will run to.2. So many other traders are using this it has to work, if only becauseof crowd behaviour.And then, more recently, a final catalyst has turned me completely Somany trading platforms now draw on your Fibonacci levels at the touch of abutton. Dead simple – no fiddling.There’s absolutely no excuse now for not including these in your trading.What are Fibonacci levels?
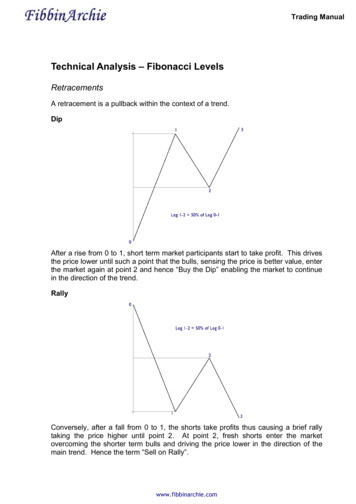
The key number that Fibonistas need to know is 1.618It’s the magic number that’s at the heart of the Fibonacci series, and formsthe backbone of a very widely used area of technical trading.Leonardo Fibonacci was a 13th century mathematician who, among otherachievements, brought the numbers 0–9 to Europe, long before Big Bird offSesame Street got the idea. And very useful they’ve turned out to be.What he’s most famous for, however, is his ability to count rabbits.The question that Fibonacci posed was how fast rabbits could breed. Let’ssay we’ve got two rabbits. After a time, they produce two new rabbits. Then,after a time, these four rabbits produce four more rabbits, and so on .The number of rabbit pairs each month goes something like this: 1, 1, 2, 3, 5,8, 13, 21, 34, Have you spotted the pattern?Each number is the sum of the previous two numbers.The number size increases in a spiral pattern, like this And it isn’t just rabbits Fibonacci sequences can be seen all over the natural world in the waythings grow, be they snail shells, the pattern of the florets in a flower, thebracts of a pinecone, the scales of a pineapple, a single cell or a hive ofbees.Plants and animals don’t know about this sequence – they simply grow in themost efficient ways. Many plants show the Fibonacci numbers in the
arrangement of the leaves around the stem. Some pinecones and fir conesalso show the numbers, as do daisies and sunflowers. Many other plants,such as succulents, also show the numbers. Some coniferous trees showthese numbers in the bumps on their trunks. And palm trees show thenumbers in the rings on their trunks.Why?Well, spirals are an efficient way for things to grow.But the Fibonacci proponents don’t stop there.Applying Fibonacci to economicsThese Fibonacci patterns are really neat. And I can understand why peoplebecome enthusiastic about them. As all good traders know – if a patternrecurs again and again, we should listen to it and take advantage of it.But the temptation is to try to make everything fit into these tidy patterns.Both nature and trading are inherently messy businesses – we shouldremember that!However, these spirals can be seen in population growth, in celldevelopment, in DNA, in our brains, and, many people believe they can becarried across into the very way we think and in how companies and stockmarkets grow.Is this number mysticism or the real deal?How it worksHere are the key facts.The ratio between consecutive Fibonacci numbers (i.e. dividing one numberby the next) moves towards the magic “golden ratio” number of 1.618 (or itsinverse, 0.618).The magic levels are at:61.8% (found by dividing one number in the series by the number thatfollows it)38.2% (found by dividing one number in the series by the number two placesto the right – is it just me, or is this getting more tenuous?)
23.6% (found by dividing one number in the series by the number threeplaces to its right. Still with me?)So, the purist Fibonacci fan will draw lines on his chart at 23.6%, 38.2%,50%, 61.8% and 100%, and will expect retracements to fall at these levels.Hang on – where did that 50% come from?It’s nothing to do with Fibonacci. The 50% line is actually to do with Gann(another mathematician who liked drawing lines on charts), but seems tohave been appropriated by Fibonistas.So, our most important Fibonacci levels are: 23.6%, 38.2%, 50% and 61.8%.(There’s also one at 78.6% if you don’t feel you’ve got enough lines on yourchart yet.)That’s a lot of numbers buthow do we actually use these tomake money?There are a huge number of ways in which Fibonacci levels can be used intrading they can be used vertically on charts, to measure out time theycan be used to map out price extensions but here I’d like to show you the simplest (and, I believe, most effective)way to use Fibonacci for measuring price retracements.What this will allow us to do, is to spot where a price has turned thatmeans we can get into (and out of) trades at the most opportune moments.First, we need to think about the anatomy of a price chart Sometimes the prices go up or down, like this:Sometimes they go up and down with no clear direction, like this:
But they never, never do this:Prices never move in straight lines. They’ll go up for a while, then traders willworry that they’ve become overpriced, and will sell some (cashing in theirprofits) – this selling will cause the price to fall back. When that price gets lowenough the buyers come back in, pushing the price up again.These are all the little (or sometimes not so little) bumps and wobbles we seeon our charts.What our Fibonacci levels do is give us a guide to where those ups anddowns will be.Let’s say we have a nice trend in action, like this upward trend
We’d like to get in on this action by buying into this price rise, but jumpinginto a trend can be tough – it’s all too easy to enter just as the price begins aretracement.What if you bought at B you might begin to panic, and cut your losses atC – just when the price starts moving in your favour again. These are thekinds of frustrations that trend-following traders will know all too well.The optimum places to enter this trend would be at C or E but how do weknow these will be turning points?Enter our hero the Fibonacci retracement level.Looking again at the trend we saw on the chart above
What we discover is that the turning points of C and E (the points we wantedto pinpoint for our entries) were Fibonacci retracement levels.By that, we mean that C is 38.2% of the way from B to A (the most recenthigh and low).And E is 61.8% of the way from D to C.Of course, prices don’t always turn on exact figures, like they do in textbooks but what these Fibonacci levels tell us is where they are LIKELY toturn. These are the points where we should be looking for price action toenter our buy trade.So, let’s get to the practicalities of using this information Marking up your chartsOne of the trickiest things about Fibonacci levels used to be marking themup on your charts. These days, most charting packages will do the hard workfor you however, you still need to make the judgement call on which recent highand low you’re measuring from.
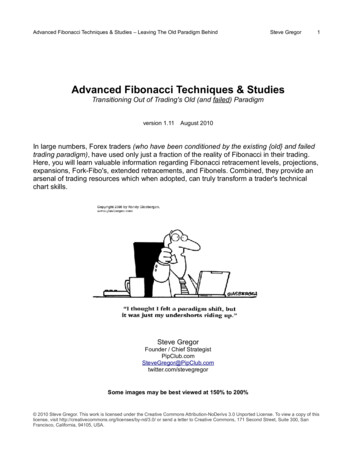
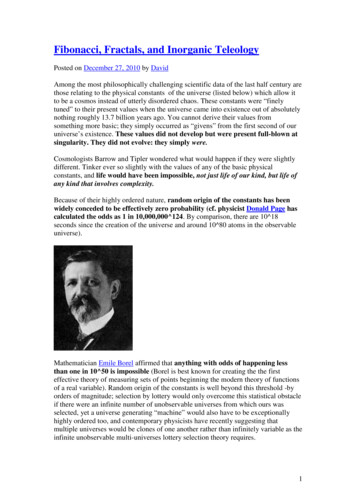
Because recent highs and lows can be subjective, there will often be somedisparity between where one traders Fibonacci levels are and those of thenext trader.Here’s how it looks In this example, we can see that the price turned at the 78.6% level, althoughthere was considerable congestion around the 61.8% level.So, let’s take another example, and see exactly how we’d have traded it Here we have the price in a nice downtrend on a 4-hr chart, which hasstarted to retrace upwards:
I’ve used my charting package to add the Fibonacci levels between therecent high and low. This should help me to judge where I can enter thisdowntrend.We can already see on the chart above that there’s a doji candlestick right onthe 23.6% level. We could look for a sell signal at this level, but bear in mindthat a retracement this small will give us limited profit potential. The biggerthe retracement – the more profit we can make when the price resumes itstrend.So, let’s see what happens
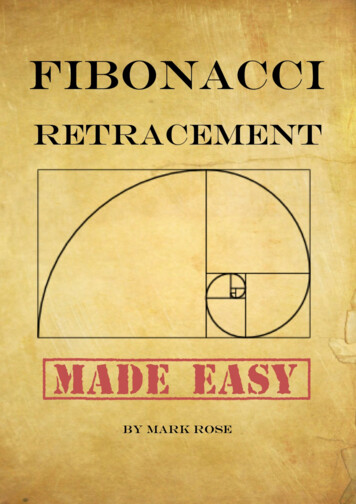
We don’t get a candlestick closing below the 23.6% level, and then the pricesurges up through 38.2% and 50%. We then see a red pin-bar candlestickpiercing the 61.8% level.Looking at a 4-hour chart, we could enter a down trade on the next candle,around A.However, we could switch to a shorter timeframe to perfect our entry By switching to a 1hr chart (see below), we get a neat topping out patternright on the 61.8% level, and can enter our sell trade earlier (where the redarrow is on the chart).
4 most common FibonacciRetracement mistakes1. Ignoring the long-term trendThis Fibonacci technique is best used for entering a long-term trend. Wewant to look for an established trend. And then to look for a turn in that trend– a price retracement that will give us a great, low-risk entry point.2. Applying Fibonacci levels to short-term tradesThis is tied up with the first error, because if we apply Fib levels to shorttimeframes, we’re ignoring the overarching trend.Fibonacci levels need time to establish, and work best on longer timeframes,like weekly, daily and 4 hourly charts.Shorter timeframes will often give us a lot of false signals as congestionbuilds around Fib levels. Take a look at the 1hr chart above, and note thecongestion at the 23.6% level – looking at this timeframe alone could havegot us into a losing trade.3. Ignoring other key levels
It’s easy to get carried away with our Fib levels and to completely forgetabout other key levels. Don’t forget to add historical support and resistancelevels to your chart too. Plus, if there are any round numbers – these couldbe more powerful turning points too.4. Using Fibonacci levels in isolationFibonacci levels give us very important clues about price turning points, butwe can’t draw them on and magically expect the price to ‘do something’ ateach of these key levels.Sometimes the price will turn at a Fib level sometimes it will surge througha Fib level and sometimes it will dither at aFib level, looking like it’s going to turn beforepowering on through That’s why Fibonacci alone isn’t enough toget us into the best trades. You cancombine Fibonacci with other technicalanalysis. If you don’t already have it, Istrongly recommend that you check outmy Price Action book. You can download acompletely FREE copy of it HERE.Mark RoseTrader’s Bulletinwww.tradersbulletin.co.uk
It’s the magic number that’s at the heart of the Fibonacci series, and forms the backbone of a very widely used area of technical trading. Leonardo Fibonacci was a 13th century mathematician who, among other achievements, brought the numbers 0–9 to Eur