Transcription
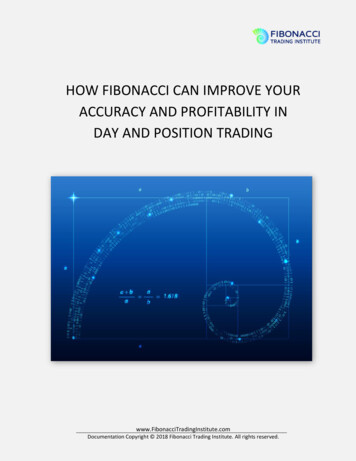
Fibonacci trading in ForexTo draw Fibonacci, we need to select a swing move. Additionally, we have to try to do that in the rightdirection. That is why it is crucial to understand price behaviour, trends, swings.Let’s start from a tricky question and basics of price behaviour. In which direction, can price move? Youprobably would answer: up and down. That is the correct answer, only that there is one “but”. What ifthere is no main trend? If there is no strong trend, price will probably move sideways. Statistics says thatprice is about 30% of time in a trend and rest of this time it’s moving in range. Why moving in a range issuch a bad thing? Because there is no clear direction and the price moves up and down so it is very hardto make money in that kind of movement. Just look at chart below, is it something you would like totrade?Sideway move exampleI don’t think so. What we want to trade is a trending market. Going into trend direction increases yourchances of success. Look at this beautiful trend below. Isn’t it something you would like to trade? On theshort-side of course!
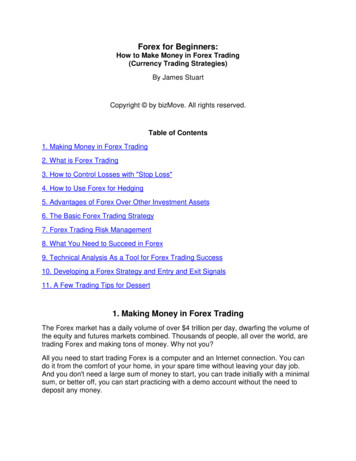
Downtrend exampleWe want to use Fibonacci technique in that kind of market. Before I go further and explain more aboutthis, there is another important thing you must learn.How to recognize trend?You should be able to easy recognize if there is a trend in place or not. Sometimes it is hard because ofthe “noise”, but there are some tips you can use.Look for higher highs and higher lows, if you are looking for uptrend. I have probably showed you thischarts before, but this is important. On chart below you can see an example of uptrend. You can seethat every high is higher than the previous one, and every low is higher than previous low.Higher high sequence
When you can find these elements on a chart, then you have identified an uptrend.In a downtrend, you should look for lower lows and lower highs. Each low is lower than the previousone, and each high is lower than previous high. Just like on chart below:Lower low sequenceIf you are able to identify lower lows sequence, than you have found a downtrend and you can plan toenter short position.In range market there is no sequence, therefore there is no trend.You can also use simpler tools to define trend. Most popular moving average is a good choice. Let’s sayyou are using 200 simple moving average. When moving average is rising and price is above that line,then there is a strong chance that trend is up. If trend is down, price will be under 200 SMA. Of course,this method does not make you 100% sure, but the chances are good.200 SMA
So, what really is Fibonacci trading?Now, when you know what kind of trends there are and how to recognize the current trend, we canmove to answer the question from the title. What is Fibonacci trading about?Fibonacci trading is a technique, where you are using tools based on Fibonacci numbers to predictpossible turning points.There are many tools which you can use for trading with Fibonacci. Each of them do a different job.Some are more important, some less. Lest review them quickly.How to trade with Fibonacci?Now you know what Fibonacci trading means, and what kinds of Fibonacci tools we have (plenty ofthem!). There is one more important question to answer. How should you trade with these tools?Notice that all these tools give you a potential level of support/resistance or potential exit points. This isvery valuable information! But how to use it for your benefit? Of course, I am not able to answer you ina few words, but I can give you some advice on what you should do.You should build a trading plan. The main core of your trading plan will be Fibonacci tools. As I wrotebefore, first include Fibonacci retracement and extension to your plan. Next, you need some signalswhich help you to enter and exit positions. The logic here is that when price is in an uptrend andcorrection occurs, you draw retracement levels. When price is near one of them, you do not know whichone will be a support. That is ok, because you define your own signal and when price returns to move upfrom correction, you get your signal. It might be something simple like moving averages crossover or asignal from some oscillator.Same with closing a position. You should define on which signal you will exit your position. It will beprobably near one of the expansion levels, so you will be ready to act.The last, very important part of your trading plan is money management. You should keep your lossessmall. It is very important to trade smart and not to risk too much.Some of this information is not very specific, but the whole topic about trading with Fibonacci is verywide. In the end, it is about practice, practice, practice. You should be testing new ideas and gettingexperience. Trading with Fibonacci is great, because you have possible support and resistance levels andeven exit points. Of course, they are only possible levels, but on many time frames they work excellent.You need to build your whole trading plan around these levels, so around Fibonacci tools. Add to thisentry and exit signals and proper money management system and you are on great way to success intrading.
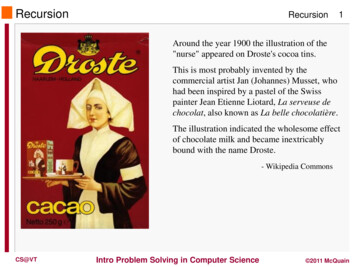
ABCD and Fibonacci tradingThere are more advanced techniques to trade with Fibonacci, but you should start with ABCD. This is asimple yet powerful approach. In short, we look for a swing. Based on that swing we draw our Fibonaccilines (A and B). Next, we wait for a correction to retracement – C. After that we open a trade and waitfor continuation move towards D (which is an extension line).Look at some examples below, it should be clear.Fibonacci trade examples - GBP/JPY 1 hour chartHere we have example of GBP/JPY. We can see that after strong move down (from A to B) there was acorrection up. This was a good moment to draw Fibonacci lines and wait for signal to go short.Correction ended at 78.6% and after that there were signals from MACD and Stochastic. This short tradeworked well. Move ended at 138.2 Fibonacci extension and it was our D point.
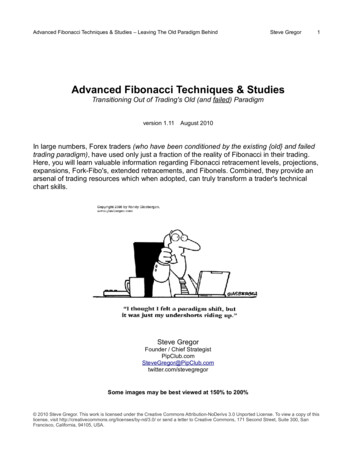
50 EUR/USD 30mIn this EUR/USD example, the time frame is 30m. We are in an uptrend and after a strong move to the Bthere was a correction. It was rather deep, down to the 78.6 retracement line (our C point). NextEUR/USD returned to the uptrend. We saw some signals to go long. This was a strong move up, withshort stop at 161.8% extension line. Eventually move ended at 200% extension line, this was our D point.DAX 15m
Above is 15m chart of DAX. It is a good example, because it shows how universal Fibonacci tools are.They work with currency, with commodities, stocks, indices On the chart, we can’t see the left side – there was an uptrend move before. It ended, price went downbelow averages. There was a correction to the C (50% retracement). From there some move in the rangeand strong move down to the 200% extension line (D).
Fibonacci trading is a technique, where you are using tools based on Fibonacci numbers to predict possible turning points. There are many tools which you can use for trading with Fibonacci. Each of them