Transcription
Fibonacci Retracement Trading Strategy and BacktestingClarissa GunawanDepartment of Computer Science and EngineeringCOMP 4971C: Independent ProjectSupervised by: Dr. David RossiterSummer 2020
FIBONACCI RETRACEMENT TRADING STRATEGY AND BACKTESTING2AbstractTraders often use the Fibonacci numbers for technical analysis. Historically, stock prices tend to obey theFibonacci retracements as levels of support and resistance, but there does not seem to be any prove why thisis so. This study aims to test the validity of using Fibonacci as a technical analysis tool and optimise theFibonacci trading strategy by combining the strategy with other indicators, using US-based Vanguard ETFsas a test subject. The results of this study prove that trading using Fibonacci retracements might lead tounprofitable results, significantly underperforming the passive trading strategy.
FIBONACCI RETRACEMENT TRADING STRATEGY AND BACKTESTING3Table of ContentsAbstract . 2Table of Contents . 3Table of Figures . 41.2.3.4.5.6.7.Introduction . 51.1.Fibonacci numbers and retracement levels . 51.2.Fibonacci application in trading . 6Methodology . 92.1.Exchange-Traded Fund (ETF) selection . 92.2.Initial capital and commissions . 92.3.Source of data and software . 92.4.Result analysis . 9Strategy Development . 113.1.Moving Fibonacci . 113.2.Conditions for a long entry. 133.3.Conditions for a short entry . 133.4.Conditions for exit. 143.5.Stop-loss . 16Strategy Testing (Part 1) . 184.1.EMA Benchmark Strategy . 184.2.Trend Reversal Indicator Strategy. 194.3.EMA Crossover Strategy . 194.4.Trend Reversal Indicator EMA Crossover Strategy . 204.5.Relative Strength Index (RSI) Strategy . 204.6.Hull Moving Average (HMA) Strategy . 214.7.Results: Average – Strategy Testing (Part 1) . 22Strategy Testing (Part 2) . 255.1.HMA Benchmark Strategy . 275.2.EMA Crossover Indicator . 275.3.RSI Strategy . 285.4.ATR Stop-Loss Strategy . 285.5.Results: Average – Strategy Testing (Part 2) . 29Strategy Testing (Part 3) . 296.1.89HMA Benchmark . 306.2.ATR Stop-Loss Strategy . 306.3.Results: Average – Strategy Testing (Part 3) . 31Conclusion . 31
FIBONACCI RETRACEMENT TRADING STRATEGY AND BACKTESTING4Appendix A . 32Appendix B . 38Appendix C . 42Table of FiguresFigure 1: Fibonacci Retracement Setup in an Uptrend . 7Figure 2: Fibonacci Retracement Setup in a Downtrend . 8Figure 3: Moving Fibonacci. 12Figure 4: Pivot Low . 13Figure 5: Pivot High. 14Figure 6: -0.618 Take Profit Level . 15Figure 7: Fibonacci Stop-Loss – Long Entry. 16Figure 8: Benchmark Strategy Stop-Loss – Short Entry . 17Figure 9: Trailing Stop-Loss – Long Entry. 17Figure 10: Trend Reversal – Short Entry . 18Figure 11: Time-Lag with the 50EMA and 100EMA Crossover . 24Figure 12: Trend Detection Using 100HMA Gradient . 26
FIBONACCI RETRACEMENT TRADING STRATEGY AND BACKTESTING51. Introduction1.1.Fibonacci numbers and retracement levelsIn 1202, an Italian mathematician Leonardo Bonacci (also known as Fibonacci) wrote a book called LiberAbaci (“The Book of Calculation”), where he introduced the Fibonacci sequence:0, 1, 1, 2, 3, 5, 8, 13, 21, 34, 55, 89, 144, 233, 377, 610, 987 to infinity.where:S0 0, S1 1, and Sn Sn-1 Sn-2, for n 11.When we divide any number in the sequence with the preceding number, the ratio converges to 1.618 (forexample, 610/377 1.618), making it a mathematically significant number. This is known as the Golden Ratioφ (also known as the Golden Mean or Divine Proportion) 2:φ lim n SnSn-1(1)The Fibonacci sequence is widely applicable in nature. For example, the number of flower petals is equal to anumber in a Fibonacci sequence, and equiangular spirals (which are found in snail shells or seashells) can becreated through the Fibonacci numbers. The widespread application of the Fibonacci made it often referred toas the “numbers of nature”.Today, many technical traders use the Fibonacci Ratios to identify key levels of support and resistance todetermine entry and exit opportunities. The commonly used ratios for analysis are: 0, 0.236, 0.382, 0.5, 0.618,0.786, 1.0, -0.236, -0.382, -0.618 and -0.786 levels3. These numbers are mathematically related to oneanother4:1.0 - 0.618 0.3820.618 0.618 0.3821.0 0.502 0.618 0.7861Fibonacci number. (2020, July 26). Retrieved from https://en.wikipedia.org/wiki/Fibonacci number2Fiorenza, A., & Vincenzi, G. (2013, March 18). From Fibonacci Sequence to the Golden Ratio. Retrievedfrom /3Mitchell, C. (2020, August 01). Fibonacci Retracement Levels. Retrieved retracement.asp4Boroden, C. (2008). Fibonacci trading: How to master the time and price advantage. New York: McGrawHill.
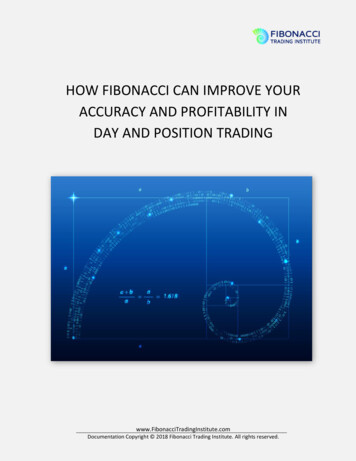
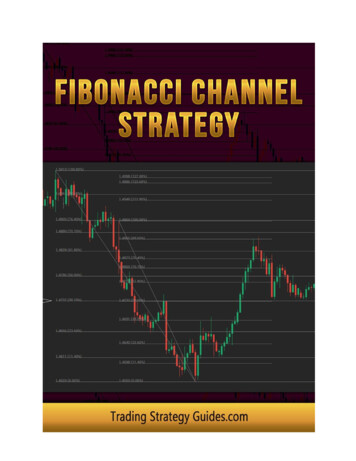
FIBONACCI RETRACEMENT TRADING STRATEGY AND BACKTESTING61 1.6180.6180.618 - 0.382 0.2360.382 0.618 0.236The 0, 0.236, 0.382, 0.5, 0.618, 0.786, and 1.0 levels are known as Fibonacci retracement levels, which arelevels of support and resistance in trading. The -0.236, -0.382, -0.618 and -0.786 levels are known as the profittargets or projection levels, as it predicts the future price levels.1.2.Fibonacci application in tradingTo set up the Fibonacci retracement manually, analysts first need to identify the general trend in the timeperiod. Then, the Fibonacci retracement tool is dragged from a low point to a high point in an uptrend, or froma high point to a low point in a downtrend. The retracement levels will then be shown automatically based onlow and high points.In an uptrend, traders will enter a trade after the price passes through the support level and will exit once thestock price passes through the target profit level (-0.236, -0.382, -0.618 or -0.786). Conversely, in a downtrend,short sellers will enter the trade after the price passes through the resistance level and will exit the market oncethe price passes through the target profit level. Based on Figures 1 and 2, the Fibonacci retracements seem toact as levels of support and resistance, albeit failing to capture all of the key levels.Depending on the type of investors, different target profit levels are used. For example, risk-averse investorswould take profit at the -0.236 level, while risk-loving investors would do so at the -0.786 level. There is agreater chance that prices will reach the -0.236 level, but it yields lower profits than the -0.786 level. Thisstudy will investigate the performances of each target profit level.Another application of Fibonacci in trading is the Fibonacci extensions, which take into account the pullback(in addition to the low point and the high point of the prices) to predict future prices. Similar to the projectionlevels, the extension levels are usually regarded as profit targets. However, Fibonacci extensions will beoutside of the scope of this study.
FIBONACCI RETRACEMENT TRADING STRATEGY AND BACKTESTING7Figure 1Fibonacci Retracement Setup in an UptrendHigh point*ResistanceSupportLow point**of the period under assessment
FIBONACCI RETRACEMENT TRADING STRATEGY AND BACKTESTING8Figure 2Fibonacci Retracement Setup in a DowntrendHigh point*ResistanceLow point*Support*of the period under assessment
FIBONACCI RETRACEMENT TRADING STRATEGY AND BACKTESTING92. Methodology2.1.Exchange-Traded Fund (ETF) selection3 ETFs were used in this study:1. Vanguard Large-Cap ETF (VV)2. Vanguard Mid-Cap ETF (VO)3. Vanguard Small-Cap ETF (VB)These ETFs track the Center for Research in Security Prices (CRSP) Large Cap, Mid Cap, and Small Capindex, respectively. Vanguard ETFs were used to measure the performance of the Fibonacci trading strategiesas it contains a diversified group of US-based companies, which would reflect the market conditions betterthan simply measuring the performance of strategies on individual stocks.2.2.Initial capital and commissionsIn this study, the initial capital will be US 10,000. The cost of purchase (i.e. trade commissions) is assumedto be zero throughout the study.2.3.Source of data and softwareAll historical data used in this study is retrieved from TradingView. The strategies are backtested usingTradingView’s Pine Script. The backtest results are exported into Comma Separated Values format usingAutoview, which is a Chrome extension. The results are then displayed in Microsoft Excel.2.4.Result analysisTo analyse the backtest results, the following indicators were chosen.2.4.1. Profit factorThe profit factor is the ratio of the gross profit to the gross loss. A profit factor above 1 is considereddesirable as it shows that the strategy makes a profit.Profit Factor Gross ProfitGross Loss(2)2.4.2. Net profitIn this study, the net profit is measured by the ratio of the gains or losses from the investment to the initialcapital. The net profit is calculated by:Net Profit Gross Profit – CommissionInitial Capital(3)
FIBONACCI RETRACEMENT TRADING STRATEGY AND BACKTESTING102.4.3. Sharpe ratioThe Sharpe ratio is used to calculate the return of the strategies while taking into account the risk (i.e.volatility or price fluctuations). A higher Sharpe ratio is desirable as there is higher return and/or lowerrisk. The Sharpe Ratio is calculated by:Sharpe Ratio Rp - Rfσp(4)where:R p portfolio returnR f risk-free rateσp standard deviation of portfolio excess return2.4.4. Maximum Drawdown (MDD)An MDD is the maximum observed loss of the trade. A lower MDD is better as it shows that there is alower downside risk. The MDD is calculated by:VP - VTVpMDD (5)where:VP peak valueVT trough value2.4.5. Compound Annual Growth Rate (CAGR)The CAGR is the “smoothed” growth rate of an investment over a time period longer than one year. Ahigher CAGR is better as it signals a high return of investment. The CAGR is calculated by:CAGR (VfinalVbeginning1t) 1(6)where:Vfinal final value of the investmentVbeginning beginning value of investment / initial capitalt time in years2.4.6. Buy and HoldBuy and hold refers to when all funds (initial capital) were used to buy the security when the first trade isentered, and the position was held for the duration of the test period5. In other words, this is a passivetrading strategy. In this study, the buy and hold strategy is measured in terms of the returns and CAGR.(i)Returns. The buy and hold return will be compared with the net profit to check if an active tradingstrategy brings greater returns compared to a passive strategy. This is calculated by:5How are Strategy Tester Report values calculated and what do they mean? (n.d.). Retrieved alculated-and-what-do-they-mean/
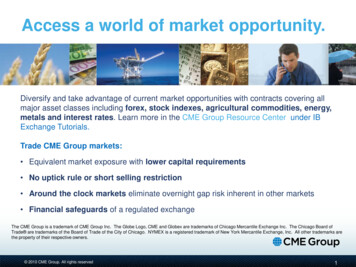
FIBONACCI RETRACEMENT TRADING STRATEGY AND BACKTESTINGBuy and Hold Return Vfinal – VbeginningVbeginning11(7)where:Vfinal final value of the investment (as of 24 July 2020)Vbeginning beginning value of investment / initial capital(ii)CAGR. The buy and hold CAGR will be compared with the CAGR of the active trading strategy.The formula would be the same as Equation (6). The beginning value would be the first price ofthe ETF when it was launched (VV, VO, and VB were launched on 30 January 2004), and theending value would be the final price of the ETF as of 24 July 2020.3. Strategy Development3.1.Moving FibonacciIn this study, the 1-Day time period is used, as it is a medium time frame. Thus, it captures the general trendof the market but eliminates the market noise from a shorter time period.To start this study, a “Moving Fibonacci”, which is the historical retracement and projection levels, is plotted.This is done by looking back at a certain number of candlesticks as a time frame and determining the highestand lowest point within the specified time frame. This study looks back 100 candlesticks (in other words, theprevious 100 trading days). Also, since Fibonacci trading relies on long term trends, the 100-time period wouldbe able to capture that trend6. The time frame and Fibonacci levels will be adjusted as new candlesticks areformed over time.The “Moving Fibonacci” considers whether the chart is uptrend and downtrend. The initial condition for anuptrend is that if the Exponential Moving Average of the previous 50 candlesticks is higher than the previous100 candlesticks (i.e. 50EMA 100EMA). The condition for a downtrend is when 50EMA is less than100EMA (i.e. 50EMA 100EMA) 7. This condition will change in the latter part of the study. In an uptrend,the profit targets will be above the highest point, as this provides an opportunity for a long entry. In adowntrend, the profit targets will be below the lowest point, as this provides a shorting opportunity.The diagram below shows the Moving Fibonacci. The blue lines are the retracement levels and the red linesare the profit targets.6Lee, R. (2020, April 30). Top 4 Fibonacci Retracement Mistakes to Avoid. Retrieved /fibonacci-rules.asp7Rolf, Romz, Fred, Nkosinathi, Saba, Romy, . . . Rao, S. (2019, October 23). How To Use MovingAverages - Moving Average Trading 101. Retrieved from es/
FIBONACCI RETRACEMENT TRADING STRATEGY AND BACKTESTING12Figure 3Moving Fibonacci0 level0.236 level0.382 level0.5 level0.618 level0.786 level1 level-0.236 level-0.382 level-0.618 levelDowntrendUptrend-0.786 level
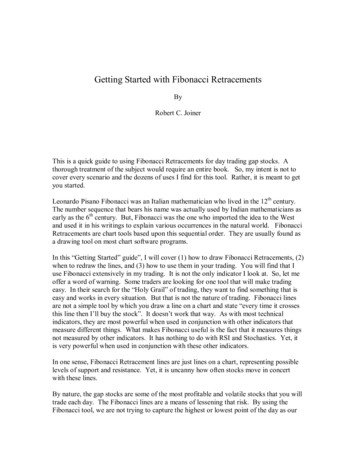
FIBONACCI RETRACEMENT TRADING STRATEGY AND BACKTESTING3.2.13Conditions for a long entry3.2.1. Pivot lowA pivot point with a period of 2 will be used. A minimum of 2 candlesticks before and after the pivot lowpoint will have higher lows for this condition to be fulfilled. The illustration can be found in the figurebelow.Figure 4Pivot LowPivot low3.2.2. Fibonacci retracement as a support levelThe pivot low candlestick body crosses a Fibonacci retracement level. The retracement level would beregarded as a level of support.3.2.3. UptrendThe conditions for an uptrend will be 50EMA 100EMA in Part 1 of the study, positive 100HMA gradientfor Part 2, and positive 89HMA gradient for Part 3.3.3.Conditions for a short entry3.3.1. Pivot highA pivot point with a period of 2 will be used. A minimum of 2 candlesticks before and after the pivot highpoint will have lower highs for this condition to be fulfilled. The illustration can be found in the figurebelow.
FIBONACCI RETRACEMENT TRADING STRATEGY AND BACKTESTING14Figure 5Pivot HighPivot high3.3.2. Fibonacci retracement as a resistance levelThe pivot high candlestick body crosses a Fibonacci retracement level. The retracement level would beregarded as a level of resistance.3.3.3. DowntrendThe conditions for an uptrend will be 50EMA 100EMA in Part 1 of the study, negative 100HMAgradient for Part 2, and negative 89HMA gradient for Part 3.3.4.Conditions for exitThe strategies will exit when prices reach the -0.236, -0.382, -0.618 or -0.786 projection levels at the time thetrade is entered. Each of the strategies tested in this study will track the performances of the 4 projection levels.The figure below shows the short entry and exit for a historic -0.618 level.
FIBONACCI RETRACEMENT TRADING STRATEGY AND BACKTESTING15Figure 6-0.618 Take Profit Level1 levelTake profit level (historic-0.618 level)0.786 level0.618 level0.5 level0.382 level0.236 level0 level-0.236 level-0.382 level-0.618 level-0.786 level
FIBONACCI RETRACEMENT TRADING STRATEGY AND BACKTESTING3.5.16Stop-lossA stop-loss is added to ensure that the position is not held for too long. In this study, 3 different types ofstop-losses will be tested.3.5.1. Fibonacci Stop-lossThe stop-loss for a long entry is placed on the retracement level below the support level. The stop-loss fora short entry is placed on the retracement level above the resistance level. The illustration can be seen inFigures 7 and 8 below.Figure 7Fibonacci Stop-Loss – Long Entry0.382 level0.5 level0.618 levelCandlestick crosses the0.786 retracement levelStop-loss (historic 1 levelat long entry)0.786 levelPivot low1 level
FIBONACCI RETRACEMENT TRADING STRATEGY AND BACKTESTING17Figure 8Fibonacci Stop-Loss – Short Entry1 levelStop-Loss (historic 0.786level at short entry)0.786 level0.618 levelCandlestick crosses the0.618 retracement level0.5 levelPivot high0.382 level0.236 level0 level-0.236 level-0.382 level3.5.2. Trailing stop-lossThe stop-loss for a long entry would be the lowest point of the previous candlestick, and the stop-loss fora short entry would be the highest point of the previous candlestick. If the stop-loss condition is met, itmay signal a trend reversal8, meaning that it would be a good exit point. The illustration can be seen inFigures 9 and 10 below.Figure 9Trailing Stop-Loss – Long EntryStop-loss (previous day’s low)8Investopedia. (2020, May 29). Determining Where to Set Your Stop-Loss. Retrieved 5/how-do-i-determine-where-set-my-stop-loss.asp
FIBONACCI RETRACEMENT TRADING STRATEGY AND BACKTESTING18Figure 10Trend Reversal – Short EntryStop-loss (previous day’s high)level3.5.3. Average True Range (ATR)The ATR measures volatility, and it can be used to determine the stop-loss. In this study, the stop-losswill be placed 1 ATR below the long entry price, and 1 ATR above the short entry price. An ATR with aperiod of 14 days will be used, as this is the standard. As a reference, the ATR is calculated in 2 stepsby:TR Max [(H - L), (H - CP) , (L - CP) ](8)n1ATR TRin(9)i 14. Strategy Testing (Part 1)In this part of the strategy testing, the strategy focuses on the use of 50EMA 100EMA as an uptrendindicator, and 50EMA 100EMA as a downtrend indicator. The strategy results show the averageperformances of VV, VO, and VB.4.1.EMA Benchmark StrategyThis strategy randomly enters and exits the market purely based on the Fibonacci retracement levels, withthe conditions outlined in the setup. A Fibonacci stop-loss is placed.4.1.1. Results: EMA Benchmark StrategyTable 1EMA Benchmark Strategy ResultsProfitProfit FactorNet 81.3563.23%-0.7861.1744.86%Average1.3556.79%Start Year – End Year: 2004 – 2020Buy and hold return: 224.30% (CAGR: 5%1.79%ClosedTrades4939403140
FIBONACCI RETRACEMENT TRADING STRATEGY AND BACKTESTING19The results show that for each profit targets, the net profit and CAGR is significantly below the buy andhold return and CAGR, respectively. This is expected, as the trades are done without verifying whetherthe trend is actually bullish or bearish.4.2.Trend Reversal Indicator StrategyThe strategy has the same entry points as the setup. A trailing stop-loss is placed.4.2.1. Results: Trend Reversal Indicator StrategyTable 2Trend Reversal Indicator Strategy ResultsProfitProfitNet 022.40%0.03Average1.1315.83%0.02Start Year – End Year: 2004 – 2020Buy and hold return: 231.63% (CAGR: e results are worse than the EMA Benchmark Strategy in terms of the profit factor, net profit, Sharperatio, and CAGR, but better in terms of MDD. A lower MDD was achieved due to the conservative stoploss, which led to a significantly higher number of closed trades compared to the benchmark strategy. Thisshows that a conservative stop-loss would work against the investor in terms of profitability but achieveslower volatility.4.3.EMA Crossover StrategyIn addition to the entry requirements stated in the setup, this strategy checks whether the trend shows a bullishor a bearish pattern using the EMA crossover. The trend is considered bullish if the EMA of the previous 50candlesticks is greater than or equal to the EMA of the previous 200 candlesticks (i.e. 50EMA 200EMA).Conversely, the trend is bearish if 50EMA 200EMA, and the strategy will enter a short trade. A Fibonaccistop-loss will be placed.
FIBONACCI RETRACEMENT TRADING STRATEGY AND BACKTESTING204.3.1. Results: EMA Crossover StrategyTable 3EMA Crossover Strategy ResultsProfitProfit Factor Net 0.02Average1.3349.38%0.02Start Year – End Year: 2004 – 2020Buy and hold return: 188.54% (CAGR: e results show a worse profit factor, net profit, and Sharpe ratio, but a slightly better MDD and CAGRcompared to the EMA Benchmark Strategy. In general, it performs worse than the benchmark, showingthat checking the longer-term trend (i.e. 200 EMA) may not necessary, as it can be too limiting.4.4.Trend Reversal Indicator EMA Crossover StrategyThis strategy combines the Trend Reversal Indicator and EMA Crossover strategies. Trades will be executedwhen both the EMA crossover conditions (i.e. 50EMA 200EMA for an uptrend, and 50EMA 200EMAfor a downtrend) and the setup conditions are met. The trailing stop-loss is placed.4.4.1. Results: Trend Reversal Indicator EMA Crossover StrategyTable 4Trend Reversal Indicator EMA Crossover Strategy ResultsProfitProfit Factor Net 4129.77%-0.0116.87%Start Year – End Year: 2004 – 2020Buy and hold return: 188.54% (CAGR: 5625859The results show a better profit factor and MDD compared to the EMA Benchmark Strategy. However,the net profit, Sharpe ratio, and CAGR are much worse. Overall, this strategy performs poorly in terms ofprofitability, and this was due to the lower volatility of the trades from a conservative stop-loss.4.5.Relative Strength Index (RSI) StrategyThis strategy checks whether the ETF is overbought or oversold based on the RSI of 14 periods, which is thestandard time period. A long trade will be placed either when the RSI is oversold (RSI 30), or when the
FIBONACCI RETRACEMENT TRADING STRATEGY AND BACKTESTING21entry conditions are met. A short trade will be placed either when the RSI is overbought (RSI 70)9, or whenthe entry conditions stated in the setup is met. Unlike the previous strategies, which looks at the historicalprices and assumes that the trend will be the same in the future, the RSI looks more into the future based onthe present demand or strength of the buyers relative to the supply. As a reference, the RSI is calculated asfollows:RSI 100 -100Avg. upward price change1 Avg. downward price change(8)The Fibonacci stop-loss is also placed in this strategy.4.5.1. Results: RSI StrategyTable 5RSI Strategy ResultsProfitProfit Factor Net %0.03Average1.1315.83%0.02Start Year – End Year: 2004 – 2020Buy and hold return: 231.63% (CAGR: e results perform very poorly in all indicators compared to the EMA Benchmark Strategy, except forthe MDD. This shows that Fibonacci retracements might not work very well with RSI.4.6.Hull Moving Average (HMA) StrategyThe HMA computes the average prices with less lag compared to the EMA or Simple Moving Average(SMA)10. This strategy enters a long trade when the gradient of the 100HMA is positive (this shows that pricesare in the uptrend direction, which is a bullish pattern), and when the setup conditions are met. Conversely,the strategy enters a short trade when the gradient of the 100HMA is negative, and when the setup conditionsare met. As a reference, the HMA is calculated as follows:n1. Calculate a Weighted Moving Average (WMA) with period 2 and multiply it by 22. Calculate a WMA for period n and subtract it from step 19Blystone, D. (2020, April 06). Overbought or Oversold? Use the Relative Strength Index to Find Out.Retrieved from ng/042114/overbought-or-oversoldu
Fibonacci retracements as levels of support and resistance, but there does not seem to be any prove why this is so. This study aims to test the validity of using Fibonacci as a technical analysis tool and optimise the Fibonacci trading strategy by combining the strategy with other in