Transcription
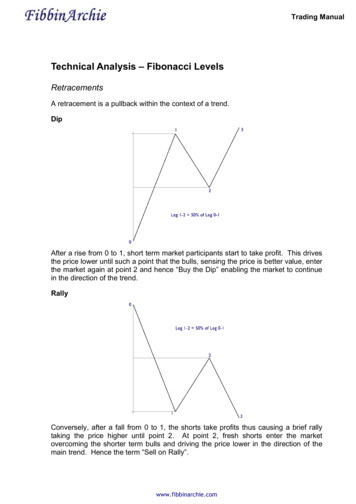
Trading ManualTechnical Analysis – Fibonacci LevelsRetracementsA retracement is a pullback within the context of a trend.DipAfter a rise from 0 to 1, short term market participants start to take profit. This drivesthe price lower until such a point that the bulls, sensing the price is better value, enterthe market again at point 2 and hence “Buy the Dip” enabling the market to continuein the direction of the trend.RallyConversely, after a fall from 0 to 1, the shorts take profits thus causing a brief rallytaking the price higher until point 2. At point 2, fresh shorts enter the marketovercoming the shorter term bulls and driving the price lower in the direction of themain trend. Hence the term “Sell on Rally”.www.fibbinarchie.com
Trading ManualThe most popular type of retracement used in the Forex market is, undoubtedly, theFibonacci retracement. Popular Fibonacci retracements are 25%, 38.2%, 50%,61.2% and 78.6%.Notice how the downleg retraces 61.8% of the first upleg, 1.2970-1.3470, beforecontinuing with the trend upwards.In general, the larger retracements are found at the start and end of a trend as themarket is deciding whether or not the previous trend has finished, maybe ranging alittle before starting the next trend. Once more and more market participants realisethat a new trend is in place, the retracements of the previous leg become smaller indepth with 38.2% and 50% being the most common. As the trend appears to run outof steam, the market becomes undecided and starts to take profit thus causing adeeper retracement of the previous leg eg. 61.8% or 78.6%In a trending market, the shallower the retracement the stronger the trend.www.fibbinarchie.com
Trading ManualExtensionsExtensions are used to project where a price may go to and are useful for calculatingtarget prices when entering a tradeAs with retracements, the most popular type of extension used in the Forex market isthe Fibonacci extension. The extensions that provide the most commonly usedprojections are 61.8%, 100%, 161.8% and 261.8%How to UseIn the example below, each one of the Fibonacci extensions represents a potentialtarget when entering a trade. Once a pullback is in place at point 2, we can calculatethe potential targets using Fibonacci extensions. Our initial targets will be 100% at103.85 and 161.8% at 104.78. Further out our target will be 261.8% at 106.28. Thestronger the trend, the greater the chance that the targets will be achieved.www.fibbinarchie.com
Trading ManualCombining what we have seen so far:The one thing that can be said about Technical Analysis is that it is easy to seeeverything in hindsight, that is, when it is too late. Let’s look at the above USDJPYexample in more detail, starting from the point where the market is trading sideways,and use the techniques described so far to see how they are applied in preparationfor the next move.Starting with the daily chart so that we have an overall perspective of how the marketis biased:www.fibbinarchie.com
Trading ManualThe blue line represents the long term trendline resistance. The black line representsthe medium term trendline resistance that is currently in play. The red line is theprevious medium term trendline support, the break of which initiated the current downtrend. Notice the pullback on 12 and 13 October, after the initial breach of the redtrendline support, confirming that it now acts as resistance. We can also see that themarket has been trading sideways in a range since the 24 November.Let’s apply some of the techniques in retrospect to see how the market behaved andto obtain a feel for what we should expect about the current market level. The chartbelow is the above chart after applying Fibonacci retracement and extensioncalculations plus a support line.First thing to notice is that point 2 is a retracement of approximately 78.6% of leg 0-1indicating to us that we may have the base of another trend.Secondly, by plotting the Fibonacci extensions of the leg 0-1 we see some interestingresults, namely that at each of the extensions there is a pause or turning point. Thisindicates that perhaps the market has been using this series of extensions as targetsand taking profits when reached.Thirdly, we see that the 24 June support at 107.00 acted as a resistance zone for thepullback of 10 November.Fourthly, and perhaps of the most interest given the current scenario, we see thatrecent price action has pulled back from the 261.8% extension at 101.99 and hasranged since reaching that level. Recent price action at this level may prove to beconsolidative before moving lower or may be an early indication that a retracement isdue.www.fibbinarchie.com
Trading ManualWe now have a model of how the market has behaved in the recent past and canconcentrate on the analysis to anticipate where it may go in the near future. To dothis we need to examine the recent price action in more detail. We can achieve thiswith an hourly chart:www.fibbinarchie.com
Trading ManualBreaking the chart down we see that from 24 November to 1 December the markethas been trading in a range between 102.45/40 support and 103.40 resistance withan intermediate resistance at the 103.00 level. Figures ending in .00, .25, .50 and.75 have a psychological effect on the market with those in bold being moresignificant. This can be seen in the above example where 102.50 also provides asupport zone.On 1 December the market accelerates a short term down trend which enticesenough sellers on board to overcome the 102.45/40 support level. However ataround 101.90 buying pressure suddenly overcomes the selling pressure at the timeof the European markets opening on 2 December.The shorter term traders, momentum traders and traders entering late, start to bailout on realising that buyers have entered the market. This in turn attracts the rangetraders back in as the price moves above 102.45/40 and the nett effect is a “shortsqueeze” where the shorts are squeezed out of their positions.The squeeze continues up to the short term down trend resistance from where themarket trades a 40 pip range whilst it decides upon the next move. During this phasebuy stops will start appearing above the short term down trend resistance as thepositional traders look to lock in profit and those looking for the breach place buyorders to take advantage of any breakout to the upside.When the breakout through the short term down trend resistance does occur, it isswift as the triggering of stops lifts the market through the 103.00 resistance level.103.00 then proceeds to act as a support level with 103.40 as the next resistanceabove.One observation to make note of: When a market breaks out of a range, or someother pattern such as a triangle, but fails to follow through and reverses, in manycases it will reverse to the other side of the range, or pattern, that it broke out of.This is exactly what happened here when the market reversed at 101.90. Theensuing trend traded up to and through the upper side of the range at 103.40.The breach of 103.40 did not have the momentum to sustain further bullish actionand was promptly sold off, triggering sell stops, all the way back to the 101.90 [point0 on chart] support. Data released that day would have also influenced the priceaction and this is discussed in Fundamental Analysis.Price action after point 0 develops in the shape of a triangle or wedge with the high at1 and the low at 2 producing a narrowing range. The chart below zooms in on thiswedge so that it can be seen more clearly:www.fibbinarchie.com
Trading ManualIt can be seen that point 2 is at 102.37 which is close to the 61.8%, at 102.45,retracement of the previous upleg 0-1. Remember, the deeper retracements occur atthe start and end of a trend. In addition, we have support at 102.45/40 which heldthe downleg 1-2. Price action is also making higher highs and higher lows. So thiscould be interpreted as the start of trend. Some traders will be entering longs asclose to the short term up trend support connecting 0-2 with stops the other side ofthis support. Others will be sidelined waiting for a breakout of the wedge beforeentering.It is at this point that initial target projections from point 2, 102.37, can be made usingFibonacci extensions of the upleg 0-1, 101.88-103.38. Referring to the third diagramin this example, it can be seen that these projections come in at:102.37 (61.8% x (103.38-101.88)):103.29102.37 (100% x (103.38-101.88)):103.87102.37 (161.8% x (103.38-101.88)):104.79102.37 (261.8% x (103.38-101.88)):106.27Most charting applications will have an extension tool that will plot these values foryou, saving you having to calculate them manually.Before getting carried away thinking that we have found a trend and its potentialtargets, we must remember that there is still some resistance overhead at 103.00,103.40, the upper trendline resistance of the wedge and also the longer termtrendline resistance from 111.43 high of 7 Oct through 107.29 high of 10 Nov that willneed to be overcome.The chart below shows the ensuing breakout to the upside a few hours later:www.fibbinarchie.com
Trading ManualJust before the breakout a smaller triangle/wedge, shown in red, develops indicatingthat the market is pausing as it realises that the upper wedge resistance, in black, iscoming into focus around 103.25. Above this is the 103.29 Fibonacci extension andthe 103.40 resistance level.This cluster of levels provides an ideal location for the placement of entry buy stopsas a) there will be those traders that see the trendline resistance provided by theupper peaks of the wedge as perhaps a place to short from and will have placed theirbuy stop loss orders to the upside and b) many traders will be using similar technicalanalysis and thus also be placing entry buy stops there too.When the smaller triangle is broken out to the upside, there is enough momentum inthe breakout to trigger the stops through 103.25, the area of the trendline resistanceprovided by the wedge. Other traders, seeing that the wedge has been breached,may also have joined the trend buying at market.To view how trading action from the perspective of a short term trader, let’s zoom inon a 5 minute chart:www.fibbinarchie.com
Trading ManualWe can see the:1. horizontal supports, in red, at 103.00, 103.40 and 103.602. Fibonacci extensions, in purple, at 103.29 and 103.873. wedge support and resistance in black.4. immediate trendline support in red5. short term trendline support6. medium term trendline resistanceNotice that immediately after the breakout, there was a pullback to the wedgeresistance from which the breakout occurred. At which point more traders enteredlong placing their stops beneath this former resistance anticipating that it would actas support.It is also evident that the market was aware of the overhead medium term trendlineresistance coming in at just under 104.00, as well as the 100% Fibonacci extensionat 103.87, by the choppy manner in which it reached that level through theintermediate resistances. This is a longer term trendline and is thus not likely to bebroken on a first attempt. This becomes clear when we see some immediate profittaking when this level is reached. Other traders will have seen this as an opportunityto short as the risk is defined by placing the stop loss above the medium termtrendline resistance. This would have helped accelerate the fall from 103.99 to103.62.However, we can see that the former resistance level at 103.60 is now providingsupport. This is further strengthened by the immediate trendline support and the factthat 103.61 is 38.2% of the rise from 103.00 to 103.99. Short term, intraday, traderswww.fibbinarchie.com
Trading Manualmay use this as a base to initiate speculative longs with a tight stop beneath 103.60support, for a renewed assault on the medium term trendline resistance.Summarising the situation as seen in the above two charts: Extensions 61.8% and 100% have been met, with the 100% coinciding withthe medium term trendline resistance. Immediate trendline support is strengthened by presence of 38.2%retracement of the rise 103.00 to 103.99 coming in at 103.61 and horizontalsupport at 103.60 Immediate trend is up and this direction will be favoured by the intradaytraders for a fresh attempt through 103.90 zone with a potential targeting the161.8% extension at 104.79. Other traders may look to the hourly chart and decide to trade long on a breakof, or a break and pullback to, the medium term trendline resistance There will also be those traders taking the short side either at the medium termtrendline resistance or on a break through the immediate trendline support.Let’s now look at the possible entries that would have been used en route to the161.2% target of 104.79.a. Low risk entry for intraday trading with a stop the other side of the immediatetrendline support. Risk to the upside is the 103.87 extension could act asresistance and have still to breach medium term trendline resistance.b. As per a.www.fibbinarchie.com
Trading Manualc. Enter on breach of medium term trendline resistance. This would have seenboth intraday traders and positional traders enter the market as the break isvisible on both the shorter [eg 5 min] and longer [eg 60 min] timeframe charts.Stops would have been placed beneath points b, 103.70, and a, 103.60,depending on the timeframe of the chart used.d. Visible on intraday, shorter timeframe charts. Enter on pullback to mediumterm trendline resistance, now support, with immediate trendline and 103.87extension providing additional support. Upside risk is that high at 104.30 actsas resistance.e. As per d. with the addition of lower high at 103.20 providing potentialresistance.f. Visible on intraday, shorter timeframe charts. Enter on break of triangleresistance with a stop beneath e. and medium term trendline now acting assupport around 103.90g. Visible on both intraday and the longer timeframe charts. Enter on break ofprevious high at 103.40. Stop beneath previous swing low at e.Subsequently, the target level, 104.79, is breached with the high being 104.98. Fromhere there is a spate of short term profit taking which sees the price come back to theprevious high at 104.30, now acting as support at h.Notice that at h. and i. further buying interest entered the market. This would havebeen the short term “buy on dip” traders looking to capitalise on any further rise.They would have bailed out on the breach through point j. You can also see thatpoint j. did not give way immediately. It is on the immediate trendline support and isalso on the line made through h. and i., the short term triangle support. This mayhave enticed speculative buyers but they would have soon exited their positions.The breach through j. confirmed that the immediate trendline support had given wayThe market can be seen to be coming off the highs at this juncture. This is often thecase after a 161.8% extension has been achieved. It does not mean that the overallup trend is necessarily over, just that the market may need time to consolidate. Thiscan be seen more clearly on the hourly chart below:www.fibbinarchie.com
Trading ManualThe chart shows that: price action moved sideways between points 3 and 3a in a 115 pip range over103.83-104.98. the low of this sideways action was supported by 38.2% retracement, 103.79,of the rise from the lows. This is a normal, healthy retracement within a trend.We wouldn’t question the strength of a trend until approaching a 61.8%retracement or unless the peak (lows in the case of a down trend) of leg 0-1 isbeing threatened. the low of this sideways action is supported by the former medium termtrendline resistance now acting as support. The rally just before point 4 was aresult of traders seeing a confluence of support at 103.80 and either enteringlongs or exiting short positions thus causing a squeeze higher. additional support comes into effect at point 4 strengthen the existing support.The support at 103.80 is now considered sufficient enough, by the market, todefine the risk for going long. The rally from point 4 is rejected at 3a, the topof the range where it is quickly sold off. by point 4a there is a clear short term trend in place from point 2 through point4 and persuades more traders to enter the market at point 4a with a stopbeneath 103.80, or even tighter at a point just beneath the trendline at point4a. in the region of 104.20. This is the reason for the bounce off point 4a. the 161.8% extension of leg 4-3a supports the view that the overall target of106.29 is attainable.www.fibbinarchie.com
Technical Analysis – Fibonacci Levels Retracements A retracement is a pullback within the context of a trend. Dip After a rise from 0 to 1, short term market participants start to take profit. This drives the price lower until such a point that the bulls, sensing the price is better value, enterFile Size: 337KB