Transcription
Introduction to FibonacciAnalysisLearn how to use one of the most populartechnical analysis tools for optimal results.Risk Warning: CFDs are complex instruments and come with a high risk of losing money rapidlydue to leverage. 73% and 70% of retail investor accounts lose money when trading CFDs withTickmill UK Ltd and Tickmill Europe Ltd respectively. You should consider whether you understandhow CFDs work and whether you can afford to take the high risk of losing your money.This material is provided for informational purposes only and should not be considered asinvestment advice.www.tickmill.com
Introduction to Fibonacci AnalysisDemo AccountTable of ContentsIntroduction1. Fibonacci: TheMan, the Myth, theLegendPage 036. FibonacciRetracementsPage 0912. Trading the TrendUsing FibonacciPage 16Page 047. Using FibonacciRetracement ToolsPage 1013. Fibonacci andTrendline ConfluencePage 212. The Golden Ratio3. The FibonacciSequencePage 058.FibonacciRetracements in aDowntrendPage 069. FibonacciRetracements in anUptrendPage 1114. Fibonacci andMoving AveragesPage 1215. Final ThoughtsPage 22Page 234. The FibonacciSequence & RatiosPage 0710. A SimpleFibonacci TradingStrategyPage 135. The 50% LevelTheoryPage 0811. 50% Entry, 78.6%Stop & Exit at 0%Page 1416. EducationPage 24 2 www.tickmill.comCreate Account
Introduction to Fibonacci AnalysisDemo AccountIntroductionFor the less experienced trader, hearing the term Fibonacci retracement can be bothconfusing and intimidating, but don’t worry, it really isn’t as complex or confusing asyou may think. In this eBook we will deconstruct the concept of Fibonacci in a waythat it is easy to comprehend. We will explain in simple terms what Fibonacci isand how it is used in practical trading to frame market data and how you can useit to profit in the markets. 3 www.tickmill.comCreate Account
Introduction to Fibonacci AnalysisDemo AccountCreate Account1. Fibonacci: The Man, the Myth, the LegendBefore we get into the basics of how Fibonacci is used in trading, it is useful to briefly cover its history and background.Leonardo de Pisano was born in Italy circa 1170, his father Guglielmo Bonacci (the name Fibonacci, literally meanson of ‘Fi’ Bonacci) was a Pisan consul at a Mediterranean port called Bugia, now called Bejaia, in Algeria. Leonardostudied Mathematics in Bugia with an Arab teacher and travelled widely to Syria, Greece and Egypt where he acquiredhis extensive knowledge of numerical systems and calculus. 4 www.tickmill.com
Introduction to Fibonacci AnalysisDemo Account2. The Golden RatioFibonacci is credited with introducing the western world to the ‘GoldenRatio’ and the Fibonacci numerical sequence in his book ‘Liber Abaci’published in 1202. It is noteworthy that this sequence was known to Indianmathematicians as far back as the sixth century. The book popularisedHindu Arabic numerical sequences, making it one of the most influentialbooks on mathematics in the Middle Ages. 5 www.tickmill.comCreate Account
Introduction to Fibonacci AnalysisDemo AccountCreate Account3. The Fibonacci SequenceIn his book, Fibonacci explained a mysterious numerical series that has been referred to as the ‘Golden Ratio’ or nature’s secretcode, that has more recently gained notoriety in the 2006 blockbuster movie ‘The Da Vinci Code’. In the Fibonacci sequence ofnumbers after 0 and 1, each subsequent number is the sum of the prior numbers.The sequence works as 10,987So as you can see 1 1 2, 1 2 3, the number 55 in the sequence is the sum of 21 and 34. So now that we have a coreunderstanding of who Fibonacci is and what the Fibonacci sequence is, we should finally note that each number in the sequenceis approximately 1.618 times larger than the prior number. This ratio is going to be important as we proceed. It is a numberthat has significance in the natural world around us, it is commonly found in manmade architecture referred to as the ‘GoldenRectangle’. It is believed that the shapes it creates are naturally pleasing to the eye, creating a sense of harmony. It can also beseen in all aspects of nature from the structure and replication in flowers to fossils and even seashells. 6 www.tickmill.com
Introduction to Fibonacci AnalysisDemo AccountCreate Account4. The Fibonacci Sequence & Ratios89 divided by 144 gives a ratio of 0.618The final ratio in that series above is the most important ratio and forms the basis for‘The Golden Ratio’, however, there are other key ratios, for instance when you dividea number in the sequence with a number two places ahead of it, so you get:8 divided by 21 gives a ratio of 0.382Then divide the same number by the number three places ahead of it, so you get:8 divided by 34 gives a ratio of 0.236Therefore, we now have some core ratios derived from the Fibonacci sequence, namely23.6%, 38.2% and 61.8%. Traders use these ratios to determine retracement levels intrading; prices have a high probability of reacting at these levels. In the meantime, there area couple of other key ratios traders pay attention to, as you can see in the list below:At this point, it is key to understand how the ratio is calculated. The calculation is made by dividing a23.6%, 38.2%, 50%, 61.8% and 78.6%number in the sequence by the number that comes directly after it, so it looks something like this:5 divided by 8 gives a ratio of 0.62513 divided by 21 gives a ratio of 0.619 7 www.tickmill.com
Introduction to Fibonacci AnalysisDemo AccountCreate Account5. The 50% Level TheoryIt is noteworthy to mention that the 50% level does not have a specific Fibonaccisignificance, however, traders do pay attention to this level as it represents thehalf way back point for any retracement, over the years traders have noticed thatprices have a tendency to respond when prices retrace half of the prior swing.Now that we have a better understanding of what Fibonacci numbers are and howNZD / USD 1-hour frame.we derive retracement levels from extracting ratios from the Fibonacci sequence,let’s get down to business and define how we use these ratios in trading.Although Fibonacci analysis is a widely used method and much respected byexperienced technical analysts, it should not be deemed as the “magic wand”that is going to magically unlock the secrets of your price charts and allow you tomake a fortune in the markets overnight. Fibonacci analysis should be consideredas part of your trading tool kit that helps give you an edge in the markets whenyou use it appropriately. In the coming pages we will demonstrate how Fibonacciretracements can serve you well in highlighting high probability support andresistance levels, which can in turn be used to enter trades and also help to identifyprofit targets. 8 www.tickmill.com
Introduction to Fibonacci AnalysisDemo Account6. Fibonacci RetracementsIn the first section we learned about the most commonly used retracement levels (23.6%,38.2%, 50%, 61.8% & 78.6%) Now let’s look at how we practically draw these key levels onour charts.As you may know or as you will certainly learn, markets very rarely move in a straight line;more often than not, price moves in one direction and then pulls back either correctingagainst the trend or reversing to commence a new trend. Fibonacci retracements arehelpful in giving traders a clue as to where a retracement may terminate and where thedominant trend may resume. To draw our Fibonacci retracements on a chart we mustfirst identify a significant swing high and swing low, or vice versa. 9 www.tickmill.comCreate Account
Introduction to Fibonacci AnalysisDemo Account7. Using Fibonacci Retracement ToolsOn the chart below you can see that we have a swing high andswing low indicated by the blue arrows; once these are identified,you then choose the Fibonacci tool from your charting software.The Fibonacci tool comes as a standard offering on nearly allcommon charting packages, like MT4 and has the most commonretracement levels already set up as a default. The chart packageI am using is TradingView. 10 www.tickmill.comCreate Account
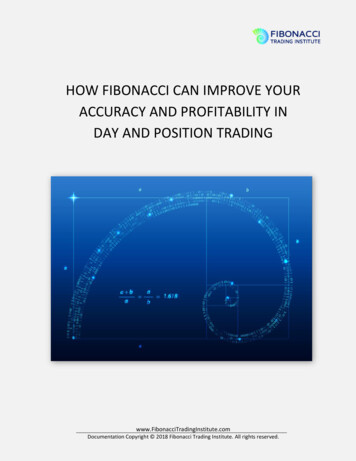
Introduction to Fibonacci AnalysisDemo AccountCreate Account8. Fibonacci Retracements in a DowntrendYou can apply the Fibonacci tool to the swing high and swinglow, be sure to apply it to the absolute low and high of the pricecandles to get a precise reading. As you can see from the chart,after making the swing low price retraces sharply to the 50/61.8%ideal retracement zone before resuming the dominant trend andtrading to new lows. 11 www.tickmill.com
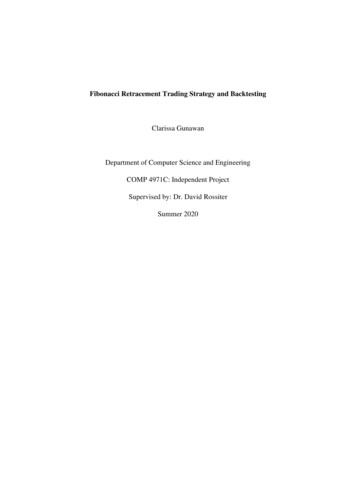
Introduction to Fibonacci AnalysisDemo Account9. Fibonacci Retracements in an UptrendNow let’s look at an example of a retracement in an uptrend. When weare analyzing a chart and define that the current trend is up as denotedby higher highs and higher lows, we want to identify the highest high andlowest low point to draw our Fibonacci retracement levels, as indicated onthe chart below:On this daily chart of the Australian dollar, the swing low and swing high arehighlighted again with the blue arrows. Price retraces from the swing high,eventually touching the 50% retracement before resuming the uptrend andultimately taking out the prior swing high. 12 www.tickmill.comCreate Account
Introduction to Fibonacci AnalysisDemo AccountCreate Account10. A Simple Fibonacci Trading StrategySo, we have learnt how and where to draw our Fibonacci retracement levels; now let’ssee how we can convert our analysis to a profitable trading strategy, with some simplerules. Obviously the most important aspect of using the Fibonacci retracement levels isidentifying the most high probability levels to pay attention to; as a general rule the levelsthat most technical analysts adhere to are the 50/61.8% levels, because they are so widelyfollowed, however, there is a degree to which other retracements levels become relevanttoo. For instance, the 23.6% level tends only to become significant in very extended movesand similarly, so does the 38.2% level. The 78.6% level has significance in so far as thatwhen price breaches this retracement level there is a high probability that the currenttrend retracement has failed, and we are likely in a new trend. 13 www.tickmill.com
Introduction to Fibonacci AnalysisDemo Account11. 50% Entry, 78.6% Stop & Exit at 0%So, from a trading perspective we are going to entertrades when price strikes a level, whereby we will enterone position at the 50% level and a second position ifprice strikes the 61.8% retracement with a stop belowthe 78.6% level, exiting our trades on a retest of theprior swing high or swing low.Let’s look at an example for a short trade:So, in this example, only our order at the 50% retracementlevel is triggered, price action consolidates beforeresuming the downtrend and moving to our profitobjective, allowing us to exit our position for a profit 14 www.tickmill.comCreate Account
Introduction to Fibonacci AnalysisDemo AccountNow let’s take a look at how the strategyworks for a long trade. 15 www.tickmill.comCreate Account
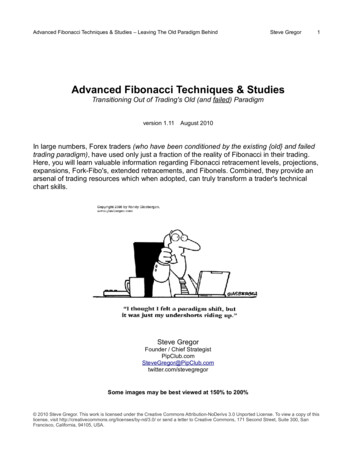
Introduction to Fibonacci AnalysisDemo AccountCreate Account12. Trading the Trend Using FibonacciIn this trade example only our order at the 50% retracement levelis triggered; the spike to test the 50% level is met by strong demandand price resumes the prior uptrend, reaching our profit objective andallowing us to exit our position for a profit of 831pips. The eagle eyedamongst you will notice that once price takes out the prior high, we getanother retracement. This retracement allows us to redraw our Fibonacciretracement levels, from the current swing low where we entered ourprior trade to the new swing high.As you can see in the chart, if we repeat our trading process enteringbuy orders firstly at the 50% level .9006 and the second buy order atthe 61.8% level .8890, placing our protective stop 1 pip below the 78.6%level at .8723. Once again, price retraces to the 50% level filling one ofour buy orders. Price resumes the uptrend and retests the prior swinghigh and we exit our position at the profit target of .9498, allowing us tocapture a 492 pip profit. Price proceeds to make a new swing high, andtherefore, we repeat our process, redrawing our Fibonacci retracementlevels from the prior swing low where we entered our last buy orders.We re-enter our buy orders at the 50% and 61.8% levels. The subsequentretracement fails to trigger either of our buy orders. 16 www.tickmill.com
Introduction to Fibonacci AnalysisDemo AccountCreate AccountPrices retrace to the 38.2% retracement level beforeextending to make new trend highs, as such we redrawour Fibonacci retracement levels, the swing low remainsanchored and we simply extend the Fibonacci tool tocapture the new swing high. 17 www.tickmill.com
Introduction to Fibonacci AnalysisDemo AccountOnce again, price duly retraces from the new swing highand comes within pips of triggering our 50% but does notactually strike our entry level before making another newtrend high, as such we redraw our Fibonacci retracementlevels from the new swing low to the new swing high andenter our buy orders at the 50% and 61.8% levels, withour protective stop placed 1 pip below the 78.6% level. 18 www.tickmill.comCreate Account
Introduction to Fibonacci AnalysisDemo AccountPrices retrace to fill our first buy order at the 50% levelbefore once again extending higher in the uptrend, totrigger our take profit orders at the prior swing highallowing us to capture another 162 pips of profit. Onceagain, the dominant trend resumes, and we make anotherswing high as such we redraw our Fibonacci retracementlevels from our prior entry point. 19 www.tickmill.comCreate Account
Introduction to Fibonacci AnalysisDemo AccountCreate AccountIn this instance, price pulls back to fill both our 50% and 61.8% buyorders and trades directly to our stop level at 95.51 resulting innet 169 pip loss. So let’s recap how we traded the uptrend, we hadsix trade set ups, of those six set ups four trades triggered threetrades resulted in profitable outcomes totaling 1485 pips in profits,one trade resulted in a net loss of 169 pips, leaving us with a totalprofit for the trend sequence of 1316 pips. You will also note thatas the trend expands, the Fibonacci retracements swing narrowfrom swing low to high, and this helps to protect the bulk of ourgains when trading a Fibonacci trend sequence.Now you have an overview of how to effectively use Fibonacciretracement analysis. Remember it is essential to use this tool aspart of you trading arsenal; it is not the trading ‘Holy Grail’ and isbest used as part of a broader tool kit, therefore, let’s look at howwe can combine Fibonacci retracement levels with some othercommon analysis tools, to provide additional confirmation andconfluence to our Fibonacci levels. 20 www.tickmill.com
Introduction to Fibonacci AnalysisDemo Account13. Fibonacci and Trendline ConfluenceAs you can see from the chart example above, price starts to developin a down trending channel. Using our Fibonacci retracement toolcombined with the trendlines provides a high probability set upto join the downtrend. As we see, the confluence in the trendlineintersecting our Fibonacci retracement giving entries at both the50% and 61.8% retracement levels, when you get these confluentset ups you may consider increasing your trade size to maximisegains, given the additional confirmation and higher conviction. 21 www.tickmill.comCreate Account
Introduction to Fibonacci AnalysisDemo AccountCreate Account14. Fibonacci and Moving AveragesAnother great way to look for trade set ups is to look for confluencewith Fibonacci retracement levels and moving averages. What arethese moving averages? They are most commonly 50, 100 and200 periods look backs. When a trend develops denoted by pricesconsistently above or below one of the moving averages and pricemoves back to retest the moving average, there is a chance it willfind support there. If you can connect this level with the Fibonacciretracement, you have a potential great entry point into the emergingor established trend as you see in the chart belowAs you can see, price breaks above the 50-period moving averagesuggesting the potential for a new phase of trend development, itthen pulls back to retest the 50-period moving average as supportfrom above. Once we see the swing low prior to crossing themoving average and then the subsequent swing high, we can drawour Fibonacci retracement levels in this instance the 50% levelcoincides with the moving average and price touches the 50% levelto the pip before taking off to the upside, in an extended up trend. 22 www.tickmill.com
Introduction to Fibonacci AnalysisDemo AccountCreate Account15. Final ThoughtsHopefully, you can now see the potency of combining the Fibonacci retracement levels with other common formsof technical analysis, to increase your conviction trading from Fibonacci levels. As with any technical analysis tool,convergence or confluence with other tools really increases the potential for profitable trade outcomes.The best way to take advantage of Fibonacci analysis is to take time to learn to identify price swings and correctly drawingyour Fibonacci retracement level, in time you will train your eye to see these swings instinctively and then remember toadd conviction to the best Fibonacci levels to trade, look for additional confluence, prior support and resistance, trendlines or moving averages all work really well, as the old adage goes ‘Practice makes Perfect!’ 23 www.tickmill.com
Introduction to Fibonacci AnalysisDemo AccountVisit Our BlogYour one-stop source for daily market insights!Did you enjoy reading this eBook? Why not visit our blog to explore moreinteresting insights into global markets and trading?6000 posts15 Experts7 languagesDaily technical &fundamental analysisACCESS NOW 24 www.tickmill.comCreate Account
Introduction to Fibonacci AnalysisDemo AccountEducationWebinarsSeminarsVideo TutorialsEbooksInfographicsForex GlossaryBlogFAQs 25 www.tickmill.comCreate Account
Introduction to Fibonacci AnalysisLive AccountDemo AccountKey FeaturesKey FeaturesEXCEL WITH EXCEPTIONAL TRADING CONDITIONSEXPERIENCE REAL MARKET CONDITIONSTake advantage of tight spreads from 0.0 pips and competitivecommissions.Practice trading in real time, test tools and strategies and sharpenyour trading skills in a completely risk-free environment.SUCCEED WITH THE ULTIMATE MT480 TRADING INSTRUMENTS ACROSS 4 ASSET CLASSESAdvanced Technical Tools, 50 Indicators and customisablecharting in 39 languages.Access a wide range of markets including Forex, Stock Indices,Commodities and Bonds and discover some of the lowestspreads in the market.ALL STRATEGIES ALLOWEDTrade the world’s financial markets by using virtually any tradingstrategy, including hedging and scalping.FULLY-EQUIPPED TRADING PLATFORMExplore the full suite of customisable tools and features that theMT4 platform provides to enhance your trading performance.Demo AccountCreate Account 26 www.tickmill.com
Forex. Stock Indices. Commodities. Bonds.Authorised and Regulated: FSA SC FCA UK CySECContact UsUnited KingdomCyprusSeychellesFore Street, London EC2Y 9DT,Kedron 9, Mesa Geitonia,3, F28-F29 Eden Plaza, Eden Island,United KingdomLimassol 4004, CyprusMahe, Seychelles 44 (0)20 3608 2100 357 25247650 248 434 rt@tickmill.comStay ConnectedHigh Risk Warning: Trading Contracts for Difference (CFDs) on margin carries a high level of risk and may not be suitable for all investors. Before decidingto trade Contracts for Difference (CFDs), you should carefully consider your trading objectives, level of experience and risk appetite. It is possible for youto sustain losses that exceed your invested capital and therefore you should not deposit money that you cannot afford to lose. Please ensure you fullyunderstand the risks and take appropriate care to manage your risk.Disclaimer: The content in this E-book comprises information and data that should not be construed as containing personal and/or other investment adviceand/or an offer of and/or solicitation for any transactions in financial instruments and/or a guarantee and/or prediction of future performance. Tickmill,its affiliates, agents, directors, officers or employees do not guarantee the accuracy, validity, timeliness or completeness of any information or data madeavailable and assume no liability as to any loss arising from any data or information contained herein.www.tickmill.com
Fibonacci Trading Strategy Introduction Page 03 1. Fibonacci: The Man, the Myth, the Legend 2. The Golden Ratio 3. The Fibonacci Sequence 4. The Fibonacci Sequence & Ratios 5. The 50% Level Theory Page 04 Page 05 Page 06 Page 07 Page 08 12. Trading the Trend Using Fibonacci Page 09 Page 16 7. Using Fibonacci