Transcription
http://www.scientificpapers.org
How to use Fibonacci retracement to predict forex marketVioleta Gaucan, Titu Maiorescu University, Bucharest, RomaniaAbstract: In the material below I have tried to explain how can be used FibonacciRetracement as an important tool to predict forex market. In this article I haveincluded some graphic formats such as Fibonacci arcs, fan, channel, expansion, wichare created also with Fibonacci retracement and also rules to perfect chart plotting. Ihave analyzed some examples of Fibonacci retracements pattern in a downtrend andin an uptrend. In this article I have used and combine material from different sourcestrying to create a start point for those one of you that are interested.Keywords: Fibonacci ratios, downtrend, uptrend, suport and resistance levels“Fib numbers” (as they are often referred to) also appear in many aspects of naturesuch as the arrangement of leaves on a stem and the branching of trees. Some daytraders, swing traders and investors therefore say that the nature of the financialmarkets also manifest themselves in the structure of Fibonacci numbers.Now the big question: Do Fibonacci numbers have a dramatic influence on thefinancial markets? Should you use Fibonacci trading in your trading system to helpwith your stock market analysis? Therefore Fib numbers are indeed significant intrading if for no other reason than they become a self-fulfilling prophecy through theiruse by a massive number of Fibonacci Forex, stock and futures traders. And thosenumbers can be used to calculate Fibonacci retracement levels. How? we will findtogether in the material below.History and mathematicsFibonacci(1175-1240) was one of the greatest mathematicians of the Middle Ages.He was born in Italy in Pisa town. In 1202 after a trip to Egypt, he come back in Italywhere it publishes a treatise on arithmetic and algebra named “Incipit Liber Abacci”(compositus a Leonardo filius Bonacci Pisano). In this treaty introduces for the firsttime Arabic numeral system in Europe, and the numbers we use today: 0,1, 2, 3, ,9.Leonardo da Pisa, is rightly considered the first great original mathematician ofEurope.In his many trips (Egypt, Syria, Greece, Sicily) he takes contact with Greek andArabic culture. The story of numbers appears in Italy in 1202, with the advent of thebook Liber Abaci, written by Leonardo Pisano, by then 27 years old. The book has 15sheets heads, and are written entirely by hand, the pattern appeared 300 years later.Fibonacci book begins with notions about the identification numbers of the units digitof tens, hundreds, of thousands, etc. In the last chapters we find calculations withinteger numbers and fractions, proportions rules, extraction of square roots and higherorder, then presents the solutions of linear and quadratic equations. Liber Abaci wasfilled with practical examples: calculation of financial accounting, corporate income,money exchange, conversion of weights, and the calculation of loan with interest.In terms of mathematic, Fibonacci numbers ƒn are given by the following recurrence:ƒ0 0, ƒ1 1, ƒn 1 ƒn-1 ƒn , n 1.Theorem 1. If χ2 χ 1, then we have: χn ƒnχ ƒn-1 , n 2.
Argument: We will prove by induction after n.For n 2 the relationship is trivial. We suppose that n 2 we have χn-1 ƒn-1χ ƒn-2. Then χn χn-1 · χ ƒn-1(χ 1) ƒn-2χ (ƒn-1 ƒn-2)χ ƒn-1 ƒnχ ƒn-1.Theorema 2. (Binet formula). The n-th term of the Fibonacci sequence is given by:nn1 1 5 1 5 , n 0.ƒn 5 2 2 1 51 5and 1 - φ 22nnFrom theorem 1., we have: φ φƒn ƒn-1 and (1 - φ ) (1 – φ)ƒn ƒn-1Forward φn – (1 – φ)n 5ƒn , from where result the Binet formula.Argument: Equation roots χ2 x 1 are φ Fibonacci sequence in forex marketFibonacci retracement is a very popular tool used by many technical traders to helpidentify strategic places for transactions to be placed, target prices or stop losses. Thenotion of retracement is used in many indicators such as Tirone levels, Gartleypatterns, Elliott Wave theory and more. After a significant price movement up ordown, the new support and resistance levels are often at or near these lines.The Fibonacci sequence is simply beginning with the numbers 0 and 1, and then eachnumber after that is the sum of the previous two.So 0 1 1Then you take the sum of the last 2 numbers of the above equation and add them:1 1 2Then you take the sum of the last 2 numbers of the above equation and add them:1 2 3Then you take the sum of the last 2 numbers of the above equation and add them:2 3 5Then you take the sum of the last 2 numbers of the above equation and add them:3 5 8Then you take the sum of the last 2 numbers of the above equation and add them:5 8 13Then you take the sum of the last 2 numbers of the above equation and add them:8 13 21 and on it goes to infiinity!The Fibonacci sequence of numbers is as follows: 0, 1, 1, 2, 3, 5, 8, 13, 21, 34, 55, 89,144, etc.Each term in this sequence is simply the sum of the two preceding terms and sequencecontinues infinitely. One of the remarkable characteristics of this numericalsequence is that each number is approximately 1.618 times greater than the precedingnumber. This common relationship between every number in the series is thefoundation of the common ratios used in retracement studies.Fibonacci ratiosFibonacci ratios are mathematical relationships, expressed as ratios, derived from theFibonacci sequences.The key Fibonacci ratios are 0%, 23.6%, 38.2%, 50%, 61.8% and 100%.
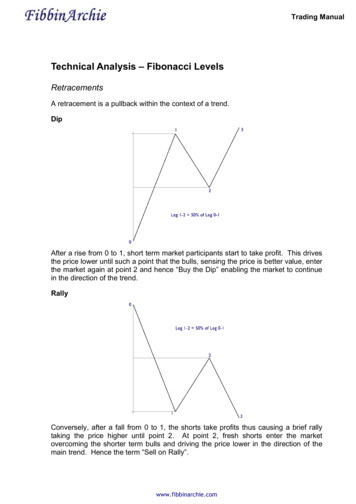
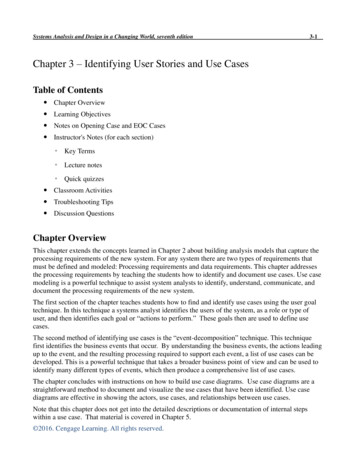
0F100% 1 5 2 1 The key Fibonacci ratio of 0.618% - also referred to as "the golden ratio" or "thegolden mean" - is found by dividing any number in the sequence by the number thatimmediately follows it. For example: 8/13 is approximately 0.6154, and 55/89 isapproximately 0.6180. 1 1 5 0,6180F61,8% 2 The 0.382 ratio is found by dividing any number in the sequence by the number that isfound two places to the right. For example: 34/89 is approximately 0.3820. 2 1 5 0,381966F38,2% 2 The 0.236 ratio is found by dividing any number in the sequence by the number that isthree places to the right. For example: 55/233 is approximately 0.2361. 1 5 F23,6% 2 The 0 ratio is : 3 0,236068 1 5 0F0% 2 The 0.500 ratio is derived from dividing the number 1 (third number in the sequence)by the number 2 (forth number in the sequence).1F50% 0,5000002The 50% retracement level is not really a Fibonacci ratio, but it is used because of theoverwhelming tendency for an asset to continue in a certain direction once itcompletes a 50% retracement.Fibonacci retracement is created by taking two extreme points on a chart and dividingthe vertical distance by the key Fibonacci ratios. 0.0% is considered to be the start ofthe retracement, while 100.0% is a complete reversal to the original part of the move.Once these levels are identified, horizontal lines are drawn and used to identifypossible support and resistance.Other ratiosThe 0.764 ratio is the result of subtracting 0.236 from the number 1. 1 5 F76,4% 1 2 The 0.786 ratio is: 1 5 F78,6% 2 12 3 0,763932 0,786151
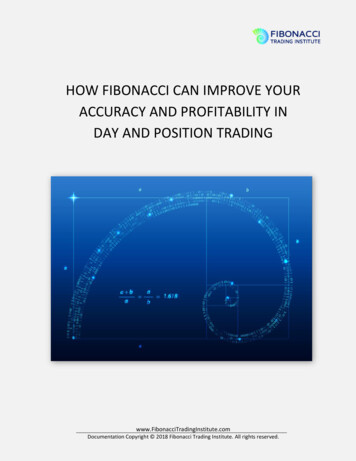
Fig. 1. Fibonacci ratios. Graphic representationFor reasons that are unclear, these ratios seem to play an important role in the stockmarket, just as they do in nature, and can be used to determine critical points thatcause an asset's price to reverse. The direction of the prior trend is likely to continueonce the price of the asset has retraced to one of the ratios listed above.The following chart illustrates how Fibonacci retracement can be used. Notice howthe price changes direction as it approaches the support/resistance levels.Fig. 2. Fibonacci retracement to the 23.6% level on the EURUSDFibonacci Retracements PatternStocks will often pull back or retrace a percentage of the previous move beforereversing. These Fibonacci retracements often occur at three levels – 38.2%, 50%, and61.8%.The use of Fibonacci retracement levels in online stock trading, stock market analysis(as well as futures, Forex, etc.) serves to help determine how far one expects a marketto retrace before continuing in the direction of the trend.
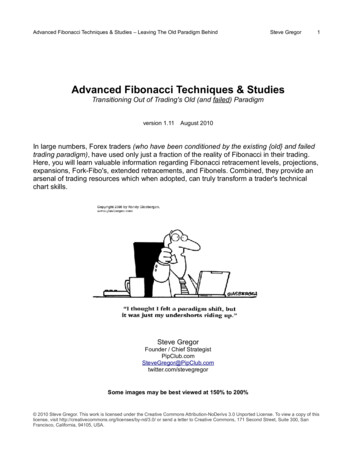
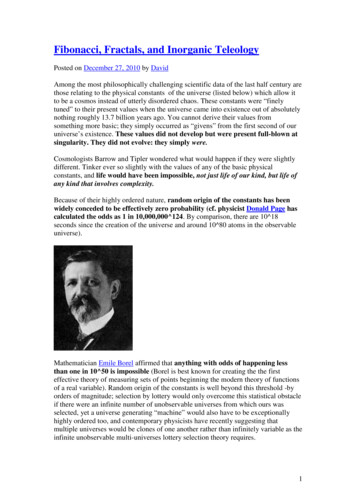
It is often used with other technical analysis indicators such as a moving average,stochastics, RSI, candlestick patterns, etc. When using Fibonacci Forex, stocks,futures and commodities can all be traded using the Fibonacci retracement of a trend.The first thing you should know about the Fibonacci tool is that it works best whenthe market is trending.The idea is to go long (or buy) on a retracement at a Fibonacci support level when themarket is trending up, and to go short (or sell) on a retracement at a Fibonacciresistance level when the market is trending down. In order to find these retracementlevels, you have to find the recent significant Swing Highs and Swings Lows.Then, for downtrends, click on the Swing High and drag the cursor to the most recentSwing Low. For uptrends, do the opposite. Click on the Swing Low and drag thecursor to the most recent Swing High.UptrendFig. 3. A daily chart of AUD/USDHere we plotted the Fibonacci retracement Levels by clicking on the Swing Low at.6955 on April 20 and dragging the cursor to the Swing High at .8264 on June 3.Tada! The software magically shows you the retracement levels.As you can see from the chart, the retracement levels were .7955 (23.6%), .7764(38.2%), 7609 (50.0%), .7454 (61.8%), and .7263 (76.4%).Now, the expectation is that if AUD/USD retraces from the recent high, it will findsupport at one of those Fibonacci levels because traders will be placing buy orders atthese levels as price pulls back.
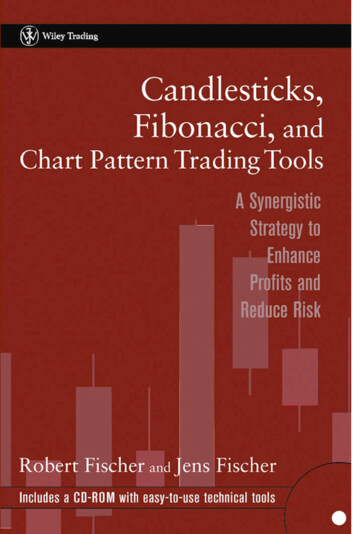
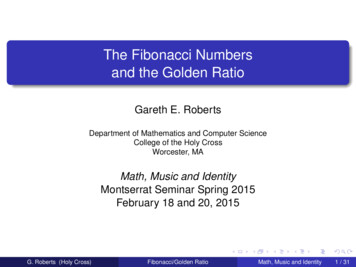
In theory Fibonacci retracement in an uptrend can also be represented as in the picturebelow:Fig. 4. Representation of an uptrend in theoryNow, let's look at what happened after the Swing High occurredFig. 5. A daily chart of AUD/USDPrice pulled back right through the 23.6% level and continued to shoot down over thenext couple of weeks. It even tested the 38.2% level but was unable to close below it.Later on, around July 14, the market resumed its upward move and eventually brokethrough the swing high. Clearly, buying at the 38.2% Fibonacci level would havebeen a profitable long term trade!DowntrendNow, let's see how we would use the Fibonacci retracement tool during a downtrend.Below is a 4-hour chart of EUR/USD.
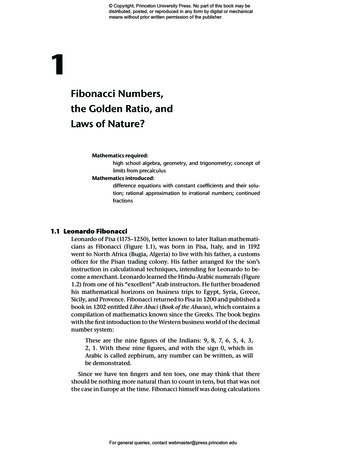
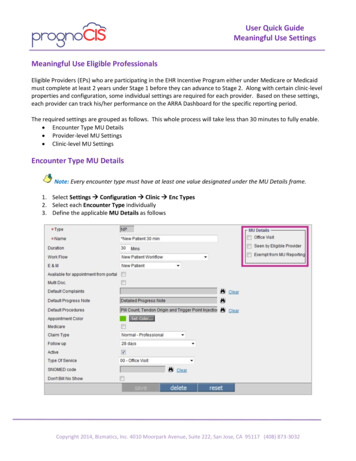
Fig. 6. A daily chart of EUR/USDAs you can see, we found our Swing High at 1.4195 on January 26 and our SwingLow at 1.3854 a few days later on February 2. The retracement levels are 1.3933(23.6%), 1.3983 (38.2%), 1.4023 (50.0%), 1.4064 (61.8%) and 1.4114 (76.4%).The expectation for a downtrend is that if price retraces from this low, it willencounter resistance at one of the Fibonacci levels because traders will be ready withsell orders there.In theory Fibonacci retracement in an downtrend can also be represented as in thepicture below:Fig. 7. Representation of an downtrend in theoryLet's take a look at what happened next.
Fig. 8. A daily chart of EUR/USDThe market did try to rally, stalled below the 38.2% level for a bit before testing the50.0% level. If you had some orders either at the 38.2% or 50.0% levels, youwould've made some mad pips on that trade.In these two examples, we see that price found some temporary support or resistanceat Fibonacci retracement levels.Fibonacci ArcsFibonacci Arcs are built as follows: first, the trend line is drawn between two extremepoints, for example, from the trough to the opposing peak. Then three arcs are builthaving their centers in the second extreme point and intersecting the trend line atFibonacci levels of 38.2, 50, and 61.8 per cent.Fig. 9. Fibonacci arcsFibonacci arcs are considered to be potential support and resistance levels. FibonacciArcs and Fibonacci Fans are usually plotted together on the chart, and support andresistance levels are determined by the points of intersection of these lines.It should be noted that the points of intersection of Arcs and the price curve canchange depending on the chart scale since an arc is a part of a circumference, and itsform is always the same.
Fibonacci FanFibonacci Fan as a line instrument is built as follows: a trend line — for example froma trough to the opposing peak is drawn between two extreme points. Then, an"invisible" vertical line is automatically drawn through the second extreme point.After that, three trend lines intersecting this invisible vertical line at Fibonacci levelsof 38.2, 50, and 61.8 percent are drawn from the first extreme point.These lines are considered to represent support and resistance levels. For getting amore precise forecast, it is recommended to use other Fibonacci instruments alongwith the Fan.Fig. 10. Fibonacci FanFibonacci Time ZonesIs a sequence of vertical lines having Fibonacci intervals of 1, 2, 3, 5, 8, 13, 21, 34,etc. Significant price changes are considered to be expected near these lines.To build this instrument, it is necessary to specify two points to determine the lengthof a unit interval. All other lines are built on base of this unit interval according toFibonacci Numbers.
Fig. 11. Fibonacci time zonesFibonacci ExpansionFibonacci Expansion is largely similar to Fibonacci Retracement and intended fordetermining of the end of the third wave. Unlike Fibonacci Retracement, thisinstrument is built not on the only one trend line, but on two waves.First, the line of the first wave is drawn, its height will be considered as a unit intervallater on. The end of the second wave serves as a reference point for building aninvisible vertical line. The corresponding lines are drawn from the reference point onthe interval equal to 61.8, 100%, and 161.8 per cent of the unit interval. The thirdwave is considered to finish near these levels.Fig. 12. Fibonacci expansionFibonacci ChannelFibonacci Channels are built using several parallel trend lines. To build
patterns, Elliott Wave theory and more. After a significant price movement up or down, the new support and resistance levels are often at or near these lines. The Fibonacci sequence is simply beginning with the numbers 0 and 1, and then each number after that is the sum of the previous two. So 0 1 1. Then you take the sum of the last 2 numbers of the above equation and add them: 1 1 .