Transcription
Available online at www.worldscientificnews.comWSN 57 (2016) 381-396EISSN 2392-2192Technical Analysis of Price Formations withFibonacci Sequence on Warsaw Stock ExchangeDawid LahuttaDepartment of Finance and Accounting, Faculty of Management, Lublin University of Technology38 Nadbystrzycka Str., 20-618 Lublin, PolandE-mail address: d.lahutta@pollub.plABSTRACTInvesting on the stock market is associated with taking risk. Contemporary investors use variousmethods that support their decisions. Apart from fundamental analysis, the technical analysis, in whicha variety of tools is used allows for a precise study of diagrams and trends and, therefore, enablingforecasting future changes in the prices of financial instruments, becomes more and more popular.With that, investors are able to adequately react and maximise their profits or minimise risks on thestock market. The purpose of this article is the presentation and description of technical analysis toolsbased on Fibonacci sequence with a particular emphasis on price patterns created using Fibonaccinumbers. In the first part of the article the author presents Fibonacci sequence and the golden ratio,then pointing out the possibilities of its use on financial markets. Moreover, the attempt of finding thetwo main types of price patterns in the actual realities of stock market is conducted, within markingsof polish index WIG20. The article ends with conclusions concerning the use of Fibonacci numbersand the golden ratio in the technical analysis, and the possibility of effective price pattern applicationin the actual investment.Keywords: Technical analysis, price patterns; price formations; Fibonacci sequence; Fibonaccinumbers; stock market; WIG20
World Scientific News 57 (2016) 381-3961. INTRODUCTIONInvesting on the stock market is associated with taking risk. Investors search for viablemethods to maintain the control of the risk and decide effectively about their investments(Barber and Terrance, 2011).There is a great number of tools helping the decision-making process of investors.Among them, there is the use of the Fibonacci number in the technical analysis. Someresearchers of the financial markets propose the replacement of Elliot’s approach with theresearch on Fibonacci number without paying attention to the order of the waves. It issupported by the elimination of an uncertainty factor replacing it with clearly defined andtestable rules (R. Fischer, 2015). Developing this concept may lead to the introduction ofdiscipline to the process of investment decision-making and to the automation of transactionas well.In the article a large emphasis is put on the analysis of Fibonacci sequence with theparticular consideration of Fibonacci numbers. Fibonacci sequence is not a mathematicalgame. It is rather a way to approach natural phenomena. Fibonacci numbers are used as ageometric tools to analyse the share prices movements.Fibonacci numbers can be primarily used as a prognostic tool based on the levels oftargeted correction waves. However, appropriate usage based on a variety of availablemethods, the Fibonacci analysis may be applied to create short-term investing strategies onthe stock market.The Fibonacci sequence, therefore, allows for the elaboration of methods of price-timeanalysis, allowing the determination of market peaks and troughs with an incredible precision.It is expressed through a number of price patterns created while using this sequence,supporting investment decisions on the capital market. In the article those formations havebeen described with the attempt of applying them in the actual investing process.Geometry based on Fibonacci numbers is characterised by the versatility of itsapplication. To check the effectiveness of using the Fibonacci sequence on the financialmarkets, the author attempts to find some price patterns received by using Fibonacci numbers,within marking of polish index WIG20.2. THE FIBONACCI NUMBER AND THE GOLDEN RATIOThe Fibonacci sequence was found in XIII century by the Italian mathematicianLeonardo of Pisa, known as Fibonacci (1170-1240) (Posamentier and Lehmann, 2007). It isthe sequence of natural numbers defined recursively, which is described in two ways, withand without the 0 as a first digit in the sequence. The first digit equals 0, the second oneequals 1, and each next digit is the sum of the previous two. Therefore formally, the notationof Fibonacci sequence with the 0 as a first digit looks as follows (Beck and Geoghegan,2010):{-382-
World Scientific News 57 (2016) 381-396The next digits of the sequence are called Fibonacci numbers. As stated before,including the 0 to the elements of the sequence is agreed on – some authors define two firstdigits of the sequence as:. In this article, the 0 as a first digit version is used.Using the formal notation one can create an infinite sequence of numbers, where thefirst twenty digits are presented in the Table 1.Table 1. The first twenty digits of Fibonacci sequence.011235813 21 34 5589144 233 377 610 987 1597 2584 4181The issue associated with Fibonacci sequence is the golden ratio, also known as thegolden division or the harmonic division (Shneider, 2014). The golden ratio is the division ofthe section into two parts so as to the length ratio of the longer one to the shorter one was thesame as the whole section to the longer part. In other words the length of the longer part of thesection has to be the geometric average of the whole section and its shorter part. The algebraicway in which it can be expressed is as follows:The ratio, mentioned before, is called the golden number and is described as the twentyfirst letter of the Greek alphabet - . It is possible to determine the value of the goldennumber as: Therefore, the golden ratio is often given in elaborations as 1.618. Other importantvalues used in the golden ratio are approximations of appropriate limits of the sequence,which are shown in Table 2 (Nowakowski and Borowski, 2005).Table 2. Other important values used in the golden ratio.FormulaLimitValue (approximately)0.6180.3822.618-383-
World Scientific News 57 (2016) 381-3963. FIBONACCI NUMBERS ON STOCK MARKETSThe usage of Fibonacci sequence on stock market is connected to coefficients, that areused to determine appropriate formations associated with the golden ratio. Table 3 lists valuesof the most important Fibonacci numbers used in the technical analysis (Nowakowski andBorowski, 2005).Table 3. Fibonacci numbers used in the technical analysis.ExponentFibonacci Coefficient (rounded to the third decimal place)-30.236 (23.6%)-20.382 (38.2%)-1.440.5 (50%)-10.618 (61.8%)-0.50.786 (78.6%)11.618 (161.8%)22.618 (261.8%)34.236 (423.6%)In table 3 There is an exponent that equals -1.44, which produces Fibonacci coefficientequal 0.5. It is due to the practical and traditional standpoint, allowing for the appropriatelevel of visualisation of given results.So far, there are three main ways the Fibonacci sequence is used to analyse thefinancial markets (Nowakowski and Borowski, 2005):1.2.3.Time methods (passage of time)Price methods (price changes)Time-price methods (passage of time and price changes)Depending of the chosen method, the lines that create Fibonacci objects will have adifferent structure. Fibonacci objects include levels, zones, range, arc and radius. However,the most often used tools of the technical analysis based on the Fibonacci sequence includeretracement, fan and projection (Gaucan, 2011).In the next part of this article the most popular Fibonacci objects are shown andcharacterised, which investors can easily use in planning their investments.-384-
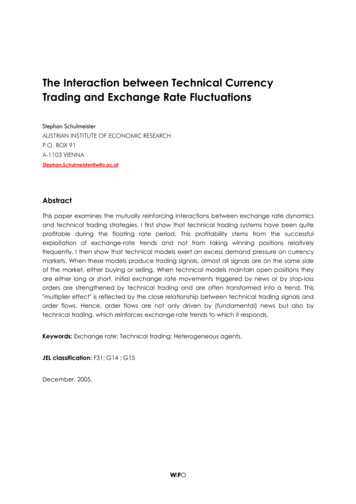
World Scientific News 57 (2016) 381-396Figure 1. Fibonacci Retracements.Figure 2. Fibonacci Fans.-385-
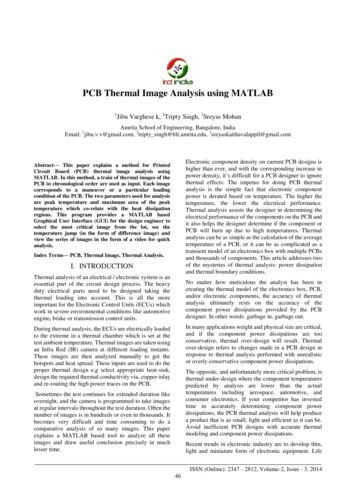
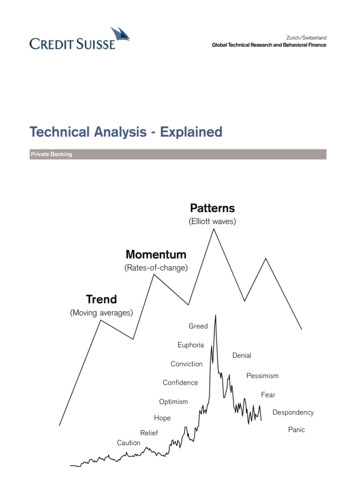
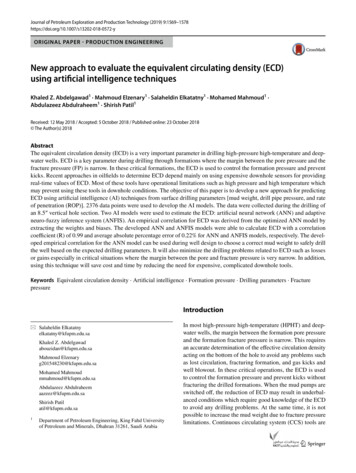
World Scientific News 57 (2016) 381-396The Figure 1 shows the example of Fibonacci retracements on S&P500 market’shistorical data. The percent rate correction on the chart of the price of the financial instrumentis called the Fibonacci retracement, which can be external or internal. Internal retracementsare corrections of previous trend on the financial instrument of the price chart for less than100%, whereas external retracements are the analogical corrections, but beyond 100%.The main problem in using the Fibonacci retracements is that at the very beginning ofthe correction the investor cannot predict its range – for example either 38.2% or 61.8%.Nevertheless, it is possible to get the specific levels of support/resistance, which is worthtaking into consideration when making a decision (Fischer and Fischer, 2003).Figure 2 shows the usage of Fibonacci range on the same market, as the Figure 1. TheFibonacci range consist of three lines corresponding to the certain levels of retracement:0.382; 0.500 and 0.618 (Gaucan, 2011).The Fibonacci fan sets the levels of support and resistance for the price and shows howthey expand (move) overtime. Investing with the usage of the Fibonacci fan, the investor mayexpect that the prices will move between the lines. If the price stays on the line of the fan, theoccurrence of support is confirmed. But, if it becomes broken, it is a signal, that the price isready to move to the next line of the fan. Similarly to the other way around – if the price isunder the line of the fan, the resistance occurs. After leaving the fan – the last broken linestarts to mark the support/resistance of the new trend (Gaucan, 2011).Figure 3, on the other hand, shows the Fibonacci projection, which is using theFibonacci numbers to allow the prediction of potential levels of resistance in the upward trendand supports in the downward trend and the range of movement.Figure 3. Fibonacci Projection.-386-
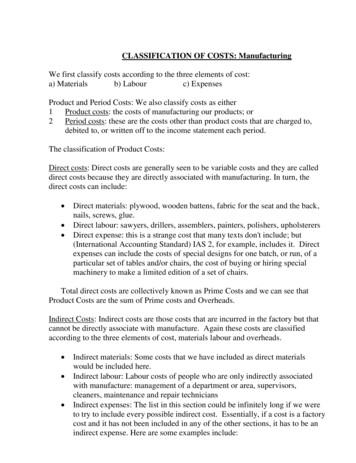
World Scientific News 57 (2016) 381-396In the Figure 3, the blue line shows the increasing wave and its correction, which setthe base to calculate the potential range of increase. The interesting fact is that in the nextstep, the next phase of increases (after the level of correction) reached the level of 100%. Ifthat level would be exceeded, then another Fibonacci retracement (161.8%) should be addedand the investor should expect the continuation of increases corresponding to this addedretracement.4. PRICE FORMATIONS BASED ON FIBONACCI SEQUENCEThe Fibonacci sequence and its numbers have a lot of capabilities and bring many toolsto the technical analysis of the financial market. Apart from methods, which were alreadymentioned in the previous part of the article, the Fibonacci numbers allow for the analysis ofprice formations, known as harmonic formations. They help to precisely predict the pricemovement and turning points, often appearing on the market.To calculate the formations, methods based on the Fibonacci numbers and geometryshould be used. With them, the range and the price movement of a specific financialinstrument and its range of turning points, can be easily measured. There are different types ofthese structures on the market. The particular characteristic of these formation are the exactlydefined proportions, which are expressed by the Fibonacci numbers.The simplest are the three-wave ABCD formations, in the Elliott wave principle knownas the ABC Correction. The more complex formation XABCD, consists of 4 waves connectedto each other with strictly defined coefficients. Certain patterns can be distinguished with thisapproach, namely: the Gartley’s, the Bat, the Butterfly and the Crab. Some investors claimthat these formations are more efficient than the classical ones, because there is less freedomin interpretation of the information resulting from the chart. Harmonic formations usemathematic differences between the price and time, therefore, they belong to the price-timemethod and in turn, they are equally efficient on every market and interval. Including theharmonic formation to the investor’s workshop highly expands the investing possibilities.Investors aim to look for the opportunity to finalise the transactions, which have a lot ofprobability to be successful. Therefore, specific price layouts, which fulfil the conditions ofthe minimal exposure of the capital (the level of the investment risk) and also the high level ofpotential risk need to be found out.The popularity and a high formation investment effectiveness based on Fibonaccinumbers is due to the fact that the method, unlike other, is able to fulfil these conditions. It isworth mentioning that the harmonic setups appear in every time scale – minute-, hour-, daily-,up to monthly-wise.4. 1. AB CDAB CD formation is the simplest price formation based on the Fibonacci numbers. Forthe first time it was described by H.M. Gartley in 1935.The feature of this formation is its place in the definition of the measured movement.AB CD formation is either downward- (Bearish) or upward-oriented (Bullish), which ispresented in the Figure 4.-387-
World Scientific News 57 (2016) 381-396Figure 4. AB/CD Pattern.The scheme of movement in this formation consists of moving from A to B, then after ashort correction from B to C the formation ends with the next move – from C to D. The pricerange of CD is the same as in AB. The equality of the AB and CD (AB CD) section gives thename of the formation. Point C (the turning point) has to be put in such a place so as to BCcould be described by the product AB and numbers 0.618 or 0.786. In turn, CD should end onthe retracement 1.618 or 1.272 of the BC section. The range of CD is, however, the product ofBC range and numbers 1.618 (with product 0.618 and AB) or 1.272 (with product 0.786 andAB).The expected change of trend occurs in the D point. The investor at this point isinterested in buying or selling, depending on the position. If it is accompanied by theoccurrence of the candlestick formation meaning the reversal of the trend confirmed by therotation or the analysis of time, it is clear for the investor to define the turning point with theminimal level of risk and finalise the transaction (Nison, 1991). Sometimes, the share pricewill not be precisely showing the relation AB CD, it most likely will be approximate to 1-2points. What may happen is, the pattern will be exact, the lean will be similar as well as theduration of the specific price movements (The Trader’s Journal, 2006).Therefore, the general properties of AB CD formation can be described as follows: or Even though this structure is ideal and is rather often seen, in practice formations suchas ABCD will meet other assumptions. The perfect symmetry indicating the equality betweenAB and CD will occur in approximately 40% of cases. In the remaining 60%, there will beother variations of this pattern (Pesavento, 1997).-388-
World Scientific News 57 (2016) 381-396Figure 5. Bullish AB CD on WIG20It is worth remembering, that price patterns are based on probability. There is nocertainty that they will appear every time. It is not possible to look for these relations,therefore, the investors should properly maintain the capital, investments and the knowledgeabout the price patterns use as a support in decision-making process. It is important to finalisethe transaction at a given market point, whether it will be the transaction that closes thecurrent position or the one that opens the opposite position to the current setup, the investorshould look for thhe confirmation from a few different price relation, like external andinternal retracements, projection analysis and expansion in different scales of time.As it is seen in the Figure 5, the AB CD formation can also be used when it comes tothe polish indexes like WIG20. In this case, the downward trend appeared in 02.05.2016 andaccording to AB CD formation the price of the index was decreasing up to 01.06.2016, thenafter a small increasing correction in 08.06.2016 it began to decrease again. After this day, thereversal trend in 06.07.2016 is visible. Interestingly, the proportion does not completelyaccord to the Fibonacci number. The retracement equals 10%, so it is not high, but thechanges on the market confirm the functioning of this formation.-389-
World Scientific News 57 (2016) 381-3964. 2. Gartley PatternThe ideal Gartley’s pattern is based on the use of the number φ to predict the priceformation. Its name comes from H.M. Gartley (Gartley, 1935; Teseo, 2001), who was the firstone to use it and what is interesting, he did not describe it with any values. According toGartley’s suggestion the downward, correction ended in point B should equal 61.8% of therange of XA.After the change of the downward trend to the upward one in B, the price of the assetincreases to point C. The ideal Gartley’s pattern is visible, when the range of movementbetween B and C will be put in the interval between 61.8% and 78.6% of the range ofmovement AB. After changing the tendency in point C, the decrease of the price of the assetmay be observed up until the D point. The range of CD movement should belong to theinterval from 127% to 161.8% of BC movement. In the D point, the investors get the signal totake the long position. The minimal range of increase DT is 61.8% of the CD range. Thecomplete range of movement for AD is 78.6% of XA and has a key meaning in recognition ofthe Gartley’s ideal pattern. If in point T, the trend line defined by A and C breaks, then theformation of changing the higher degree trend appears (Hartle, 2000). The example of theideal Gartley’s pattern in the upward trend is presented in the Figure 6.Figure 6. Ideal Bullish Gartley.The modified Gartley’s pattern is used in technical analysis in investing practice. Thisversion can be seen on Figure 7. The general properties of modified form of Gartley’sformation are as follows: -390-
World Scientific News 57 (2016) 381-396Figure 7. Modified Gartley.In case of Gartley’s formation the investor should take notice for a few characteristicfeatures. First of all, in investing practice, BC/AB in most cases is in the interval between0.382 and 0.886 instead of 0.618 and 0.786. Moreover, the external BC retracement cannotexceed 1.618. Then, there are conditions preventing this formation: The peak of point D cannot exceed point X,The BC wave cannot exceed point A (it can, though, be double peaked or troughedfrom point A),The AB wave cannot exceed point X.The Gartley’s pattern can be divided into few segments in the range of the chartindications. Point X is the highest and the lowest point in the structure and is the starting pointof the formation. This point can be found on the higher scale trend or on the main peaks andtroughs. It can be the peak or the trough of the higher degree trend. Point X then, will be theprice, which will be observed by every investor using the chart analysis. When point X formsand the XA wave begins, on this stage it is impossible to highlight its end. Some clues to thelength of the movement might be arcs or bars with the high range of variation and closings inthe upper range of daily range of prices in the direction of the trend. In this case, thismovement may take a while to get to the point of correction.When XA movement stops, the next step is the observation of the AB wave that isforming. It is the first reaction to the initial wave from point X. The key numbers, that can beobserved here are Fibonacci retracements to which the market amends and the amount of barsin the chart, which form the wave data and the lean.The attempt of finding the Gartley’s formation within the index prices in WIG20 isshown in the Figure 8.-391-
World Scientific News 57 (2016) 381-396Figure 8. Bullish Gartley on WIG20.Figure 8 shows Bullish Gartley Pattern, which is seen on the Figure of the WIG20index. The interesting fact is that, the moment in which AB CD formation ends (Figure 5) isthe starting point for Bullish Gartley Pattern (06.07.2016). This whole formation is between06.07.2016 and 14.09.2016. According to predictions, in continued downward trend thatbegan in point C (08.09.2016) the reversal appears in point D and then the upward trend isvisible, even though the correction comes quickly. In the described formation, BC/AB is0.591, fitting in the agreed range in the investing practice.What this formation offers to investors is the entry to the market with a specific levelof retracements with low or specific level of risk. Statistically this formation works in 70% ofcases. The ideal Garley’s pattern has variations, which are identified as the Bat, the Crab andthe Butterfly patterns, which will be briefly characterized in the next part of the article.4. 3. Bat, Crab and Butterfly as variations of GartleyThe Bat formation was first published in 2001 by Scott Carney. This formation,similarly to Gartley’s, is an internal structure, therefore the AD range does not exceed the XAwave, but ends of the 0.786 or 0.886 retracement. AB range, in this case, has to be lower than61.8% of XA wave. Usually, AB wave can be described through the retracement in the 38.2%-392-
World Scientific News 57 (2016) 381-396to 50% interval of XA wave. The range of AD movement equals 88.6% of the range of XAmovement. The range of CD wave varies between 161.8% to 268.1% of the range of BCwave. Equality in length between AB and CD are rarely seen. The Bat formation is presentedin the Figure 9.Figure 9. Bat Pattern.The features of the Bat formation: AB correction should be at 38.2%, 44.7%, 48.6% or 50% of the previous XAmovement,BC wave should be at 38.2%, 44.7%, 50%, 61.8%, 78.6% or 88.6% of the length ofAB wave,CD wave should be at 161.8%, 190.2%, 200%, 205.8%, 223.6%, 261.8% of theprevious BC movement and should stop on the 88.6% retracement of XA wave.The next Gartley’s formation is the Crab. The Crab formation was first presented in2000 by Scott Carney. It is one of the most precise pattern out of all harmonic formations.The critical aspect of this formation is the potential point of reverse in point D created on the1.618 retracement of XA wave and on the external retracement of BC wave resulting from theusage of certain coefficients: 2.236, 2.617, 3.14, 3.618. Point B is set in such place, that theAB wave overwrites the XA wave in the interval from 38.2% to 61.8%. This formation ispresented in the Figure 10.The features of the Crab formation: AB correction should be at 38.2%, 44.7%, 48.6%, 50% or 61,8% of the previous XAmovement,BC wave should be at 38.2%, 44.7%, 48.6%, 50%, 61.8%, 78,6% or 88.6% of thelength to the AB wave,-393-
World Scientific News 57 (2016) 381-396 CD wave should be at 223.6%, 261.8%, 314%, 361.8% of the previous BC movementand should stop on the 161.8% retracement of XA wave.The last variation of Gartley’s is the Butterfly pattern. This formation was discoveredby Bryce Gilmore and Larry Pesavento (Teseo, 2001) and is another form of Gartley’sformations. The difference is that the three-wave movement is longer than the initialmeasurement section. The condition that has to be fulfilled to create the ideal Butterflyformation is to create the turning point B in such place, that the AB range was equal to theproduct of XA range and the number 0.786. In Scott Carney’s modified version the AB/XArelation occurs in the 0.5-0.786 interval. This formation is presented in the Figure 11.Figure 10. Crab Pattern.Figure 11. Butterfly Pattern.-394-
World Scientific News 57 (2016) 381-3965. CONCLUSIONSThe Fibonacci sequence and numbers based on it create a lot of applicationopportunities in different branches of life. Financial markets are no different, because thesequence and numbers are able to be used in the technical analysis. Tools based on theFibonacci numbers work and are reflected in the actual investment reality. Popularisation ofthe technical analysis and the Fibonacci sequence allows investors to use the arc of toolssupporting their decision-making process.Price patterns, which were analysed in this article can be effectively used on thefinancial markets. These tools allow for the correct observations of trends, which steer thechanges of financial instrument charts. Thanks to that, the price patterns may be used toforecast future financial instrument price changes.Price formations based on the Fibonacci sequence have a wide range of application andcan be successfully used on polish stock market. In this article two formation were observedin polish investing reality (AB CD and Gartley’s), over few months on WIG20 indexmarkings. It means, that the price patterns can be used not only for the technical analysis ofshare prices, but to whole indexes, which in turn proves their versatility.The important fact is that these price patterns observed on WIG20 occurred one afteranother, meaning, that the chart analysis should be looked in a complex way analysingchanges that appear on markings. It confirms the fact that the technical analysis should not beused as the only form of supporting the investment decision-making process. It is incrediblyimportant addition to the fundamental or behavioural analysis and using all tools properly willallow for the appropriate maintaining of finances.It is worth remembering that the technical analysis based on the Fibonacci numbers isconnected only to a certain level of probability in specific events to occur. However, thisbranch is extremely interesting and is worth exploring further because the given results cannot only surprise but bring more tools, that will allow for even more precise measurements intechnical analysis.References[1]Barber B and Terrance O (2011). The Behaviour of Individual Investors, SSRN,retrieved from: http://papers.ssrn.com/sol3/papers.cfm?abstract id 1872211.[2]Beck M and Geoghegan R (2010). The Art of Proof: Basic Training for DeeperMathematics, Springer, New York, NY.[3]Fischer R (2015). Fibonacci Applications and Strategies for Traders, John Wiley &Sons, Inc., New York, NY.[4]Fischer R and Fischer J (2003). Candlesticks, Fibonacci, and Chart Pattern TradingTools. A Synergistic Strategy to Enhance Profits and Reduce Risk, John Wiley & Sons,Inc., Hoboken, New Jersey.[5]Gartley H (1935). Profits in The Stock Market, Traders’ Press, New York, NY[6]Gaucan V (2011). How to use Fibonacci retracement to predict forex market, Journal ofKnowledge Management, Economics and Information Technology, Economics, Issue-395-
World Scientific News 57 (2016) 381-396No. 2, Knowledge Management, retrieved from: 34 How to use Fibonacci retracement to predict forex market.pdf[7]Hartle T., Triangles and Trends, Technical Analysis of Stock & Commodities, February2000, Vol. 18, No. 2, p. 24-30.[8]Nison S. (1991). Japanese candlestick charting techniques: a contemporary guide to theancient investment technique of the Far East, Paramount Communications Companty,New York, NY.[9]Nowakowski J and Borowski K. (2005). Zastosowanie Teorii Carolana i Fishera narynku kapitałowym, Wydawnictwo Difin, Warszawa.[10] Pesavento L. (1997). Fibonacci Rations with Pattern Recognition, Traders Press, Inc.,Greenville, SC.[11] Posamentier A.S. and Lehmann I. (2007). The (Fabulous) Fibonacci Numbers,Prometheus Books, New York 14228-2119, NY.[12] Schneider RP., A Golden Product Identity for e, Mathematics Magazine, Vol. 87, No. 2(2014) 132-134.[13] Teseo R., The Butterfly Setup, Technical Analysis of Stock & Commodities, January2001, Vol. 19, No. 4, p. 52-56.[14] Teseo R., The Gartley Setup, Technical Analysis of Stock & Commodities, January2001, Vol. 19, No. 1, p. 40-47.[15] The Trader’s Journal, September 2006, vol. 2, p. 19.( Received 26 September 2016; accepted 10 October 2016 )-396-
Fibonacci objects include levels, zones, range, arc and radius. However, the most often used tools of the technical analysis based on the Fibonacci sequence include retracement, fan and projection (Gaucan, 2011). In the next part of this article the most popular Fibonacci objects are shown