Transcription
Introduction to Experiment DesignKauko LeiviskäUniversity of OuluControl Engineering Laboratory2013
Table of Contents1. Introduction1.1 Industrial experiments1.2 Matrix designs2. Basic definitions3. On statistical testing4. Two‐level Hadamard designs5. Response surface methods5.1 Introduction5.2 Central composite design5.3 Box‐Behnken design5.4 D‐optimal designs6. Some experiment design programsThe main source: W.J. Diamond. Practical Experiment Design for Engineers and Scientists.Lifetime Learning Publications, 1981.http://www.itl.nist.gov/div898/handbook/
1. Introduction1.1 Industrial ExperimentsIndustrial experiments are in principle comparative tests; they mean a comparison betweentwo or more alternatives. One may want to compare the yield of a certain process to a newone, prove the effect of the process change compared to an existing situation or the effectof new raw materials or catalyser to the product quality or to compare the performance ofan automated process with manually controlled one.When we speak about systematic experimental design, we presume statisticalinterpretation of the results so that we can say that a certain alternative outperforms theother one with e.g. 95% probability or, correspondingly, that there is a 5% risk that ourdecision is erroneous. What is the best is that we can tell the statistical significance of theresults before testing, or, just to put in another way round, we can define our testprocedure so that it produces results with a required significance.We can also experiment with some process aiming to optimize its performance. Then wehave to know in advance what the available operation area is and design our experiments sothat we by using them together with some mathematical software can search for theoptimum operating point. The famous Taguchi method is a straightforward approach tooptimize quality mainly by searching process conditions that produce the smallest qualityvariations. By the way, this is also the approach that control engineers most often use whenspeaking about stabilizing controls. Also in this case, the focus is in optimizing operationalconditions using systematic experimental design.There is also a large group of experiment design methods that are useful in optimizingnonlinear systems, namely response surface methods that we will be dealing with later on.1.2 Matrix DesignsThe conventional experiment design proceeds usually so that changes are made onevariable at time; i.e. first the first variable is changes and its effect is measure and the sametakes place for the second variable and so on. This is an inefficient and time‐consumingapproach. It cannot also find the probable interactions between the variables. Resultanalysis is straightforward, but care must be taken in interpreting the results and multi‐variable modelling is impossible.Systematic design is usually based on so called matrix designs that change several variablessimultaneously according to the program decided beforehand. Changing is donesystematically and the design includes either all possible combinations of the variables or atthe least the most important ones.
E.g. in experimenting with three variables at two possible levels, there are eight possiblecombinations (23). If all combinations are included we can speak about 2‐level, 3 variablecase which requires 8 experiments. As mentioned before, statistical interpretation is neededand because of the exponential increase dimensional explosion is expected with morevariables and levels.Example. We want to test the effect of different factors on the yield in a chemical reactor:temperature (A), reaction time (B) and raw material vendor (C). We assume that testing attwo levels of each variable is enough. This means that the process is assumed linear withrespect to continuous variables. The levels are chosen asFactor A:Factor B:Factor C:(‐)‐level is 100 C(‐)‐level is 5 min.(‐)‐level is vendor X( )‐level is 150 C( )‐level is 10 min.( )‐level is vendor YUsing these denotations, the design matrix can be written asRun numberABC12345678‐ ‐ ‐ ‐ ‐‐ ‐‐ ‐‐‐‐ So in the first experiment, the temperature is held at 100 C, reaction time at 5 minutes andthe raw material from vendor X is used, and so on. Note that this experiment design allowsusing both continuous and non‐continuous variables in the same design matrix.
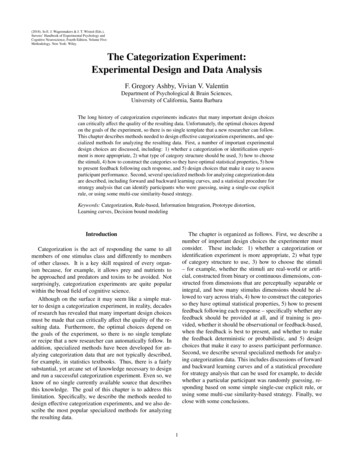
2. Basic DefinitionsLinearity and interactionsExample. We continue testing the yield of the chemical reaction, but this time with twovariables, only: the temperature and reaction time. Figure 1 below shows four possiblecases; both linear and non‐linear cases with and without interaction. The panels on the lkeftshow linear and non‐linear cases without interaction and, respectively, the panels on therifgh‐hand side picture cases with interaction.Linear, with interaction100100909080time 570time 10YieldYieldLinear, no interaction6080time 570time 106050509014019090TemperatureNonlinear, no interaction190Nonlinear, with interaction1001009080time 570time 1060Yield90Yield140Temperature80time 570time re 1.1. Graphs illustrating concepts of linearity and interaction.Some conclusions can be drawn from the graphs:‐in non‐interacting cases, the curves follow each other; i.e. the effect of the reaction timedoes not depend on the temperature‐in interactive case, the effect of the reaction time is stronger with higher temperature‐ two‐level designs can reveal only the linear behaviourEffectExperimental designs test, if a variable influences another. This influence is called “effect”.There are two different effects: the variable effects on another directly or via an interaction(or uses both mechanisms simultaneously). The calculation of the strength of an effect is
commented later. The significance of an effect is determined statistically with someprobability (usually 95%) or risk (usually 5%).Full factorial designsThese designs include all possible combinations of all factors (variables) at all levels. Therecan be two or more levels, but the number of levels has an influence on the number ofexperiments needed. For two factors at p levels, 2p experiments are needed for a fullfactorial design.Fractional factorial designs are designs that include the most important combinations of thevariables. The significance of effects found by using these designs is expressed usingstatistical methods. Most designs that will be shown later are fractional factorial designs.This is necessary in order to avoid exponential explosion. Quite often, the experiment designproblem is defined as finding the minimum number of experiments for the purpose.Orthogonal designsFull factorial designs are always orthogonal, from Hadamard matrices at 1800’s to Taguchidesigns later. Orthogonality can be tested easily with the following procedure:In the matrix below, replace and – by 1 and ‐1. Multiply columns pairwise (e.g. column Aby column B, etc.). For the design to be orthogonal, the sum of the four products must bezero for all pairs.Run numberABC1234 ‐‐ ‐ ‐‐ ‐Run 10Condition numberCondition number is a measure of sphericity – orthogonality – of the design. It has emergedtogether with computerized experimental design methods. If we describe the design as amatrix X consisting of ‐1’s and 1’s, the condition number is the ratio between the largest
and smallest eigenvalue of X’X matrix. All factorial designs without centre points (the midpoint between the and – levels) have a condition number 1 and all points are located on asphere (2D case). In MATLAB, the command cond(X) calculates the condition number formatrix X.ContrastThe concept of the contrast column is easiest to clarify with an example. We take once againthe earlier used matrix and denote and – with 1 and ‐1. The sum of the columns must bezero.Run numberABC123411‐1‐11‐11‐1‐111‐1In order to find the contrast column for columns A and B, we multiply column A by B. Ifthere is now a column which has the opposite sign on all rows, it is the contrast column forA and B. Now it happens to be column C. This has a meaning in defining the effect ofinteractions later on.Run numberABC12341‐1‐11‐111‐1ResolutionThe resolution of an experiment design tells, what kind of effects can be revealed with thedesign in question. There are three resolutions usually referred to:‐Resolution V or better: main effects and all two variable interactions‐Resolution IV: main effects and a part of two variable interactions‐Resolution III: only main effects.
3. On Statistical TestingHypothesesIn process analysis, we are often encountered with a situation where we are studying, if twopopulations are similar or different with respect to some variable; e.g. if the yield in theprevious example is different at two reaction temperatures. In this comparison, there aretwo possibilities: the populations are either similar or different (statistically).The comparison uses usually means or variances. We are testing, if the energy consumptionof the new process is smaller (in average) than of the existing one or if the variation in somequality variable increases, if we take a new raw material into use.In many cases it is advantageous to set formal hypotheses and do some tests to show, whichis the actual situation. Statistically, there are two possible hypotheses:Null hypothesis claims that there is no significant difference between the populations. It canbe written for means of two populations as follows:H 0 : μ1 μ 2The alternative hypothesis says that two populations differ from each other. There are twopossible alternative hypotheses, a: double‐sidedH a : μ1 μ2In this case the user is not interested, which one of the alternatives is better. The situationmight be even so that the tester does not know to which direction the variable in questioneffect. In the opposite case, we can use one‐sided hypothesisH a : μ1 μ2With this kind of hypothesis we can test the effect of the variable in a more detailed way:e.g. the energy consumption of a new process is smaller than in the existing one. We canalso test only one population against some fixed (target, constraint) value by writing:H 0 : μ1 μoH a : μ1 μoFor instance, we can test, if the conductivity of our waste liquor is smaller than the limit set inthe environmental permission for the plant.In the above definitions, the variance can be tested instead of the mean. Of course, there canbe more than two populations tested. Note that the definitions above are no actual equations,but more or less a formal way to write linguistic hypotheses in a mathematical form.
Working with hypotheses proceeds usually so that the experimenter tries to show that the nullhypothesis is wrong with high enough probability, meaning that the alternative hypothesiscan be accepted. If the null hypothesis cannot be proved wrong, it must be accepted.RisksRisk in this connection describes the probability to make a wrong decision from test data;i.e. to choose the wrong hypothesis. It is mainly controlled by the sample size. There are twopossible errors that the experimenter can do:Alpha error (α): the experimenter accepts the alternative hypothesis, while the nullhypothesis is trueBeta error (β): the experimenter accepts the null hypothesis, while the alternativehypothesis is trueOf course, both errors cannot be made simultaneously. Numerical values are given as 0.1or 0.100%. Usually values 0.95 or 95% are used (meaning that the error takes place with95% probability), but the selection of the value is subjective. Note that these values equal to5% risk. One guideline might be that, if accepting the alternative hypothesis lead to heavyinvestments, the probability of α‐error should be kept small. We will see later that theselection of accepted risk will influence on the number of experiments in matrix designs.Example. It is claimed that with a new control system for pulp cooking, the variance of theKappa number is decreased under 4 units with 95% probability. It can also be said that thecorresponding alternative hypothesis is accepted with an alpha risk of 5% (or 0.05).CriterionQuite often the experimenter wants to know, if the change he is doing has the expectedeffect in the studied system. Before starting experiments, he has to define the requiredminimum change and the β‐risk that minimizes the probability of not accepting theadvantageous change. They are needed in statistical testing.This is necessary, when the whole population cannot be tested, but sampling is needed. Thiscriterion depends on the variance, the acceptable risk and the sample size.Example. Let us assume that we are testing, if steel alloying improves the tensile strength ornot. The existing mean value (μo) is 30000 units and the acceptable minimum change isδ 1500. All products cannot be measured. Decision is made from a sample of products.The hypotheses are nowH 0 : μ1 30000H a : μ1 30000
Following decisions are easy: (a) If the mean of samples is equal or less than 30000, alloyingis not reasonable and (b) if the mean is bigger than 31500, it is advantageous. The problemappears if (c) the mean is between 30000 and 31500; what would happen, if the number ofsamples taken would be increased?x xxxxxxxxxxμo δxxxx xxxxxxμo δx xxμoxxxxxxxμoFigure 3.1. Situations (a) and (b) on the left and situation (c) on the right.We need a criterion that depends on the variance, risk and sample size. In this case it tellshow much bigger than 30000 the mean value must be so that we are on the safe side andcan accept that the alloying is advantageous. Some thinking seems to tell that this valuemust be bigger with higher variance and it can be smaller, if more samples are taken. Thesmaller the α‐risk we can take, the bigger the criterion must be. Based on this thinking wecan write the general equationμσα Uα depends on α‐risk and the form of alternative hypothesis. For one‐sided hypothesis andα 0.05 Uα 1.645. See statistical tables; on‐line calculator is available for example inhttp://www.tutor‐homework.com/statistics tables/statistics tables.html).The alternative hypothesis is accepted, if Null hypothesis is accepted, correspondingly, if If β‐risk is used, the equation becomesμδσ β
Nest tables show examples on using both risks in this example. Remember that alpha riskmeans that the experimenter accepts the alternative hypothesis, while the null hypothesis 00N1212241231358310253140031389If the samples are from two populations and the alternative hypothesis is written asH a : μ1 μ2the criterion is calculated as follows α//σα/σ/Sample sizeThe formula used in sample size calculations depends on the case; i.e. on the form of thehypotheses and if the variance is known.Ho: μ1 μo; σ2 known:N (Uα Uβ)2(σ2/δ2)Ho: µ1 µ2; variances are known and σ12 σ22:N 2(Uα Uβ)2(σ2/δ2)Ho: μ1 μ2; variances are not equal
αβαβσ σσδσ σσδExample. The factory has prepared a light sensitive film for a longer time in the sameprocess conditions. The mean of the film sensitivity is µo 1.1 µJ/in2. The factory wants toimprove the sensitivity and it is believed that decreasing the film thickness from 20 mil (mil[ ] 1/1000 inch) to 18 mil will give the right result. The variance is assumed to stay constant.s2 0.01. Now in this caseHo: μ18 μ20 1.1 µJ/in2Ha: μ18 1.1 µJ/in2α 0.05, β 0.10δ 0.10U0.05 1.645 and U0.10 1.282N (1.645 1.282)2(0.01/0.01) 8.567This result means that 9 experiments must be done, if the given risk levels must be satisfied.Example. The experimenter wants to test the similar product from two different vendorsaiming to find out, if they have significant differences. Risks, criterion and variance are sameas in the previous example. The hypotheses now are:μ:μμμBecause of two‐sided alternative hypothesis,distributions and.βαmust be taken from tables for two‐sided1.96remains the same as in the previous example. The sample size is2 1.961.2820.01 0.0121.02This means that 21 runs are needed at minimum. With this number of tests the similarity ofthe products can be proved with the risks given before.
4. Two level Hadamard Matrix DesignsThis Section deals with Hadamard matrix for eight runs. It was originally developed byFrench mathematician Jacques Hadamard. Plackett ja Burman used it in experiment design1945.There are different Hadamard matrices (8x8‐, 16x16‐, 32x32, 64x64 and 128x128) developedfrom initial vectors by permutation. 8x8‐matrix makes it possible to make 8 runs (T), forseven factors (T‐1) at two levels ( ,‐).Matrix generationInitial vector consisting of seven elements is first written in a column and permutated sixtimes ‐ ‐‐Initial vector ‐ ‐‐‐ ‐ ‐1st permutationOther permutations follow the similar principle. This results in a matrix with seven columnsand seven rows. Note that the order of elements in the initial vector can be different. It isessential that there are four plusses and three minuses. In the final matrix each variable willbe four times at the plus‐level and four times at the minus‐level. This is guaranteed bywriting a row of minuses as the eight row. The 8x8 matrix is completed by adding a columnof plusses as the leftmost column. The columns are numbered starting from zero. Now thewhole matrix is
0 1 ‐ ‐‐‐2‐ ‐ ‐‐3‐‐ ‐ ‐4 ‐‐ ‐‐5‐ ‐‐ ‐6 ‐ ‐‐ ‐7 ‐ ‐‐ ‐This matrix is used in two level designs and seven factors can be tested at maximum. Thecalculated sample size must be 4 or less (each variables is tested four times at minus–leveland four times at plus‐level. Next, we will consider how it is used with different number offactors.One factorIn this case, the experiment design for a factor (variable) A is red from column 1.Run123456780 A1 ‐ ‐‐‐2‐ ‐ ‐‐3‐‐ ‐ ‐4 ‐‐ ‐‐5‐ ‐‐ ‐6 ‐ ‐‐ ‐7 ‐ ‐‐ ‐Now, factor A is kept at the higher level in runs 1, 2, 3 and 5 and at the lower level inruns 4, 6, 7 and 8. The results from different runs are denoted later as response 1,response 2, etc. The effect (see the definition in Chapter 2) of factor A to the response is(response 1 response 2 response 3 ‐ response 4 response 5 ‐ response 6‐ response 7 ‐ response 8)/4The selection of the criterion and the actual calculations are presented in followingexamples.Two factorsIn the two‐factor case, the design matrix looks as follows. The experiment design is incolumns 1 and 2. Column 4 is the contrast column for 1 and 2 and it is used in thecalculations to reveal the effect of interaction between variables A ad B.
Run12345678A1 ‐ ‐‐‐0 B2‐ ‐ ‐‐3‐‐ ‐ ‐‐AB4 ‐‐ ‐‐5‐ ‐‐ ‐6 ‐ ‐‐ ‐7 ‐ ‐‐ ‐Example. Copy machine should work in temperatures (A) between 100 – 200 degrees andwith the relative humidity of air (B) between 30 ‐ 80 % [Diamond, 1981]. Tests are done todefine the effects of these two factors and their possible interactions. The output variable isthe attachment of the colouring agent on the hot surfaces of the machine. Its variance isunknown.The hypotheses now are:μμ:μμ:μμ:μμ:μ0:μ0The risks and criterion are given byα 0.1β 0.1δ 2.5σNote that the criterion is now given as a function of the variance that is actually unknown.We see the reason why later on. Next, the sample size is calculated. If we are going to use8x8 matrix, it should be 4 at maximum. Now, instead of normal distribution, t distribution isused. We are expecting to have a small sample size! One of the alternative hypotheses istwo‐sided and therefore for α‐risk a two sided t distribution is used.2σ δ 4.2
t(4,1‐α/2 0.95) 2.13t(4,1‐β 0.90) 1.53Note that “4” represents the assumed degrees of freedom in t distribution and statisticaltables showing t‐values as a function of degrees of freedom and the probabilitycorresponding the risk in question are used. Using four runs results in a slight higher riskthan required. The design matrix is as shown before. High and low levels for the variablesare chosen as follows:VariableTemperature (A)Humidity (B)Low (‐)10030High ( )20080After doing the test runs, the results look as esult163228151417912Figure below shows the results graphically. High temperature and high moisture seem tolead to colour deposits in the hot surfaces of the machine. This seems logical. According toChapter 2, there seems also to be interaction between these two variables. The question is,however, if these effects were statistically ure 4.1. The results of the test runs with the copy machine. The lower line is for lowhumidity and, respectively, the upper line for high humidity.
Next, the effects are calculated for columns 1, 2 and 4 according to the same procedure asin one factor case:A 16 32 28‐15 14‐17‐9‐12 37B‐16 32 28 15‐14 17‐9‐12 41‐AB 16‐32‐28 15 14 17‐9‐12‐19We see from here that the increase in temperature and humidity increases the responsevariable both directly and also through the interaction. Note that column 4 gives thenegative effect of the interaction (‐AB). The effects are now calculated by dividing the lastrow by 4; the sample sizeX200‐X100 37/4 9.25X80‐X30 41/4 10.25X AB‐X‐AB ‐18/4 ‐4.75Next we need the criterion to which to compare the calculated effects. This requiresvariance of the response variable, but it is not given in this case. It could, however, beestimated with four degrees of freedom from four “free” columns (columns not reserved forany variable) 3, 5, 6, 7. It happens according to the same procedure as calculating the actualeffects before:3‐16‐32 28 15 14‐17 9‐12‐115‐16 32‐28‐15 14 17 9‐12 1In this way, we get four estimates for the varianceS32 (‐11)2/8 15.1256 16‐32 28‐15‐14 17 9‐12‐37 16 32‐28 15‐14‐17 9‐12 1
S52 (1.0)2(8 0.125S62 (‐3)2/8 1.125S72 (1)2/8 0.125The variance is now their average 4.125. There are both one‐sided and two‐sidedhypotheses that both need their own criterion. Using the formula given before andrespective α and β values we have for one‐sided hypothesis 2.17 and for two‐sidedhypothesis 3.03 as the criterion. Comparing the above calculated effects (9.25, 10.25, ‐4.75)we see that their absolute values are bigger than the corresponding criteria. This means thatall effects are statistically significant. As mentioned before, the risks are somewhat higherthan required.Three factorsIn the three‐factor case, all columns are reserved either for actual variables or theirinteractions.Run123456780 A1 ‐ ‐‐‐B2‐ ‐ ‐‐C3‐‐ ‐ ‐‐AB4 ‐‐ ‐‐‐BC5‐ ‐‐ ‐ABC6 ‐ ‐‐ ‐‐AC7 ‐ ‐‐ ‐Some conclusions can be drawn: All columns are in use; either for main effects or two‐factorinteractions. No columns are left for variance estimation. Replications are required for it.The more usual way, however, is to use centre point runs. All possible two‐factorinteractions can be evaluated (Resolution V), but if more factors are included, Resolution Vdoes not realise. No interaction is in two columns and no column has been used forestimating two interactions.From four to seven factorsIf the fourth factor is included it is easy to realize that interactions cannot be reliably found.They must be assumed negligible or care and process knowledge must be practiced. Onlymain effects can be considered, but even then, be careful with the conclusions, becausepossible interactions disturb the analysis. One possibility to get over this is to repeat designswith the most important factors or use bigger matrix from the start.
ABCDRun123456780 BCDA1 ‐ ‐‐‐ACDB2‐ ‐ ‐‐ABDC3‐‐ ‐ ‐‐AB‐CD4 ‐‐ ‐‐‐BC‐AD5‐ ‐‐ ‐ABCD6 ‐ ‐‐ ‐‐AC‐BD7 ‐ ‐‐ ‐Plackett‐Burman screening design uses 8x8 Hadamard‐matrix at Resolution III. It assumes nointeractions and makes it possible to test seven variables with eight runs, if this assumptionis valid. Screening here means testing to find the most important variables for actual testing.Example. There are five variables influencing the production of a certain chemical[Diamond, 1981]. The quality of the chemical is described by the concentration of a side‐product that should be minimized. The variables areCodeABCDEVariableTemperatureCatalyser %Mixing timeSolventWashing time 5 C2.5 %10 minacetone24 h‐15 C3.5 %20 mintoluene48 hIt is probable that there are interactions between at least two variables. The experimentsare expensive; 2000 dollars each, and they take 3 days. They must also be accomplished in asequence. The variance of the side product is 1.0 with 10 degrees of freedom. The target isto improve the process so that the concentration of the side product decreases from 13 %to only 1 %.All alternative hypotheses are now two‐sided:μμ: μ #μEtc.The risks and criterion are nowα 0.10ß 0.05
δ 2.5 %σ2 1.0 and df 10Following table shows now, how the number of tests effects on the resolution, price andduration of the test.TypeFull factorialFractional f.Fractional f.N32168ResolutionV VIIIPrice, 64 00032 00016 000Duration, d964824Utilising the equation given before and the t test, the sample size is now 4.19. The lastalternative is used. Note that all interactions cannot be found and the risks are a little higherthan required. 8x8 Hadanard matrix is used. Variables D and E are now put in columns 4 and5. The criterion with the given α-risk is now 1.27 (t test, df 10). The results are nowRun12345678Results (%)15.52.512.08.013.57.012.013.6Note that the value 1 % is nor achieved with any combination.Following table shows the effects of each variable (A-E) and free columns 2Negative effect means that the high value of the variable is better and v.v. If we compare thevalues with the criterion, we see that variables A and D are not significant. The high values ofB and E and the low value of C are better. If we go back to the original Hadamard matrix, wesee that runs 2 and 6 are done at these ‘optimal’ levels. Columns 6 and 7 show significance.In practice it means that there is some interactions effecting on the response variable. Theproblem is that it is impossible to tell exactly what interactions are in question. If you use theconcept of contrast columns you can easily see that there are two interactions (for twovariables) present in both columns 6 and 7.One possibility to solve this problems is to repeat the whole design, but it would double thecost and time. There is, however, an alternative way:
Let’s go back to look at the results of runs 2 and 6 which are done at the better levels of threesignificant variables. They, however, show very different results: 2.5 and 7 % (variance 1.0).This can be interpreted to be caused by some interactions. Next, two more tests are carriedout. In these tests, B, C and E are kept at their ‘optimal’ levels, and other two combinations ofA and D are tested:Run26910A D Result2.57.00.710.1The criterion for this case is 1.81. The effect for A is 2.45 and for D 6.95. The effect for ADis 0.65 so this interaction is not significant. This test tells that variables A and D aresignificant because of some interactions, but they could not tell which interactions they are.More variables mean more runsThe following Table shows, how the number of factors tested increases when increasing thenumber of runs at different resolutions.Number of 17‐3133‐5365‐127
5. Response Surface Methods5.1 IntroductionLinear methods reveal main effects and interactions, but cannot find quadratic (or cubic)effects. Therefore they have limitations in optimization; the optimum is found in some edgepoint corresponding linear programming. They cannot model nonlinear systems; e.g.quadratic phenomenaY bo b1 x1 b2 x2 b12 x1 x2 b11 x12 b22 x22In an industrial process even third-order models are highly unusual. Therefore, the focus willbe on designs that are good for fitting quadratic models. Following example shows a situationwhere we are dealing with a nonlinear system and a two-level design does not provide uswith the good solution.Example. The yield in a chemical reactor as a function of the reaction time and temperatureis studied with 2‐level, 2 factor tests. Four runs give following 9592Figure 5.1. shows the results graphically. Higher temperature and longer reaction time giveimproved yield. The figure reveals no interaction between the variables.Figure 5.1. Yield versus temperature. The upper curve corresponds the longer reaction time.There is, however, a chance that when the temperature increases, the reaction timeimproves the yield in a nonlinear fashion and there is an optimum point somewhere in themiddle of the temperature range. Therefore, two more runs are done in the centre pointwith respect to the temperature:
695929893,5YieldNow, the relationship between the yield and temperature is no longer linear with the longerreaction time, but a clear optimum exists, when the temperature is 125 degrees and thereaction time is 15 gure 5.2. Graphical presentation with two centre point runs.The example seems to point out that adding centre points into a two‐level design would beenough. However, it cannot estimate individual pure quadratic effects, even though it candetect them effectively. Therefore, real three‐ (or higher) level designs should be used.Including the third level in design means increasing the number of combinations of variablelevels and, consequently, more experiments are needed. This is shown in the followingtable.Number of factorsCombinations with three levels2345692781243729Number of coefficients in aquadratic model610152129When nonlinearities are included in the design, the results give us an idea of the (local)shape of the respon
experiments needed. For two factors at p levels, 2p experiments are needed for a full factorial design. Fractional factorial designs are designs that include the most important combinations of the variables. The significance of effects found by us