Transcription
Performance Excellence in the Wood Products IndustryStatistical Process ControlPart 6: Design of ExperimentsEM 9045 O c to ber 20 11Scott Leavengood and James E. ReebOur focus for the first five publications in this series has been on introducing you toStatistical Process Control (SPC)—what it is, how and why it works, and how todetermine where to focus initial efforts to use SPC in your company.Experience has shown that SPC is most effective when focused on a few key areas asopposed to measuring anything and everything. With that in mind, we described howtools such as Pareto analysis and check sheets (Part 3) help with project selection byrevealing the most frequent and costly problems. Then we emphasized how constructingflowcharts (Part 4) helps build consensus on the actual steps involved in a process, whichin turn helps define where quality problems might be occurring. We also showed howcause-and-effect diagrams (Part 5) help quality improvement teams identify the root causeof problems.In Part 6, we continue the discussion of root cause analysis with a brief introduction todesign of experiments (DOE). We have yet to cover the most common tool of SPC: control charts.It is important, however, to not lose sight of the primary goal: Improve quality, and inso doing, improve customer satisfaction and the company’s profitability.We’ve identified potential causes, but what’s thetrue cause?In an example that continues throughout this series, a quality improvement team fromXYZ Forest Products Inc. (a fictional company) identified an important quality problem, identified the process steps where problems may occur, and brainstormed potentialcauses. They now need to know how specific process variables (e.g., feed speed, woodmoisture, wood species, or tooling) influence the problem. In short, they need to filter thelist to see which potential causes have a significant impact on the problem.They determined that size out of specification for wooden handles (hereafter calledout-of-spec handles) was the most frequent and costly quality problem (Part 3). A flowchart (Part 4) showed that part size and shape were inspected with a go/no-go (i.e.,acceptable/unacceptable) gauge at the infeed to a machine that tapers the handles. Despitethis inspection step, customers still indicated that handle sizes were not meeting theirspecifications. The team constructed a cause-and-effect diagram (Part 5) to brainstorm alist of potential causes for the problem, but they don’t yet know which potential cause isthe true, or root, cause.Scott Leavengood, director, Oregon Wood Innovation Centerand associate professor, Wood Science and Engineering;James E. Reeb, Extension forester and associate professor,Forest Engineering, Resources, and Management,Lincoln County; both of Oregon State University.
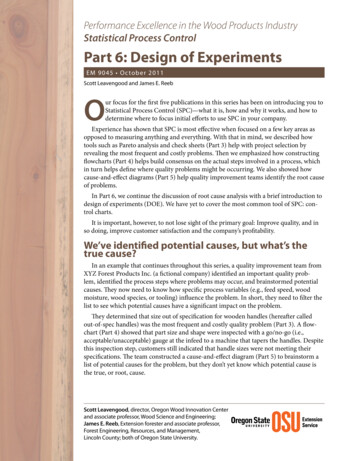
Figure 1 shows the cause-and-effect diagram from Part 5. Issues related to moisture appear in several places on the diagram. Given that wood shrinks and swellswith changes in moisture content, it’s likely that moisture variation is at least one ofthe primary causes. But the team has no assurance that moisture content is the dominant cause rather than machine setup, knife grinding, or any other cause listed onthe diagram.At this point, the team could simply assume that all causes are relevant. They wouldthen develop standard operating procedures related to each and monitor the process toensure procedures are followed. However, it is costly and inefficient to monitor aspectsof the process that have little impact on the problem. Further, equipment operators oftenbecome frustrated when they are expected to spend time making measurements, analyzing, and charting results, particularly when no one follows up on the results.The team needs to identify and focus on the root cause. Other causes may beimportant and need to be addressed in sequence, but for now, the focus is on criticalrather than trivial information. To determine the primary cause or causes, the teamneeds to conduct an experiment.Even in a relatively simple experiment, it can be challenging to set up the experiment, create samples, and analyze results. In an industrial setting, experimentsoften are more complex, time consuming, and expensive (e.g., if samples are testeddestructively), and it is difficult to control the wide range of variables that may affectthe results. And even when everything goes well, making sense of the data is no smalltask. Using statistically designed, conducted, and analyzed experiments can helpensure you get the most value for your investment.Figure 1. Cause-and-effect diagram (reproduced from Part 5 in this series).2
Design of experimentsThere is a difference between designing an experiment and design of experiments(DOE). Designing an experiment is the step in experimentation during which theexperimenter determines objectives for the experiment, variables that will be tested,outcomes to observe, and how outcomes will be measured. Conversely, DOE is a termused for a set of statistical methods and tools that ensure effective and efficient conduct of experiments. Designing an experiment is just one of the steps (although a veryimportant one) in DOE. Other steps include the actual conduct of the experiment,data analysis, and of course, interpretation of the results.An in-depth description of the statistics required to become proficient in DOE isbeyond the scope of this publication. Some industrial engineers and statisticians devotetheir entire careers to this topic. We provide a brief introduction so you will gain someunderstanding of the power and benefits of DOE. As a result, we hope you will investin the necessary training or personnel (e.g., hiring an industrial engineer or statistician)to be able to reap the benefits of DOE. We also want to make you aware of the consequences (e.g., wasted money and time) of not conducting experiments properly.Why not simply tweak the process and see what happens? In fact, companies dothis all the time. In an effort to save time and money, manufacturers often test numerous variables at the same time and observe a limited number of results. Without DOE(and statistics), interpreting the results is often challenging, particularly when severalvariables have been tested. For example, if moisture content, tooling, species, andfeed speed were all varied, how could you tell which variable or combination of variables affected the results? If the factors were varied one at a time in several individualexperiments, how would you know if certain factors interacted (e.g., one set of toolingworks well with one species but not with another)?Also, without an adequate sample size, it’s hard to have any confidence in theresults. If the results come out as you hope, how confident can you be that results willbe the same when the change (e.g., new moisture content, process speed, or adhesive)is made permanent?DOE and the statistics involved help answer these important questions: Which variable or combination of variables affected the results? Are the results significant (i.e., likely to be the same if the experiment wereconducted again)?3
DOE: Step-by-stepDOE involves the following steps:1. Objectives2. Response variables3. Process variables (factors)4. Number of replicates5. Detailed experimental plan6. Factors to be held constant7. Post-experiment plansStep 1. ObjectivesWhy are you conducting the experiment? What does your company hope to learn?Step 2. Response variablesWhat is the outcome of interest? How will you measure it? This step is often morecomplex than it first appears.In our ongoing example, it would be easy to say that handle size is the responsevariable of interest. But is this really the case? The response variable needs to matchthe problem. In this case, what the team is really interested in knowing is whichcombination of process factors lead to the fewest number of out-of-spec handles.Therefore, the number of out-of-spec handles, rather than simply handle size, is theresponse variable of interest.1 Once the team identifies the response variable of interest, they need to determine how it will be measured (e.g., with a go/no-go gauge,caliper, or tape measure), where measurements will be taken (both on the part itselfas well as where in the factory), the number of measurements per handle, and whenmeasurements will be taken (e.g., immediately after machining or after the wood hashad time to equilibrate to ambient conditions).Step 3. Process variables (factors)What process variables (often called factors in DOE) will you intentionally vary inthe experiment? Which can you really control? Do you need control over some thatyou currently don’t control?A cause-and-effect diagram is helpful for deciding which factors to control andwhich to explore, but what if you run an experiment and neglect to explore the majorfactor causing the problem? For example, what if you study moisture content and tooling but later discover that species is the more significant factor? Unfortunately, youcan’t know with certainty which factors to study in a first run. Continuous improvement is a journey, not a destination. Additional experiments will likely be required.Often, the best approach is to rely on employees to guide selection of the factors onthe basis of their experiences.In fact, we are also interested in studying the variability in handle dimensions because (assuming the process is ontarget) lower variability means less material beyond the specification limits. However, studying variation rather than atally of defects or average size adds more complexity to the analysis than intended for this introduction to the subject.14
Factor levelsDetermine how many and what specific settings (levels) of the factors you will test.In our continuing example, the team could test two, three, or more moisture contentsat several levels (e.g., 5% and 15% or 8%, 10%, and 12%). Again, experience should bethe guide. Existing data might show that moisture content of products usually variesfrom 4% to 16% throughout the year. Levels should be realistic but with enough rangesuch that, if the factor is indeed important, real differences are likely to occur. Forexample, it would be better to choose 4% and 8% moisture content rather than 4%and 5%, particularly given the challenges of measuring moisture content accurately towithin 1%.Factor measurementFor discrete factors (i.e., variables that have a finite number of values) such as tooling, you may simply be able to label them (e.g., brand A vs. brand B). For continuousfactors (i.e., variables that can, at least theoretically, have any numerical value) such asmoisture content, you must decide how to measure them (e.g., handheld meter, in-linemeter, or oven-dry test).Step 4. Number of replicatesWhat sample size will you use? For example, will you produce and test one productor 100 products for each test combination? Producing and measuring more replicatestakes more time and costs more. However, the ability to detect significant2 results(known as statistical power) increases as the number of replicates increases.There are statistical formulas that give guidance on the number of replicates neededdepending on the variability of the measure of interest, what level of difference youwant to be able to detect (e.g., 1% or 15%), and your desired certainty in the outcome (e.g., 99.99% or 95% certain). If experience has shown that the response variableis consistent (i.e., low variability), fewer samples may be needed to detect actual differences. If experience suggests high variability in the results, a larger sample will beneeded to detect significant differences. And if variability is extensive, it might makemore sense to improve the stability of the process before conducting an experiment.Step 5. Detailed experimental planThis plan details, step by step, who will do what as well as when and where they willdo it. Specify, in detail, the materials (include suppliers, species, etc.), procedures foreach relevant process, equipment operators involved, measurement tools, testing datesand times, and other relevant information.It’s also critical to consider how you will analyze the data and interpret and usethe results. Be certain you can analyze the data in such a way to be able to answerthe critical questions. In some cases, companies have invested enormous resourcesin conducting an experiment only to later discover that they can’t analyze the data.Statisticians brought in to consult after an experiment often say they really can’t analyze the data because the experiment wasn’t designed in such a way that statisticalmethods can be used effectively.In common usage, the term significant often simply means important and doesn’t qualify the degree of importance.In statistics, significant refers to a mathematical relationship for which there is a level of significance. For example,results of an experiment may indicate that two treatments are different at the “0.05 level of significance.” This meansthere is only a 5% chance of observing such a difference purely by chance.25
Dry runAt this point in the planning, it can be helpful to do a dry run to identify whatmight go wrong. For example, you might need to move material off the productionline for measurement or create special fixtures for taking the measurements. A dryrun can help identify when Murphy’s Law (i.e., anything that can go wrong will) mightoccur. For example, is it possible that samples at high moisture content (i.e., swollen)will become jammed in the machinery? You can also analyze preliminary data to see ifthe statistics will work.Budget and deadlineDuring this step, you should develop a budget for the experiment and set deadlines.Experienced experimenters recommend spending no more than about one fourth ofthe full budget for the experiment on the first trial. Many times, a first trial will revealmore questions and provide suggestions for what to study next.Step 6. Factors to be held constantIn Step 3, you identified which factors to intentionally vary. Other factors that areheld constant still need to be taken into account.Companies naturally want to minimize the hassle and disruption inherent in industrial experimentation by answering all possible questions in a single experiment. Thisapproach results in huge experiments3 that take an extremely long time to design andconduct, data that are challenging to analyze, and results that are difficult to interpret.The preferred approach is to attempt to hold constant other potential causesrevealed in the cause-and-effect diagram. In our continuing example, the number ofout-of-spec handles is the response variable, and factors that might be held constantinclude operator, measurement devices, time of day, and machine. In short, the goalin this step is to eliminate, to the greatest possible extent, all other potential causes ofvariability. This provides greater assurance that any differences in results are due to theselected experimental factors.Step 7. Post-experiment plansHow will you use the results? If the results suggest a potential solution, how, bywhom, and when will it be implemented? Will you conduct confirmation trials (i.e.,run a few trials at the new settings to confirm that the new settings lead to the desiredimprovement)? How will you monitor the process to be sure these changes remain inplace and continue to effectively reduce the problem?If the tests are not successful (i.e., did not reveal a potential solution) or regardlessof success, you may need to conduct follow-up experiments to explore other factors.For example, you might explore some of the factors that were held constant in the initial experiment.For example, an experiment with five moisture contents, eight wood species, four types of tooling, 10 machines,six operators, and three shifts—even with only one replicate for each combination—would require producing 28,800samples.36
Using DOE: An exampleWe now illustrate these seven DOE steps using our continuing example (i.e., outof-spec handles).XYZ Forest Products Inc. produces wooden handles for push brooms. Members ofa quality improvement team visited a customer’s facility and examined the contentsof the scrap and rework bins. Using a check sheet and Pareto chart (Part 3), they wereable to identify out-of-spec handles as the most frequent and costly quality problem. Aflowchart (Part 4) helped build team consensus on the actual (vs. ideal) steps involvedin the manufacturing process and enabled the team to identify where in the processproblems might occur as well as where measurements were already being taken. Acause-and-effect diagram (figure 1 and Part 5) indicated several possible causes of theproblem.The team now needs to determine the root cause, or combination of causes, of theundesired effect. Once they know which variables have the greatest impact, they willknow which are most critical to control. They can then establish standard operatingprocedures to more closely control these variables and a monitoring system to ensurethe process remains stable in day-to-day operations.Following the DOE steps described previously, the team develops the following(abbreviated) plan.Steps 1 and 2. Objectives and response variablesOn the basis of company experience and discussions during development of thecause-and-effect diagram, the team establishes the objective of exploring the influence of moisture content, species, and tooling on the number of out-of-spec handles.Hence, the number of out-of-spec handles is the response variable. Because the handles are circular rather than oval, the team decides to measure each handle in a singlelocation 1 inch from the tip by using a go/no-go gauge. They also decide to measurethe handles after 1 week of storage because this product usually sits in the warehousefor at least that long before it is delivered to customers’ facilities.Step 3. Process variables (factors)The team decides to test two levels of moisture content (6% and 12%), tooling(existing and a new brand), and wood species (birch and poplar, the company’s toptwo species used by volume). Moisture content will be measured with a handheldmoisture meter calibrated in accordance with the manufacturer’s guidelines. Table 1shows the eight combinations that will be tested.Table 1. Factor combinations to be testedFactor combinationToolingSpeciesMoisture ewpoplar6%8newpoplar12%7
Step 4. Number of replicatesThe team spends a fair amount of time debating the number of replicates. Theyrealize the response variable (number of out-of-spec handles) is a tally or count (i.e.,a discrete factor) rather than a measurement for an individual item (i.e., a continuousfactor). In other words, they will tally out-of-spec handles in batches of products.The team decides to use their standard batch size of 50 handles and five replicates(batches) per combination. For example, they will make a batch of 50 handles at 6%moisture content using existing tooling on birch and then count and record the numberof out-of-spec handles in this batch. This will be the first replicate for this combination.They will repeat the process four more times for this combination of moisture content,tooling, and species and then repeat the process for the other seven factor combinations(Table 1). The experiment will require the team to make and measure 2,000 handles(eight factor combinations five replicates 50 handles per replicate).Step 5. Detailed experimental planThe quality manager develops a detailed plan for the experiment that outlines allsteps involved. The team conducts a dry run with sample pieces at the high and lowend of the moisture content range, with the new tooling, and with both species. Theyprocess and measure several pieces to ensure all will go smoothly during the actualexperiment. The dry run helps them recognize that accurately using the go/no-gogauge is difficult. As a result, they develop a fixture that holds the handle steady andenables measurement of each handle at the same location on the handle. The team alsorealizes that simple statistical methods available in software such as Microsoft Excelwon’t work with this experimental design. They will have to use specialized statisticalsoftware, or perhaps work with a consulting statistician.Step 6. Factors to be held constantTo minimize variation due to factors that are not part of the experiment, the teamdecides to hold several factors constant. There will be only one operator using a singlemachine, the same operator will take the handle measurements and use a single go/no-go gauge, and the number of samples required is small enough that all pieces canbe produced during one shift.There are risks of variation related to the passage of time. For example, productsin the first batch may be different from products in the last batch because of operator experience or fatigue, changes in ambient conditions, or tool wear. Therefore, theteam plans to randomize the order of batches. They list the eight factor combinations(Table 1) and then randomly assign a number from 1 to 40 (the total number ofbatches) to determine which batch will be produced first, second, and so on.Step 7. Post-experiment plansAssuming the results suggest specific factors (or factor combinations) that lead toa reduction in the number of out-of-spec handles, the team discusses how they willimplement the findings. For example, they talk about other areas that may be affected,such as moisture checks, knife grinding, preventive maintenance, and machine set up.They also discuss running a confirmation trial as well as follow-up experiments withother variables (e.g., other species and machines).8
ResultsTable 2 shows data collected during the example experiment. Simply looking at thetable probably won’t reveal which combination is best for minimizing the number ofout-of-spec handles. It is often impossible to develop conclusions from raw data. That’swhy statistics are integral to DOE.Table 2. Experimental results—raw plar3BatchMC(%)1Tooling SpeciesOutofspec(no.)Moisture content.And although averaging the results for each of the eight factor combinations simplifies things somewhat, the team can’t draw any conclusions with certainty (Table 3).They might be able to determine that 6% moisture content is better than 12% moisturecontent. But remember, these are averages. At 6% moisture content, there were as fewas two and as many as seven out-of-spec handles in a batch. At 12% moisture content,there were as few as three and as many as nine out-of-spec handles in a batch. Giventhis amount of variability, the team can’t say with confidence that 6% moisture contentis better than 12% moisture content. The team must also consider tooling, species, andfactor combinations (known as interactions). For example, maybe the new toolingworks better for poplar than for birch (a tooling–species interaction). Being able toidentify interactions is a major benefit of DOE and the use of statistics.9
Table 3. Experimental species)Out-of-spec handles (avg. .212–new–poplar3.8Moisture content.DOE and statisticsThe primary benefit of DOE and the use of statistical methods for analysis is theability to determine if results are statistically significant. In other words, statisticalanalysis can indicate how likely it is that a repeated experiment will yield the same orsimilar results. For example, results might show that “species is significant at p 0.05.”This means there is a 5% chance of observing such a difference purely by chance andthat results would likely be similar in a repeated experiment. Such results can justifymaking changes (e.g., using different tooling).Conversely, when results are not significant, there is no assurance that a repeatedexperiment will yield similar results. For example, results may indicate that the average number of out-of-spec handles is higher for the existing tooling than for thenew tooling. But if tooling is not statistically significant, results might be different inrepeated experiments. Therefore, if the team switches to using the new tooling, theyshouldn’t be surprised if results are not consistent.It isn’t necessarily a bad thing if experimental results show that a factor is not significant. Knowing which factors are and are not significant helps determine which factorsare important to monitor (i.e., the significant ones) and which are not as critical.And although it is good to know the results of an experiment, what is reallyimportant is what the results will be over the long term if changes are made. In thecase of our continuing example, assume that species is significant and, specifically, thatthere are fewer out-of-spec handles for poplar than for birch. If the company stopsusing birch, is it guaranteed that there will be fewer out-of-spec handles? No. The statistical analysis simply provides confidence that species has an impact on the results.Running a confirmation trial can increase confidence in the findings. However,many factors were held constant (e.g., operator, shift, environmental conditions, andmachine), and other factors were not explored. DOE helps companies make informeddecisions to solve problems and improve processes, but the complex nature of manufacturing processes generally prevents guaranteed results.10
Again, it’s beyond the scope of this publication to train you in DOE. Our primaryobjective is to demonstrate the power and benefits of DOE with an example. We hopethis information and example will encourage you to invest in the necessary trainingor personnel to be able to effectively use the power of DOE in your company. Ratherthan walk through all steps involved in data analysis, we will simply present the resultsof the analysis and explain what they mean.Statistical analysis exampleIn our ongoing example, the team uses Stat-Ease Inc.’s Design-Expert software toanalyze the data. This software helps users select factors (e.g., moisture content, tooling, and species) and levels (e.g., 6% and 12%, existing and new tooling, and birchand poplar), number of replicates (e.g., 5 batches with 50 handles each), and responsevariables (e.g., number of out-of-spec handles). It then randomizes the order of theexperimental runs (to minimize risks of variation related to the passage of time) andprovides a spreadsheet-style table into which users enter results.The ANOVA (analysis of variance) table for this experiment shows a value ofp 0.0001 for the model as a whole. This means that at least one of the factors studiedis significant. If this were not the case, there wouldn’t be any point in looking at theresults any further; the team would conclude that the differences were due to factorsthat were not researched or the normal variability in the process. The ANOVA tablealso indicates that moisture content, species, and a tooling–species interaction areall significant. However, neither tooling as a standalone factor nor the interactionbetween moisture content and tooling is significant.This is a good start, but the team needs more information before they can make anydecisions about what to change. Specifically, they need to know what level of moisturecontent is best and the nature of the tooling–species interaction. Figures 2 and 3 helpanswer these questions.Figure 2 shows the number of out-of-spec handles for each species, type of tooling,and moisture content. There are fewer out-of-spec handles at 6% moisture contentthan at 12% moisture content regardless of species and tooling. Rectangles indicatethe average number of out-of-spec handles at each moisture content, and circles showthe individual data points from the experiment. The team can’t make decisions onthe basis of the averages alone; they must also take into account the variability withineach group (i.e., the vertical spread between the circles). Because the ANOVA tableindicates that moisture content is significant, the team can state with some certaintythat machining the wood at a lower moisture content will result in fewer out-of-spechandles.Knowing there is a tooling–species interaction, the team can’t draw any conclusionsabout species from figure 2. It appears there are more out-of-spec handles for birchthan for poplar, but the team has to suspend judgment until they look at charts showing the nature of the interaction between species and tooling. These charts (figure 3)are a bit more complicated to interpret.11
Existing toolingPoplarNumber out of specBirchMoisture contentNew toolingPoplarNumber out of specBirchMoisture contentFigure 2. Experimental results for moisture content.Charts created using Design-Expert software.12% moisture contentNumber out of spec6% moisture contentToolingFigure 3. Experimental results for tooling–species interaction.Charts created using Design-Expert software.12
The chart on the left in figure 3 shows the results at 6% moisture content. Existingtooling is on the left side of the chart, and new tooling is on the right. Birch is theupper line, and poplar is the lower line. As in figure 2, rectangles indicate t
Design of experiments There is a difference between designing an experiment and design of experiments (DOE). Designing an experiment is the step in experimentation during which the experimenter determines objectives for the experiment, variables that will be tested, outcomes to observe, and