Transcription
(2018). In E. J. Wagenmakers & J. T. Wixted (Eds.),Stevens’ Handbook of Experimental Psychology andCognitive Neuroscience, Fourth Edition, Volume Five:Methodology. New York: Wiley.The Categorization Experiment:Experimental Design and Data AnalysisF. Gregory Ashby, Vivian V. ValentinDepartment of Psychological & Brain Sciences,University of California, Santa BarbaraThe long history of categorization experiments indicates that many important design choicescan critically affect the quality of the resulting data. Unfortunately, the optimal choices dependon the goals of the experiment, so there is no single template that a new researcher can follow.This chapter describes methods needed to design effective categorization experiments, and specialized methods for analyzing the resulting data. First, a number of important experimentaldesign choices are discussed, including: 1) whether a categorization or identification experiment is more appropriate, 2) what type of category structure should be used, 3) how to choosethe stimuli, 4) how to construct the categories so they have optimal statistical properties, 5) howto present feedback following each response, and 5) design choices that make it easy to assessparticipant performance. Second, several specialized methods for analyzing categorization dataare described, including forward and backward learning curves, and a statistical procedure forstrategy analysis that can identify participants who were guessing, using a single-cue explicitrule, or using some multi-cue similarity-based strategy.Keywords: Categorization, Rule-based, Information Integration, Prototype distortion,Learning curves, Decision bound modelingIntroductionThe chapter is organized as follows. First, we describe anumber of important design choices the experimenter mustconsider. These include: 1) whether a categorization oridentification experiment is more appropriate, 2) what typeof category structure to use, 3) how to choose the stimuli– for example, whether the stimuli are real-world or artificial, constructed from binary or continuous dimensions, constructed from dimensions that are perceptually separable orintegral, and how many stimulus dimensions should be allowed to vary across trials, 4) how to construct the categoriesso they have optimal statistical properties, 5) how to presentfeedback following each response – specifically whether anyfeedback should be provided at all, and if training is provided, whether it should be observational or feedback-based,when the feedback is best to present, and whether to makethe feedback deterministic or probabilistic, and 5) designchoices that make it easy to assess participant performance.Second, we describe several specialized methods for analyzing categorization data. This includes discussions of forwardand backward learning curves and of a statistical procedurefor strategy analysis that can be used for example, to decidewhether a particular participant was randomly guessing, responding based on some simple single-cue explicit rule, orusing some multi-cue similarity-based strategy. Finally, weclose with some conclusions.Categorization is the act of responding the same to allmembers of one stimulus class and differently to membersof other classes. It is a key skill required of every organism because, for example, it allows prey and nutrients tobe approached and predators and toxins to be avoided. Notsurprisingly, categorization experiments are quite popularwithin the broad field of cognitive science.Although on the surface it may seem like a simple matter to design a categorization experiment, in reality, decadesof research has revealed that many important design choicesmust be made that can critically affect the quality of the resulting data. Furthermore, the optimal choices depend onthe goals of the experiment, so there is no single templateor recipe that a new researcher can automatically follow. Inaddition, specialized methods have been developed for analyzing categorization data that are not typically described,for example, in statistics textbooks. Thus, there is a fairlysubstantial, yet arcane set of knowledge necessary to designand run a successful categorization experiment. Even so, weknow of no single currently available source that describesthis knowledge. The goal of this chapter is to address thislimitation. Specifically, we describe the methods needed todesign effective categorization experiments, and we also describe the most popular specialized methods for analyzingthe resulting data.1
2CATEGORIZATION METHODSCategorization versus IdentificationTechnically, any task with a many-to-one stimulus-toresponse mapping requires categorization. Tasks with a oneto-one stimulus-to-response mapping require identification.For example, we might categorize people as men or women,but we identify only one person as our biological mother.When run in laboratory settings, conditions are typically arranged so that errors are common, whether the task is categorization or identification. Perfect accuracy conveys littleinformation – literally, because it requires few bits of information to describe, but also psychologically, because in mostcases, it can be produced, at least theoretically, by many different psychological processes.Most categorization experiments use at least 7 or 8 stimuli,and it is not uncommon to use hundreds. These are most typically assigned to 2 categories (and therefore 2 responses), but3 or 4 categories are also common. The most common choicein identification experiments is to include only 4 stimuli andresponses, but much larger stimulus sets have also been studied (Townsend, 1971). In both types of experiment, the mostwidely studied dependent measure is accuracy. The variousaccuracy values estimated in a categorization or identification experiment are collected in a confusion matrix, whichcontains a row for every stimulus and a column for everyresponse. The entry in row i and column j lists the numberof trials on which stimulus S i was presented and the participant gave response R j . In categorization experiments theconfusion matrix will always have more rows than columns,whereas in an identification experiment, the confusion matrixis always square.For example, consider experiments where the stimuli arephotographs of 10 different faces. A categorization taskmight ask participants to determine the gender of each face,in which case the confusion matrix will have 10 rows and2 columns. The 2 entries in row 5, for example, will bethe frequencies that the participant responded “Female” and“Male” when presented with face #5. An identification taskwith these same stimuli would require participants to respondwith the name of the person whose face was shown on eachtrial. Now the confusion matrix is 10 10 and the entries inrow 5 will be the frequencies that the participant respondedwith each of the 10 different names when face #5 was shown.Note that in both experiments, one column in each row givesthe frequency of each correct response and the other entriesdescribe the various errors (or confusions). So if face #5 belongs to a female named “Hannah” then in the categorization experiment the entry in row 5 and the column labeled“female” would contain the frequency of correct responsesto face #5, whereas in the identification experiment the entryin row 5 and the column labeled “Hannah” would contain thefrequency of correct responses to face #5. Note also that eachrow sum equals the total number of stimulus presentations ofthat type. So if each stimulus is presented 100 times then thesum of all entries in each row will equal 100. This meansthat there is one constraint per row, so an n m confusionmatrix will have n (m 1) degrees of freedom available fordata analysis.To ensure errors in identification experiments, the stimuli are all typically selected to be highly confusable. Thiscould be done by choosing perceptually similar stimuli, orby limiting exposure duration. Regardless of the method,errors are most often made because of these perceptual confusions. As a result, an identification experiment is a goodchoice if one is interested in studying the sensory and perceptual processes that cause such confusions. In categorizationexperiments, perceptual confusions are also often inevitable.Even so, most errors are not caused by such confusions, butrather by the application of a suboptimal decision strategy.For example, any confusion in an identification experimentcauses an error, whereas two types of confusions are possible in categorization experiments. In a within-category confusion, the participant mistakes one stimulus for another inthe same category, whereas in a between-category confusion,the presented stimulus is mistaken for a stimulus belongingto some other category. Within-category confusions do notcause errors and in experiments in which categories are defined perceptually (i.e., so that all category exemplars sharesimilar perceptual features), within-category confusions areoften more common than between-category confusions. Forthis reason, categorization experiments are more useful forstudying decision processes than for studying sensory andperceptual processes.Category StructurePerhaps the first choice an experimenter must make whendesigning a categorization experiment is to choose the category structures that the participants will be asked to learn.Although there are, of course, an infinite number of possibilities, many of these can be classified into one of four types.These are described in this section. Which of these different tasks is best will depend on the research goals. This isbecause the evidence is good that the different types of tasktend to rely on qualitatively different types of learning andmemory.Rule-Based Category-Learning TasksRule-based (RB) category-learning tasks are those inwhich the category structures can be learned via some explicit reasoning process. Frequently, the rule that maximizesaccuracy (i.e., the optimal rule) is easy to describe verbally(Ashby, Alfonso-Reese, Turken, & Waldron, 1998). In themost common applications, only one stimulus dimension isrelevant, and the observer’s task is to discover this relevantdimension and then to map the different dimensional valuesto the relevant categories. Even so, RB tasks can require attention to multiple stimulus dimensions. For example, any
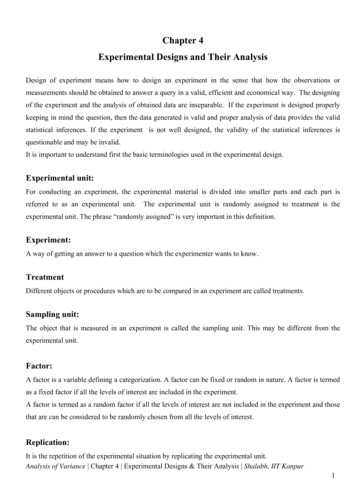
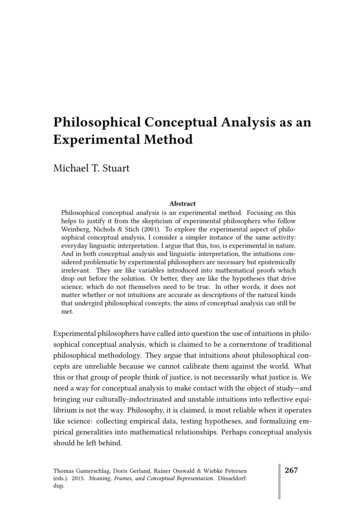
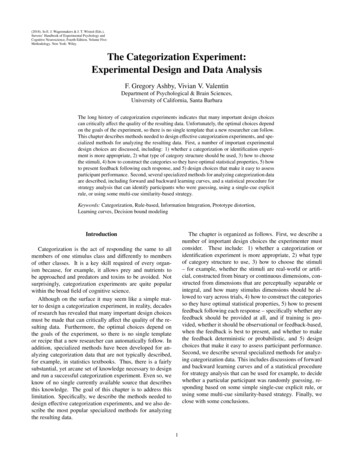
CATEGORIZATION METHODStask where the optimal strategy is to apply a logical conjunction or disjunction is rule based – as is the XOR problem(i.e., exclusive or). The key requirement is that optimal accuracy can be achieved by making independent decisions aboutsingle stimulus dimensions and that these decisions can becombined in ways that follow the rules of Boolean algebra.For example, the conjunction rule: “Respond A if the stimulus has small values on the X and Y dimensions” requiresindependent decisions about whether the value on dimensionX is small or large and whether the value on dimension Y issmall or large and then the outcomes of these decisions arechecked to see if both were judged small.RB category-learning tasks have a long history, datingback at least to Hull (1920). During the next 50 years orso, RB category learning was referred to as ‘concept identification’ or ‘concept formation.’ Many empirical studies werereported (e.g., Bower & Trabasso, 1964; Kendler, 1961), anda variety of different theories and mathematical models wereproposed (e.g., Bourne Jr & Restle, 1959; Cotton, 1971; Falmagne, 1970). Shepard, Hovland, and Jenkins (1961) studied the learning of six different types of category structures.Their type I category structure was a one-dimensional RBtask, and their type II structure was an exclusive-or task.RB tasks are also widely used during neuropsychological assessment. Specifically, the well-known WisconsinCard Sorting Test (Heaton, Chelune, Talley, Kay, & Curtiss, 1993), which requires participants to learn a series ofone-dimensional RB tasks is among the most widely usedassessments of frontal-lobe dysfunction (Milner, 1963). RBtasks are sensitive to frontal dysfunction because considerable evidence suggests that RB category learning depends onworking memory and selective attention (Ashby et al., 1998;Maddox, Ashby, Ing, & Pickering, 2004; Waldron & Ashby,2001; Zeithamova & Maddox, 2006) – skills that are boththought to depend heavily on prefrontal cortex (e.g., Braveret al., 1997; Curtis & D’Esposito, 2003; Kane & Engle,2002; Miller & Cohen, 2001). Thus, an RB task is a goodchoice if the research goals are to study some aspect of executive function.Information-Integration Category-Learning TasksInformation-integration (II) tasks are those in which accuracy is maximized only if information from two or morestimulus components (or dimensions) is integrated at somepre-decisional stage (Ashby & Gott, 1988). Perceptual integration could take many forms – from treating the stimulus asa Gestalt to computing a weighted linear combination of thedimensional values. The result is often called a similaritybased strategy. Typically, the optimal strategy in II tasksis difficult or impossible to describe verbally (Ashby et al.,1998). Explicit-rule strategies can be applied in II tasks, butthey generally lead to sub-optimal levels of accuracy becauseexplicit-rule strategies make separate decisions about each3stimulus component, rather than integrating this information.Examples of RB and II tasks constructed from the samestimuli are shown in Figure 1. Note that each stimulus isa circular sine-wave grating and that the stimuli vary acrosstrials on two continuous-valued dimensions – bar width andbar orientation. Note also that the A and B categories in thetwo tasks are identical, except the II categories are rotated45 counterclockwise in width-orientation space. Therefore,the two tasks are exactly matched on all category separationstatistics. The key difference is that the optimal strategy inthe II task can not be discovered or described by any decisionstrategy that makes independent decisions on each stimulusdimension. In both Figure 1 tasks, the categories are definedby drawing random samples from bivariate normal distributions. This is the ‘randomization technique’ introduced byAshby and Gott (1988). This method of constructing categories is described in detail in a later section.Many II tasks use binary-valued stimulus dimensions. Anexample is shown in Figure 2, which also shows RB categories constructed from the same stimuli. Note that thestimuli vary on four binary-valued dimensions (backgroundcolor, symbol color, symbol shape, and symbol number).For the RB categories, the optimal rule is obvious – if thebackground is blue the stimulus is in category A, whereasa yellow background means the stimulus is in category B.To create the II categories, one of the four dimensions wasrandomly selected to be irrelevant. In Figure 2 the irrelevantdimension is symbol shape. Next, for the three relevant dimensions, one level was randomly selected and assigned anumerical value of 1, whereas the other value was assigneda value of 0. In Figure 2, blue background, red symbol, andtwo symbols were all assigned a value of 1. Finally, the rulethat perfectly assigns each stimulus to its correct category isthe following: ‘Respond A if the sum of the values on therelevant dimensions exceeds 1.5; otherwise respond B.’ Notsurprisingly, participants do not discover this rule – at leastnot explicitly. Even so, they reliably learn II categories ofthis nature, and the evidence suggests that the learning thatoccurs is similar to the type of learning that occurs with thevery different Figure 1 II categories (Ashby, Noble, Filoteo,Waldron, & Ell, 2003; Crossley, Paul, Roeder, & Ashby, inpress; Waldron & Ashby, 2001).One advantage of binary-valued stimulus dimensions isthat learning is usually fairly quick, due to the small number of stimuli. For example, typical participants can learnthe Figure 2 categories in around 80-100 trials, compared tothe 500 or 600 trials that are usually required to learn the IIcategories shown in Figure 1. On the other hand, one potential weakness of binary-valued dimensions is that there willalways be several strategies that are equivalent to the optimal information-integration strategy. For example, in Figure2 the following logical rule works perfectly for the II cate-
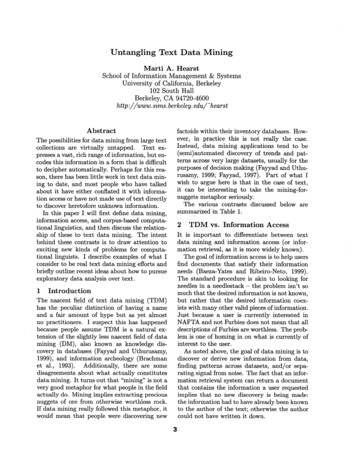
4CATEGORIZATION METHODSFigure 1. Examples of rule-based (RB) and informationintegration (II) category structures. Each stimulus is a sinewave disk that varies across trials in bar width and bar orientation. For each task, three illustrative Category A andB stimuli are shown. The small rectangles and open circlesdenote the specific values of all stimuli used in each task.In the RB task, only bar orientation carries diagnostic category information, so the optimal strategy is to respond with aone-dimensional bar-orientation rule (steep versus shallow).In the II task, both bar width and orientation carry usefulbut insufficient category information. The optimal strategyrequires integrating information from both dimensions in away that is impossible to describe verbally.gories1 : “Respond A if the background is blue and there aretwo symbols or the background is blue and the symbols arered or the background is yellow and there are two symbols;otherwise respond B.” Another strategy that will always beavailable with binary-valued stimulus dimensions is to memorize the response associated with each stimulus. Althoughthese strategies may seem unlikely, their existence can sometimes complicate interpretation of the resulting data. Notethat with the Figure 1 II categories, such alternative strategiesare not possible.A popular II task that uses categories similar to thoseshown in Figure 2 is known as the weather-prediction task(Knowlton, Squire, & Gluck, 1994). In the original version,one, two, or three of four possible tarot cards are shown to theparticipant, whose task is to indicate whether the presentedconstellation signals rain or sun. Each card is labeled witha unique, and highly discriminable, geometric pattern. Fourteen of the 16 possible card combinations are used (the zeroand four-card combinations are excluded) and the optimalstrategy requires using all available cues. The greatest difference between the weather-prediction task and the II taskshown in Figure 2, is that the weather-prediction task usesprobabilistic feedback. For example, in the Figure 2 II task, ifthe participant responds A to the blue box containing a singlered circle then the feedback is always that the response wascorrect. With probabilistic feedback of the type used in theweather-prediction task, a participant who responds A to thisstimulus might be told ‘Correct’ with probability 0.8 (for example) and ‘Incorrect’ with probability 0.2. Because of thisprobabilistic feedback, in the original version of the task thehighest possible accuracy was 76% correct (Knowlton et al.,1994). The choice of whether to use deterministic or probabilistic feedback is discussed in detail in the section belowentitled “Feedback Choices.”Another popular II categorization task that is closely related to the II categories illustrated in Figure 2 is known asthe 5/4 categorization task because it assigns 5 stimuli to Category A and 4 to Category B. An example is shown in Figure3, where the two categories were constructed from the samestimuli used to create the RB and II categories in Figure 2.Note that the 5/4 categories use only 9 of the 16 possiblestimuli that can be created from these 4 binary-valued dimensions. The 7 missing stimuli are frequently used as follow-uptransfer stimuli to assess the nature of learning. The 5/4 taskwas created by Medin and Schaffer (1978) and has been usedin more than 30 studies – frequently to test predictions ofexemplar theories of categorization.Evidence suggests that success in II tasks depends on pro1Technically these are not II categories, since an optimal strategy can be described verbally. Even so, this verbal rule is so complex that we expect it to be discovered by few participants. Thus, thecategories in the bottom panel of Figure 2 can serve as an effectivesubstitute for true II categories.
CATEGORIZATION METHODS5cedural learning that is mediated largely within the striatum(Ashby & Ennis, 2006; Filoteo, Maddox, Salmon, & Song,2005; Knowlton, Mangels, & Squire, 1996; Nomura et al.,2007). For example, one feature of traditional procedurallearning tasks is that switching the locations of the responsekeys interferes with performance (e.g., Willingham, Wells,Farrell, & Stemwedel, 2000). In agreement with this result,switching the locations of the response keys interferes withII performance but not with RB performance (Ashby, Ell, &Waldron, 2003; Maddox, Bohil, & Ing, 2004; Spiering &Ashby, 2008). Thus, the nature of learning appears to be different in RB and II tasks. In RB tasks, evidence suggests thatparticipants learn to decide whether each stimulus is a member of an abstract ‘A’ or ‘B’ category, whereas in II tasks,participants appear to learn to associate a motor goal witheach stimulus (e.g., press the button on the left or press thebutton on the right). For these reasons, an II task is a goodchoice if the goal is to study procedural learning.Unstructured Category-Learning TasksFigure 2. Examples of rule-based (RB) and informationintegration (II) category structures constructed from stimulithat vary on four binary-valued dimensions.Figure 3. Examples of the 5/4 category structure popularizedby Medin and Schaffer (1978).Categories used in II tasks have high levels of perceptual similarity. In an unstructured category-learning task, thestimuli are assigned to each contrasting category randomly,and thus there is no rule- or similarity-based strategy for determining category membership. Because similarity can notbe used to learn the categories, the stimuli are typically visually distinct (i.e., non-confusable) and low in number. Forexample, each category generally includes 8 or fewer exemplars (and 4 is common).Unstructured category-learning tasks are similar to highlevel categorization tasks that have been studied for decadesin the cognitive psychology literature. For example, Lakoff(1987) famously motivated a whole book on a category in theAustralian aboriginal language Dyirbal that includes women,fire, dangerous things, some birds that are not dangerous, andthe platypus. Similarly, Barsalou (1983) reported evidencethat ‘ad hoc’ categories such as “things to sell at a garagesale” and “things to take on a camping trip” have similarstructure and are learned in similar ways to other ‘common’categories.Although intuition might suggest that unstructured categories are learned via explicit memorization, there is nowgood evidence – from both behavioral and neuroimagingexperiments – that the feedback-based learning of unstructured categories is mediated by procedural memory. First,several neuroimaging studies of unstructured category learning found task-related activation in the striatum, as onewould expect from a procedural-learning task, and not inthe hippocampus or other medial temporal lobe structures, aswould be expected if the task was explicit (Lopez-Paniagua& Seger, 2011; Seger & Cincotta, 2005; Seger, Peterson,Cincotta, Lopez-Paniagua, & Anderson, 2010). Second,Crossley, Madsen, and Ashby (2012) reported behavioral ev-
6CATEGORIZATION METHODSidence that unstructured category learning is procedural. Asmentioned previously, a hallmark of procedural learning isthat it includes a motor component, and Crossley et al. (2012)showed that switching the locations of the response keysinterfered with unstructured categorization performance butnot with performance in an RB task that used the same stimuli. Thus, feedback-mediated unstructured category learningseems to include a motor component, as do other procedurallearning tasks.For these reasons, the unstructured category-learning task,like the II task, is a good choice if the goal is to study procedural learning. However, the two tasks each have their ownadvantages and disadvantages. II tasks constructed via therandomization technique, such as the one illustrated in Figure1, offer excellent observability of decision processes (i.e., viathe strategy analysis described in the section below entitled“Decision Bound Modeling”), and they allow direct comparisons to RB tasks that are exactly equated on all categoryseparation statistics. The disadvantage however, it that learning is slow – typically requiring 600-800 trials. In contrast,learning in unstructured tasks can occur much more quickly,and the speed of learning is under direct experimenter controlvia his or her choice as to the number of alternative stimuli.The disadvantage though is that a strategy analysis is usuallyimpossible.Prototype-Distortion Category-Learning TasksIn prototype-distortion category-learning tasks, the category exemplars are created by randomly distorting a singlecategory prototype. The most widely known example usesa constellation of dots (often 7 or 9) as the category prototype, and the other category members are created by randomly perturbing the spatial location of each dot. Sometimesthe dots are connected by line segments to create polygonlike images. Random dot and polygon stimuli and categorieshave been used in dozens of studies (e.g., Homa, Rhoads, &Chambliss, 1979; Homa, Sterling, & Trepel, 1981; Posner &Keele, 1968; Shin & Nosofsky, 1992; Smith & Minda, 2002).Two different types of prototype distortion tasks are common – (A, B) and (A, not A). In an (A, B) task, two prototype patterns are created. The category A exemplars arethen constructed by randomly distorting one prototype andthe category B exemplars are constructed by randomly distorting the other prototype. The task of the participant is torespond with the correct category label on each trial (i.e., “A”or “B”). An important feature of (A, B) tasks is therefore thatthe stimuli associated with both responses each have a coherent structure – that is, they each have a central prototypicalmember around which the other category members cluster.Thus, within-category similarity is equally high in both categories in (A, B) prototype-distortion tasks. In (A, not A)tasks, on the other hand, there is a single central CategoryA and participants are presented with stimuli that are eitherexemplars from Category A or random patterns that do notbelong to Category A. The participant’s task is to respond“Yes” or “No” depending on whether the presented stimulus was or was not a member of Category A. In an (A, notA) task, the Category A members have a coherent structuresince they were created from a single prototype, but the stimuli associated with the “not A” (or “No”) response do not.Historically, prototype distortion tasks have been run in both(A, B) and (A, not A) forms, although (A, not A) tasks aremore common.A variety of evidence supports the hypothesis that learning in (A, not A) prototype-distortion tasks is mediatedprimarily by the perceptual representation memory system,whereas (A, B) learning likely recruits other memory systems2 . First, several neuropsychological patient groups thatare known to have widespread deficits in other types ofcategory-learning tasks show apparently normal (A, not A)prototype-distortion learning. This includes patients withParkinson’s disease (Reber & Squire, 1999) or schizophrenia (Kéri, Kelemen, Benedek, & Janka, 2001). In addition,several studies have reported that patients with amnesia shownormal (A, not A) prototype-distortion learning (Knowlton& Squire, 1993; Squire & Knowlton, 1995), but impairedperformance in (A, B) tasks (Zaki, Nosofsky, Jessup, & Unverzagt, 2003). Second, Casale and Ashby (2008) reportedthat, at least at low levels of distortion, (A, not A) learningdoes not depend on feedback, whereas feedback is critical to(A, B) learning. Third, neuroimaging studies of (A, not A)prototype-distortion tasks have all reported categorizationrelated changes within occipital cortex (Aizenstein et al.,2000; Reber, Stark, & Squire, 1998a, 1998b). In the onlyknown neuroimaging study of the (A, B) prototype-distortiontask, Seger et al. (2000) also reported categorization-relatedactivation in occipital cortex, but they also found significantlearning-related changes in prefrontal and parietal cortices.Occipital cortex deactivations are often seen in tasks that depend on the perceptual representation memory system (e.g.,Wiggs & Martin, 1998), and these neuroimaging results haveprompted proposals that the perceptual representation memory system is active in prototype distortion tasks (Reber &Squire, 1999). For these reasons, the (A, not A) prototypedistortion task is a good choice if a research goal is to studysome aspect of the perceptual representation memory system.2Here we are relying on the classic partitioning of nondeclarative memory into procedural memory versus the perceptual representation memory system (Schacter, 1990; Squire, 1992). According to this account, procedural learning includes a motor component, requires extended practice with immediate feedback, anddepends heavily on the basal ganglia, whereas repetition primingin the perceptual representation memory system includes no motorcomponent, can be observed after only a single stimulus repetition,and depends primarily on visual areas of cortex.
CATEGORIZATION METHODSStimulus ChoicesAfter deciding what type of category structure to use, thenext choice is to select the stimuli. There are a number ofchoices to make that will affect the nature of the experiment,the type of data analyses that are possible, and the kinds ofinferences that might be made after data analysis is complete.The relevant choices include whether the stimuli are realworld or artificial, constructed from binary- or continuousvalued stimulus dimensions, whether those dimensions areperceptually separable or integral, and how m
Stevens’ Handbook of Experimental Psychology and Cognitive Neuroscience, Fourth Edition, Volume Five: Methodology. New York: Wiley. The Categorization Experiment: Experimental Design and Data Analysis F. Gregory Ashby, Vivian V. Valentin Department of Psychological &