Transcription
Collection Analysis with TableauGABRIELLE WIERSMAH E A D O F C O L L E C T I O N D E V E LO P M E N TUNIVERSITY LIBRARIESU N I V E R S I T Y O F C O LO R A D O B O U L D E RC O LO R A D O A L L I A N C E O F R E S E A R C H L I B R A R I E SLIBRARY ASSESSMENT WORKSHOPNOVEMBER 17, 2016
Collection Analysis-Challenges Collecting and combining various data sources Integrated Library System (ILS)(.txt,.xls API, SQL) Circulation statistics Expenditures fund codes COUNTER usage reports (.xls)Impact Factors (.xlsx) Journal Citation Reports, Scimago (.txt, .xls) Collections Budget (.xls) INN-Reach data Interlibrary Loan Data Presenting quantitative data in a format that is easily understood Publishing data and findings; making data and analyses more accessible
CollectionAnalysis in Excel
What is Data Visualization? Visual representation of abstract data to help: Explore: Identify trends and patterns in data Explain: Understand complex data more easily
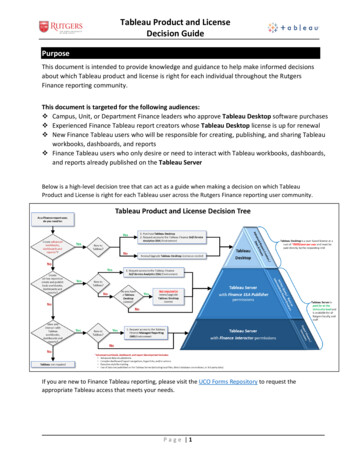
TableauSoftware-DataVisualization
Excel v. Tableau?ExcelTableauCombine multiple data setsManually or using a formula Link and create relationshipslike VLOOKUPbetween data sourcesUpdating dataNew version needs to bemanually uploadedData sources can berefreshedFilters, Slicers, SortYesYesGraphs, chartsYesYesPublishing/DistributionStatic, interactivespreadsheetsDynamic, interactive onlinedashboards
Tableau Software-Connecting DataIntegrate and analyze various data sources: Excel spreadsheets from Elements (facultypublication data) Excel spreadsheets containing library holdings(ILS data) Better yet, connect directly to ILS data using PostgreSQLdatabase (Sierra DNA) Excel spreadsheets exported from citationdatabases such as Web of Science or Scopus
Tableau Dashboards for Collection Analysis Most Cited Journals by Journal Title Most Cited Journals by Department Journals with most articles by CU authors Top Publishers for books and journals Books by CU authors Group by academic department Group by subject librarian Journals with high use, zero use Circulation of approval v. firm orderedbooks
Tableau Dashboards for Collection Analysis Collections Budget Track expenditures by fund, subject, format,resource type Collection Statistics Track collection growth Analyze usage statistics Rate the performance of books within LC ranges, bypublisher, age EXZ Proxy and COUNTER reports for e-resource usage INN-Reach and Interlibrary Loan Data What are we borrowing? In which areas are we borrowing more than weare purchasing? Does this indicate a gap in our collection?
Next Steps-Measuring our Impact Combining collections data with different types of library data Reference Questions Gate CountsPartnering and sharing data with others on campus: Faculty Affairs access to faculty information system and Elements gives us a list of all of our faculty’spublications, courses taught Institutional Research Connect to demographic data about our users, particularly students to connect studentsuccess with use of library resources
Questions?Thank you!Gabrielle WiersmaHead of Collection DevelopmentUniversity LibrariesUniversity of Colorado Bouldergabrielle.wiersma@Colorado.edu
Tableau Dashboards for Collection Analysis Collections Budget Track expenditures by fund, subject, format, resource type Collection Statistics Track collection growth Analyze usage statistics Rate the performance of books within LC ranges, by publisher,
