Transcription
Intermediate Microeconomicswith Microsoft Excel Humberto BarretoProfessor of Economics and ManagementDePauw University20212nd Edition 2020 version 11 November 2021 CC BY SAFirst published in 2009 by Cambridge University Press.
iiThis book was typeset in LATEX with various packages in TeXstudio. I washelped repeatedly by resources at tex.stackexchange.com. I am awed by thissoftware and its community. I offer a deep bow to those who made thesetools freely available and continue to provide support.COPYRIGHT CC BY SA 2020You are free to:Share — copy and redistribute this material in any medium or format.Adapt — remix, transform, and build upon the material for any purpose;such as extracting pages, editing text, or modifying this pdf and/or Excelfiles however you wish.I cannot revoke these freedoms as long as you follow the license terms below:Attribution — You must give me appropriate credit, provide a link tothis book (you can use www.depauw.edu/learn/microexcel), and indicate ifchanges were made. You may do so in any reasonable manner, but not inany way that suggests that I endorse you or your use.ShareAlike — If you remix, transform, or build upon the material, youmust distribute your contributions under this same license.No additional restrictions — You may not apply legal terms or technologicalmeasures that legally restrict others from doing anything the license permits.
iiiACKNOWLEDGMENTSThis book would not have been possible without the help of many people,but four especially stand out: Frank Howland, Kealoha Widdows, MicheleVillinski, and Tami Barreto. Thank you.I team-taught several courses with Frank and Kay so it is not surprisingthat their imprint, including examples, phrasing, and pedagogical strategyare embedded in this book. They caught mistakes, gave me ideas, and profoundly influenced my thinking about the best way to teach economics.Michele sat in on my Intermediate Micro class in the Spring of 2019. Shewould occasionally give me tips and make suggestions to improve the presentation. I kept a running list and included them in this edition.Tami copy edited this manuscript, like almost everything else I have written.Her attention to detail and drive for perfection have improved the expositionimmensely.
ivTo all of my DePauw and Wabash students.Really, it has been my pleasure.
ContentsPrefaceixUser GuidexiiiA First StepxixIConsumer Behavior11 Budget Constraint52 Satisfaction132.1 Preferences . . . . . . . . . . . . . . . . . . . . . . . . . . . . 152.2 Utility Functions . . . . . . . . . . . . . . . . . . . . . . . . . 293 Optimal Choice3.1 Initial Solution . . . . . . . . . .3.2 More Practice and Understanding3.3 Food Stamps . . . . . . . . . . .3.4 Cigarette Taxes . . . . . . . . . . . . .Solver. . . . . . .4 Comparative Statics4.1 Engel Curves . . . . . . . . . . . . .4.2 More Practice with Engel Curves . .4.3 Deriving a Demand Curve . . . . . .4.4 More Practice with Deriving Demand4.5 Giffen Goods . . . . . . . . . . . . .4.6 Income and Substitution Effects . . .4.7 More Practice with IE and SE . . . .4.8 A Tax-Rebate Proposal . . . . . . . .v.4143597389.103. 105. 121. 129. 141. 149. 159. 175. 183
viCONTENTS5 Endowment Models5.1 Introduction to the Endowment Model5.2 Intertemporal Consumer Choice . . . .5.3 An Economic Analysis of Charity . . .5.4 An Economic Analysis of Insurance . .191. 193. 207. 221. 2356 Bads2476.1 Risk Versus Return . . . . . . . . . . . . . . . . . . . . . . . . 2496.2 Automobile Safety Regulation . . . . . . . . . . . . . . . . . . 2636.3 Labor Supply . . . . . . . . . . . . . . . . . . . . . . . . . . . 2757 Search Theory2917.1 Fixed Sample Search . . . . . . . . . . . . . . . . . . . . . . . 2937.2 Sequential Search . . . . . . . . . . . . . . . . . . . . . . . . . 3058 Behavioral Economics3159 Rational Addiction327IIThe Firm33110 Production Function11 Input Cost Minimization11.1 Initial Solution . . . . . . .11.2 The Enfield Arsenal . . . . .11.3 Deriving the Cost Function11.4 Cost Curves . . . . . . . . .337.351. 353. 365. 383. 39712 Output Profit Maximization41312.1 Initial Solution . . . . . . . . . . . . . . . . . . . . . . . . . . 41512.2 Deriving the Supply Curve . . . . . . . . . . . . . . . . . . . . 43112.3 Diffusion and Technical Change . . . . . . . . . . . . . . . . . 44113 Input Profit Maximization45713.1 Initial Solution . . . . . . . . . . . . . . . . . . . . . . . . . . 45913.2 Deriving Demand for Labor . . . . . . . . . . . . . . . . . . . 47114 Consistency48515 Monopoly495
CONTENTSvii16 Game TheoryIII513The Market System17 Partial Equilibrium17.1 Supply and Demand . . . . . . . .17.2 Consumers’ and Producers’ Surplus17.3 Tax Incidence and Deadweight Loss17.4 Inefficiency of Monopoly . . . . . .17.5 Sugar Quota . . . . . . . . . . . . .17.6 Externality . . . . . . . . . . . . .17.7 Cartels and Deadweight Loss . . . .17.8 Signaling Theory . . . . . . . . . .529.18 General Equilibrium18.1 The Edgeworth Box . . . . . . . . . . .18.2 General Equilibrium Market Allocation18.3 Pareto Optimality . . . . . . . . . . . .18.4 General Equilibrium Monopoly . . . .IVConclusion.541. 543. 561. 579. 595. 613. 627. 643. 663.679. 681. 691. 703. 717725
PrefaceThis is the second edition of a book that was originally published in 2009 byCambridge University Press. While the core of the book remains the same,this edition refreshes all of the screenshots based on Excel 2019 and updatesthe data used in real-world applications. It also fixes typos and mistakes.Finally, it includes a new chapter on rational addiction and offers severalnew optimization problem examples.The preface of the first edition said:In the competitive world of textbooks, different is definitely bad.Authors and publishers, like politicians, stay in the safe middle.Straying too far from the herd is almost a sure way to fail. Fearis strong, but it apparently can be overcome—after all, you arereading a spectacularly unconventional textbook.The most obvious difference between this book and the usualfare is the use of Microsoft Excel to teach economic theory. Thisenables students to acquire a great deal of sophisticated, advancedExcel skills while learning economics. No other book does this.The use of Excel drives other differences. Excel requires concrete,numerical problems instead of the abstract functions and graphsused by other books. Excel’s Solver makes possible presentationof numerical methods for solving optimization problems and equilibrium models. No other book does this.Because numerical solutions are readily available, this book isable to present and explain analytical methods that have beenpushed to appendixes or completely ignored in mainstream texts.Every problem is solved twice—once with Excel and once withequations, algebra, and, when needed, calculus. No other bookdoes this.ix
xPREFACEFinally, this book is organized differently. It explicitly repeats asingle central methodology, the economic approach, so studentslearn how economists think and how to think like an economist.Other books try to do this, but none brings the economic way ofthinking explicitly to the surface, repeating the message in everyapplication.I wrote this book because I learned Visual Basic and quicklyrealized that enhancing a spreadsheet with macros made possiblea whole new way of teaching economics. When my students lovedthis approach, I wanted to share it with others.Because this book is so different, it will probably not challengethe top sellers. It will be the unusual professor who is willingto try something this new. It requires that the professor careenough about students and teaching to invest time and energy inmastering the material. Of course, I think the rate of return isquite high. My hope is that, though few in number, a committed,enthusiastic core of adopters will enable this book to survive.Thank you for trying this unique entry into the competitive market for micro theory textbooks. I hope you find that the rewardwas worth the risk.Well, after more than ten years, I can safely say that I certainly was rightthat the book would not challenge the top sellers! It strayed far from theherd and went largely unnoticed. When I asked Cambridge University Pressto do a second edition, they politely declined.But, I am not giving up. I believe that teaching economics via Excel is awinner. So, I am ignoring the market, producing my own second edition, andgiving it away for free.I am well aware that this edition will not attract many adopters and that Iam engaged in a quixotic fight against foes who are not even aware of mypresence. I remain baffled at how badly microeconomics is taught—it is asif computers were never invented. We can and must do better. I will keepthis book alive in case someone wants to try a novel, innovative approach toteaching and learning microeconomics.
xiThis edition assumes that many will read it electronically, although you arefree to print it out and I am so old school that I certainly would prefer handwriting notes and underlining on paper. Any print shop can do this and,if anyone asks, explain that this is an open access book and you have legalright to print it. You can also print it online at sites such as www.lulu.com/.I think Adobe Acrobat Reader is a good choice if you decide to read it onscreen, but you are, of course, welcome to use your favorite eReader. Hereis a list of 15 pdf readers: e advantage of digital access is that links are highlighted for easy clicking.You should use your pdf reader’s commenting capabilities to highlight, search(ctrl-f), and take notes. It should also be easy to look up words you do notknow or search for ideas that pique your interest so take full advantage ofthe electronic tools at your disposal.I have been teaching economics for a long time now. I am positive that using Excel to learn how economists use models and see the world works foralmost all students. You can learn a lot of economics, math, and Excel whileworking with this book. Do your best and good luck!Humberto Barretohbarreto@depauw.eduGreencastle, IndianaNovember 11, 2021
The idea for the electronicspreadsheet came to me while I wasa student at the Harvard BusinessSchool, working on my MBAdegree, in the spring of 1978.Dan BricklinUser GuideThis book is essentially a manual for how to actively work with and manipulate the material in Excel. This user guide lists minimum requirements,provides instructions for downloading all of the materials and software, offersa few tips before you begin, and describes the organization of the files.Minimum Requirements; This book presumes that you have access to and a basic knowledge of Excel.In other words, you can open an Excel file (called a workbook ), write a formula that adds cells together, make a chart, and save the file. As you will see,however, Excel is much more than a simple adding machine. You will learnhow to use Excel in a more advanced way. In addition to analyzing data andlearning many new Excel functions, you will solve optimization problems withan add-in (a special file that extends the functionality of Excel) called Solver.The materials in this book will work on any Windows Excel version all theway back to 1997 (version 8). The screenshots are based on Excel 2019, butif you are using an earlier version, it should be easy to figure out what to do.The workbooks and add-ins are optimized for use with Windows Excel. Theycan be accessed with a Macintosh computer, but Solver in Mac Excel is temperamental and buggy. Furthermore, Visual Basic (Excel’s macro language)on a Mac is limited so not all macros work. The best solution for Mac usersis to emulate Windows with software such as Parallels or Boot Camp. Forstudents at an educational institution, accessing Excel from a server (see,for example, VMWare’s Horizon software) is an easy solution for Mac users.Desktops.depauw.edu gives my students access to a Windows machine running Excel configured with necessary add-ins.To ensure that older versions of Excel can open the files, all workbooks havebeen saved in “compatibility mode” (Excel 97 – 2003 Workbook) with thexiii
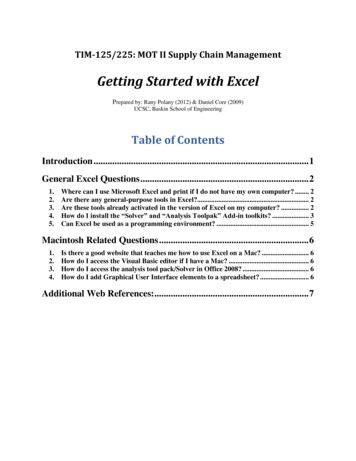
xivUSER GUIDE.xls filename extension. If you are using Excel 2007 (version 12) or greater,you should save your completed files in the “Excel macro-enabled workbook”format, which carries the .xlsm extension. Do not save your files as an Excelworkbook with the .xlsx extension, the macros will not be saved and functionality will be lost.For non-English versions of Excel, the files will work in the sense that buttons, scroll bars, and macros will function; however, the add-ins and othercontent will not be translated.Recently, Microsoft Office has moved online, offering OneDrive and Office 365cloud access. Regrettably, as of this writing, because of security concerns,online versions of Office do not support Visual Basic, a limitation whichrenders these options useless for working with macro-enhanced files fromwithin a web browser. You can save a file with macros in your favoritestorage area in the cloud, but you will need to download and open it with adesktop Excel version to run the macros. Within a browser, macros cannotbe executed.Downloading and Opening WorkbooksVisit www.depauw.edu/learn/microexcel to download the files that accompany this book. You may download individual files as needed or a compressed archive with all of the files to as many different computers or devicesas needed.Figure 1 shows that, when opening a workbook with macros, Excel will alertyou to their presence with a security warning under the Ribbon (and rightabove the formula bar).Figure 1: Enable Content when opening a Micro Excel workbook.
xvIf you do not see the security warning or have no opportunity to enable content, your security level has been set to block all files with macros. Althoughmalicious code can be harmful, you must dial down the safety measures toallow Excel to utilize fully the information in the workbook. Close the fileand change the security setting to allow Excel to open files with macros.Visit Excel’s main support page at support.office.com for more help on setting security and enabling macros.Tips and ConventionsIn this book, a figure refers to a variety of graphics, including charts andpictures of portions of a sheet (also known as a screenshot, like Figure 1). Achart or range of cells is often displayed in this printed book as a figure, butyou should look at the live version on your computer screen. Thus, in addition to a caption, many figures have a source line indicating their location inthe Excel workbook.The book follows Excel’s naming convention for workbooks, sheets, and cells:[workbookname]sheetname!cell address. If the caption of a figure says, [FoodStamp.xls]BudgetConstraint, then you know the figure can be found in theFoodStamp.xls workbook in the BudgetConstraint sheet. Note that workbook and sheet names in the printed text are italicized to help you locatethe proper sheet in a workbook. [RiskReturn.xls]OptimalChoice!B6 refers tocell B6 in the OptimalChoice sheet of the RiskReturn.xls workbook.You may need to adjust your display or the objects in Excel. Use the Zoombutton to magnify the display. You can also right-click objects such as buttons or scroll bars to select and move them. Once you open a workbook, youcan save it to another location or name (by executing File Save As.) andmake whatever changes you wish. This is the same as underlining or writingin a conventional, printed book.Finally, if something is not working the way you expect, there are manypossible causes. It is always a good idea to close Excel completely and reopenit. Even if this does not fix the problem, slowly repeating the steps will helpyou debug or describe what is happening.
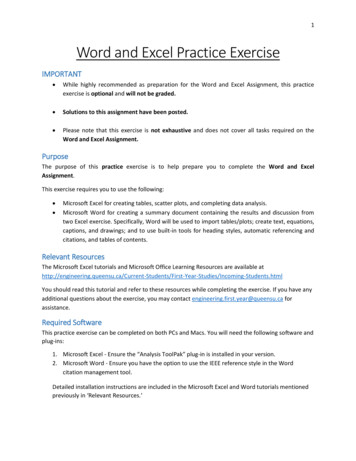
xviUSER GUIDEOrganization of FilesFigure 2 shows the contents of all materials included in the MicroExcel.ziparchive, after downloading it from www.depauw.edu/learn/microexcel.Figure 2: Organization of files.The Answers folder contains answers to questions posed in Q&A sheets ineach Excel workbook. Think of the Q&A material in the Excel workbooksas self-study questions.There are also Exercises at the end of each chapter. Readers do not haveeasy access to the answers to the exercise questions. To see these answers, youmust be an instructor and register online at www.depauw.edu/learn/microexcel.The SolverCompStaticsWizard folder contains files that use the Comparative Statics Wizard Excel add-in. When used in conjunction with Excel’sown Solver add-in, these files enable numerical comparative statics analysisof optimization problems and equilibrium models.Active LearningThe most important thing you can do as you read this book is experiment.You might find yourself wondering, “What would happen if this cell was 10instead of 1?” Do not just wonder, change the cell and see what happens!There is deep neuroscience at work here. When you are in control and making up your own questions, you learn best. The beauty of this approach isthat everything is alive and you can make points move and lines shift. Takefull advantage.Remember that you can always download the original workbook again ifneeded. This means you should not worry about changing anything in a
xviiworkbook. If something goes terribly wrong, simply delete it and downloadit again.There are many books devoted to microeconomics. This one is different because it is not meant to be simply read. A great deal of its value lies in theExcel workbooks and additional materials. By reading this book and working in Excel simultaneously, you will become a sophisticated user of Exceland learn a great deal of mathematics and, most importantly, economics.Download the files from www.depauw.edu/learn/microexcel and get to work!Spreadsheet History and ResourcesFor more on the history of the electronic spreadsheet, as told by one of thecreators, see bricklin.com/visicalc.htm. This is the source for the epigraph.I recommend these websites for Excel tips and tricks, workbook and add-indownloads, and Visual Basic code snippets: Tushar Mehta: www.tushar-mehta.com/excel/ Chip Pearson: www.cpearson.com/excel Jon Peltier: peltiertech.com/Excel/ Andy Pope: www.andypope.info
Economics is the science whichstudies human behavior as arelationship between given endsand scarce means which havealternative uses.Lionel RobbinsA First StepEconomists see the world through a special pair of glasses. It takes practiceand concentration to learn how to see things like an economist. The interpretation of reality that is the hallmark of modern economics has been calledthe economic way of thinking, the economic approach, and the method ofeconomics. Thinking and seeing the world like an economist is the ultimategoal of this book.You will learn the economic way of thinking by working through many examples. Here is the first one.Optimal Allocation of Worker HoursSuppose that you manage a tech support service for a major software company. You have two types of callers: Regular and Preferred. Your preferredcustomers have paid extra money for faster access, which means they expectto spend less time waiting on hold. There are equal numbers of the two typesof customers and they call with equal frequency.Management has given you a fixed number of worker hours per day to answer calls from users needing help. Daily, you have 10 workers, each working8-hour shifts, and 5 part-time workers (4-hour shifts each); or 100 hours perday in total to support customers calling for help. These 100 hours compriseyour Total Resources.When customers call, an automatic message is played asking the caller toinput an ID number and the caller is put on hold. The ID number is used toidentify the caller as a regular or preferred customer.Keeping callers on hold creates frustrated, unhappy customers. The callersare already angry since something has gone wrong with the software andxix
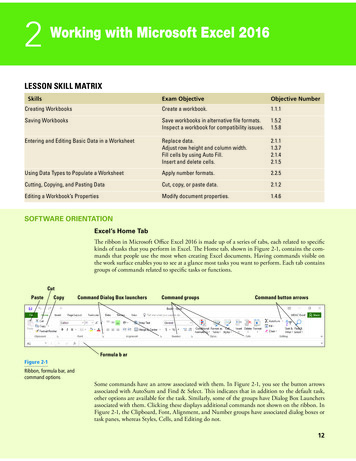
xxA FIRST STEPthey need help. The faster you get support to the caller the better. Youkeep track of time waiting (the amount of time, in seconds, that the typicalcaller is on hold) and you know that it depends on the number of workerhours available to answer the calls.To keep things simple, assume typical time waiting 6000/worker hoursallocated. So, say there are 80 worker hours available to answer preferredcallers. Dividing 6000 by 80 yields 75, which means the typical hold time is75 seconds. This leaves 20 worker hours for regular callers, so their hold timeis 300 seconds (since 6000/20 300). Five minutes is a long time to wait onthe phone!The problem becomes an economic problem because you have two types ofcallers, so you must decide how to allocate your worker hours. When youhave to make a decision where you trade-off one thing for another you aredoing economics. In this case, the more hours you allocate to one type ofcaller, the lower that caller’s wait time. That’s the good news.The bad news is that the fixed amount of caller-support hours means thatmore time devoted to one type of caller results, by definition, in fewer hoursto the other type and, therefore, higher waiting times for the other type.So the general structure of the problem is clear: You must decide how to allocate scarce support resources (worker hours) to two competing ends. Figure3 shows a simplified picture of the problem.Figure 3: Allocating a scarce resource to two competing ends.
xxiA ComplicationIt is unclear exactly what preferred customers expect. Do they expect to gethelp twice as fast or 10 times as fast as regular customers?To incorporate the fact that the preferred customer merits greater attention,management gives you a value weight parameter. The value weight tells youhow much more valuable the preferred caller is compared to the regular caller.We can write the objective function asT otalT imeW aiting 60006000 V alueW eightRegHoursP ref HoursThe objective function says that time spent waiting by a preferred caller ismultiplied by a factor that reflects how much more we value the preferredcustomer’s time. If ValueWeight 1, then preferred and regular callers areequally valuable. Management has decreed that preferred customers’ timeis worth twice that of regular customers so ValueWeight 2; you (the callcenter manager) cannot change this parameter.So, if you decide to allocate 50 hours each to the regular and preferred customers, then both types of customers will wait 6000/50 120 seconds andour objective function will be 120 2 x 120 360 seconds.Is there a better allocation, one that yields a smaller total time waiting (adjusted with the value weight), than 50/50? This question, how to allocate100 worker hours to answering calls from regular and preferred customers inorder to minimize value weighted total time waiting, has an answer, calledthe optimal solution. We have to find it.Setting Up the ProblemWe will solve this problem by first organizing the information into three separate parts. All optimization problems can be set up the same way, withthree components: goal, endogenous variables, and exogenous variables.The goal is synonymous with the objective function. Endogenous, or choice,variables can be controlled by the decision maker. Exogenous variables are
xxiiA FIRST STEPgiven, fixed constants that cannot be changed by the decision maker. Theexogenous variables (sometimes called parameters or independent variables)form the environment under which the decision maker acts.In the tech support time minimization problem, we can organize the information like this:1. Goal: minimize total time waiting (value weighted)2. Endogenous variables: worker hours allocated to preferred and regularcustomers3. Exogenous variables: total worker hours and value weightSTEP Open the Excel workbook Introduction.xls, read the Intro sheet,and then go to the SetUp sheet to implement the problem in Excel.This workbook (along with all of the files that accompany this book) is available for download at www.depauw.edu/learn/microexcel. The User Guidehas detailed instructions on how to properly configure Excel before downloading and opening these files.Make sure that you enable macros when you open the file. If the buttons donot work, the most likely suspect is in the security settings.STEPAnswer the three questions in column A (below the exogenousvariables). Check yourself by clicking the See Answer buttons.Finding the Initial SolutionNow that we have set up the problem, we can turn our attention to findingthe answer, the optimal solution. There are two ways to solve optimizationproblems: Analytical (algebra and calculus) methods Numerical (computer) methodsThe analytical method uses pencil and paper to write down equations andmanipulate them to find the answer. It was the only way available until computers came along and gave us algorithms for finding solutions. Numerical
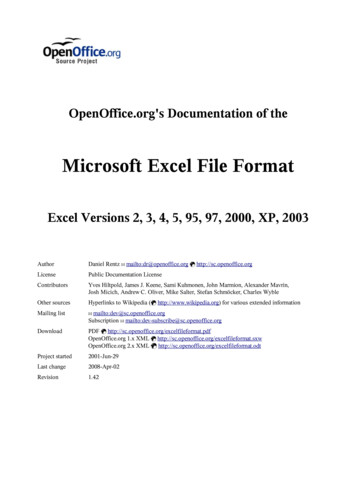
xxiiimethods rely on testing many trial solutions very quickly and repetitively,converging to the answer. We will ignore the analytical approach in thisexample and concentrate on showing how Excel’s Solver works.STEPClick the Data tab (in the Ribbon across the top of the screen),then Solver (in the Analysis group) to bring up the Solver dialog box (as inFigure 4). If Solver is not available, then use the Add-in Manager to installit. Use Excel’s Help if you are having trouble or visit support.office.com.Figure 4: The Solver dialog box.Note that necessary information is already entered. The objective cell is the(value weighted) total time waiting, the changing variable cells (the endogenous variables) are the worker hours devoted to the regular and preferredcustomers, and the constraint is that the sum of the worker hours not exceedthe 100 hours you have been given.STEP Click theSolve button to find the solution to the problem. Clickthe OK button in the Solver Results dialog box to accept Solver’s solutionand put the optimal solution in the SetUp sheet.
xxivA FIRST STEPCongratulations! You, the call center manager, have just used Solver (a numerical methods approach to optimization) to optimally allocate your scarceresources. We can check Solver’s answer for plausibility, noting that it makessense that preferred callers have more hours allocated to them because theyare more valuable. Later, we will see that we can solve this problem usinganalytical methods and if the two approaches give the same answer, we canbe confident that we do indeed have the best solution.Comparative StaticsWe have found the initial solution, but we are usually much more interestedin a follow up question: How will the optimal solution change if the environment changes?Comparative statics is a shorthand way of describing the following procedure:Change an exogenous variable, holding the other parameters constant, andtrack how the optimal solution changes in response to the shock.Like finding the initial solution, comparative statics can be done via analytical (algebra and calculus) and numerical (computer) methods. The Comparative Statics Wizard (CSWiz) add-in was used to explore how the optimalallocation of total worker hours would change if worker hours were increasedby 10 hours. The CSWiz add-in will be introduced later and you will learnhow to do your own comparative statics analyses. For now, we will focus onwhat it produces.STEP See the results of the comparative statics analysis by going to theCS1 sheet.Cells A1:D15 in the CS1 sheet were produced by the CSWiz add-in. It iseasy to see that increased total worker hours are allocated to regular and preferred customers in a stable pattern. Every additional hour of total resources,holding value weight (the only other exogenous variable in this simple problem) constant, produces an increase of 0.586 hours allocated to preferredcustomers. The chart below the data (row 16) shows the linear relationship.Usually, economists want to determine the relationship between optimal endogenous and exogenous variables.
xxvSummary: Introducing OptimizationThis chapter used an example to show how Excel’s Solver can find the optimalsolution. It introduced the basics of optimization, including the three partsof every optimization problem:1. Goal (or objective function),2. Endogenous variables,3. Exogenous variables.As you work with this book, you will learn how to use analytical methodsto solve optimization problems. You will also learn how to do comparativestatics analysis via analytical and numerical methods.This introductory example was completely prepared for you. All you had todo was click a few buttons. Future problems will gradually relax the Excelenvironment, giving you ever more freedom to make decisions and therebylearn what to do. The ultimate goal is for you to be able to set up and solveproblems yourself.Exercises1. Suppose Management decides that preferred customers are three timesas important as regular customers, so that the ValueWeight 3. With100 workers hours, what is the optimal solution? Describe your procedure and report the optimal values of PrefHours and RegHours.2. Compared to the initial solution, when ValueWeight 2, what is thechange in the number of hours allocated to preferred customers?3. The percentage change in ValueWeight is 50% (from 2 to 3). What isthe percentage change in the number of hours allocated to preferredcustomers?ReferencesEach section ends with references and resources for further study. A citationfor the epigraph (lead quotation) of the chapter is provided. References maya
Excel skills while learning economics. No other book does this. The use of Excel drives other di erences. Excel requires concrete, numerical problems instead of the abstract functions and graphs used by other books. Excel’s Solver makes possible presentation of numerical methods f