Transcription
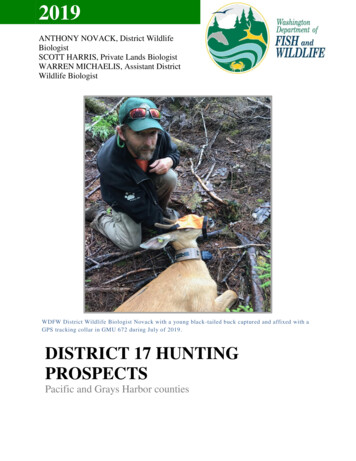
2019ANTHONY NOVACK, District WildlifeBiologistSCOTT HARRIS, Private Lands BiologistWARREN MICHAELIS, Assistant DistrictWildlife BiologistWDFW District Wildlife Biologist Novack with a young black-tailed buck captured and affixed with aGPS tracking collar in GMU 672 during July of 2019 .DISTRICT 17 HUNTINGPROSPECTSPacific and Grays Harbor counties
TABLE OF CONTENTSDISTRICT 17 GENERAL OVERVIEW .2ELK .3Summary . 3General Information, Management Goals, and Population Status .4Which GMU Should Elk Hunters Hunt? .5What to Expect During the 2019 Season .7How to Find Elk . 11Elk Areas . 12Notable Hunting Changes . 12ELK HOOF DISEASE (Treponeme bacteria) . 13DEER. 14Summary . 14General Information, Management Goals, and Population Status . 14Which GMU Should Deer Hunters Hunt? . 15What to Expect During the 2018 Season . 18How to Find and Hunt Black-Tails . 20Notable Hunting Changes . 21BEAR . 22General Information, Management Goals, and Population Status . 22What to Expect During the 2019 Season . 22How to Find Black Bear . 23Notable Changes . 24COUGAR . 25General Information, Management Goals, and Population Status . 25What to Expect During the 2019 Season . 26Notable Changes . 26
DUCKS. 27Common Species . 27Migration Chronology . 27Concentration Areas. 28Population Status . 28Harvest Trends and 2019 Prospects . 28Hunting Techniques . 29Public Land Opportunities . 30GEESE. 30Common Species . 30Migration Chronology and Concentration Areas . 31Population Status . 31Harvest Trends and 2019 Prospects . 31Hunting Techniques . 33Special Regulations . 34Public Land Opportunities . 34Notable Hunting Changes . 35FOREST GROUSE . 35Species and General Habitat Characteristics . 35Population Status . 35Harvest Trends and 2018 Prospects . 36Hunting Techniques and Where To Hunt . 36PHEASANTS . 38QUAIL. 38TURKEYS . 38BAND-TAILED PIGEONS . 39General Description . 39Population Status and Trend . 39
Harvest Trends and 2018 Prospects . 39Where and How To Hunt Band-Tailed Pigeons. 39Special Regulations . 40Upcoming Research . 40OTHER SMALL GAME SPECIES . 40MAJOR PUBLIC LANDS . 41PRIVATE INDUSTRIAL FORESTLANDS . 43General Information . 43Important Notes About Access for the 2019 season . 43Basic Access Rules . 46General Overview of Access Allowed by Major Timber Companies and Non-Profit organizations . 46Heads Up For Archery and Muzzleloader Hunters . 47General Description of the “Dot” System . 47Contact information For Major Timber Companies . 48GENERAL OVERVIEW OF HUNTER ACCESS IN EACH GMU . 48PRIVATE LANDS ACCESS PROGRAM . 52ONLINE TOOLS AND MAPS . 52
DISTRICT 17 GENERAL OVERVIEWAdministratively, District 17 includes all of Pacific and Grays Harbor counties and is one of fourmanagement districts (11, 15, 16, and 17) that collectively comprise the Washington Departmentof Fish and Wildlife’s (WDFW) Region 6 (see map). The northern portion of District 17 (northof Highway 12) includes the southwestern portion of the Olympic Mountains while the southernpart of the district is situated in the Willapa Hills.District 17 is located in southwest Washington and consists of 12 Game Management Units(GMUs): 638 (Quinault Ridge), 648 (Wynoochee), 660 (Minot Peak), 672 (Fall River), 681(Bear River), 699 (Long Island), 618 (Matheny), 642 (Copalis), 658 (North River), 663 (CapitalPeak), 673 (Williams Creek), 684 (Long Beach).Four administrative districts and their associated GMUs within WDFW Region 62 P a g e
The landscape in District 17 is dominated by intensely managed industrial forest landcharacterized by second and third growth forests. These lands are primarily dedicated toproducing conifers such as Douglas fir, western hemlock, and occasionally cedar. A smallnumber of stands focus production on red alder. Other habitats in the district range from subalpine habitat in areas adjacent to Olympic National Park to coastal wetlands along the outercoast.District 17 is best known for elk hunting opportunities in the Willapa Hills and waterfowlhunting opportunities around Willapa Bay, Grays Harbor, and in the Chehalis and Willapa Rivervalleys. High quality hunting opportunities exist for other game species, including black-taileddeer, black bear, and forest grouse. The following table shows the estimated harvest for mostgame species in District 17 during the 2014-2018 seasons. For more specific information onharvest trends, please refer to the appropriate section in this document.Table 1. Total hunter harvest for selected game species during previous 5 years in District 17.* Cougar harvest may include animals from adjacent GMU’s 636 and 651.ǂ Late season goose not included for 2018 due to changes in reporting se (late season)Geese (early season)Forest UMMARYSuccess Rates: Ranges widely depending on weapon type, GMU, and land access.Recent Trends: Stable harvest and hunter effort. Protracted decline in modern firearm elkhunters.3 P a g e
GMUs with Highest Elk harvest in rank order: GMU 673 then 672. Followed by 658 and681GENERAL INFORMATION, MANAGEMENT GOALS, AND POPULATIONSTATUSThe subspecies of elk in District 17 are Roosevelt elk. Unlike other areas in western Washington,Rocky Mountain elk were never introduced into the area and Roosevelt-Rocky Mountain elkhybrids do not occur. The state of Washington contains 10 distinct elk herds. A portion of twoelk herds occur in District 17: Olympic elk herd (GMUs 618, 638, 642, and 648) Willapa Hills elk herd (GMUs 658, 660, 663, 672, 673, 681, 684, and 699).The quality of elk hunting in District 17 varies from marginal to excellent depending on theGMU. The greatest harvest opportunities occur in GMUs associated with the Willapa Hills elkherd area, specifically GMUs 658, 672, 673, and 681.In Washington, elk are managed at the herd level, while harvest regulations are set at the GMUlevel. In general, each herd occupies several GMUs that collectively define the range of apopulation that minimizes interchange with adjacent elk populations.Overall, District 17 is managed with the primary goal of promoting stable or increasing elkherds. To meet that goal, our specific objective is to maintain herds at a minimum ratio of 15bulls to 100 cows in the pre-hunting season population and a minimum of 12 bulls to 100 cowsin the post-season population. Portions of the district (such as GMU 684) must balance overallherd objectives with the equally important mission to minimize conflicts with people. Elk cancause severe impacts to crops such as hay or cranberries.Currently, WDFW does not use formal estimates or indices of population size to monitor elkpopulations across the entire district. Trends in harvest, hunter success, and harvest per uniteffort are used as surrogates to formal indices or estimates. These surrogates have limitationswhen applied to monitoring trends in population size. Consequently, the agency developed amore detailed monitoring strategy specifically for the Willapa Hills elk herd to: Determine elk population trends Quantify cow to calf ratios Quantify bull to cow ratiosWDFW conducted surveys during March of 2019 in the northern half of the Willapa Hills Elkherd area, specifically portions of GMUs 658, 660, 672 and 501. We observed 889 elk during the2019 survey. Observed bull to cow ratios averaged 23 bulls per 100 cows. This 23:100 statisticis well above the 12 bulls per 100 cow minimum that WDFW uses to benchmark breedingsuccess. Calf to cow ratios measured 45 calves per 100 cows. This calf ratio indicates good elkproduction. Mature bulls, carrying antlers with five points or more, were uncommon ( 10percent of total). Both calf to cow and bull to cow ratios for the Willapa Hills herd area areexceptionally robust, indicating a highly productive herd with great harvest opportunities.4 P a g e
Hunters with a primary goal of finding a trophy bull are more likely to find success lookingoutside the Willapa Hills area and into the neighboring Olympic or St. Helens elk herds.All harvest data indicates that elk populations are stable or increasing in District 17. For moredetailed information related to the status of Washington’s elk herds, hunters should read throughthe most recent version of the Game Status and Trend Report, which is available for downloadon the department’s website or by clicking here.WHICH GMU SHOULD ELK HUNTERS HUNT?Probably the most frequent question the department gets from hunters is, “Which GMU should Ihunt?” The answer depends on the hunting method and the target hunting experience. Forexample, GMU 699 is a small unit closed to both modern and muzzleloader hunters. Anotherexample is that archery hunters are not allowed to harvest antlerless elk in every GMU.Some hunters are looking for an opportunity to harvest a mature bull. Large mature bulls arefound in District 17, but they are not very abundant. WDFW directs hunters seeking mature bullsto spend their efforts in either the Quinault Ridge (638) Matheny (618) or adjacent Clearwater(615) GMUs. All three GMUs are adjacent to Olympic National Park (ONP), and have thereputation of producing some very nice bulls. The best success for five-point or better bulls isgarnered by the September rifle permit hunters in either the Quinault Ridge (638) or Matheny(618) GMUs.The ideal GMU for most hunters would have high densities of elk, low hunter densities, and highhunter success rates. Unfortunately, this scenario does not readily exist in any GMU open duringthe general modern firearm, archery, or muzzleloader seasons in District 17. Those GMUs withthe highest elk densities tend to have the highest hunter densities as well. For many hunters, highhunter densities are not enough to persuade them not to hunt in a GMU where they see lots ofelk. For other hunters, they would prefer to hunt in areas with moderate to low numbers of elk ifthat means there are also very few hunters. Note that many industrial timber companies havebegun limiting access or charging a fee to access their land. This change has effectively, andsometimes dramatically, reduced the density of hunters on those lands.The information provided in Tables 2, 3, and 4 provides a general assessment of how District 17GMUs compare with regard to harvest, hunter numbers, and hunter success during generalmodern firearm, archery, and muzzleloader seasons. The values presented are the five-yearaverages for each statistic. Total harvest and hunter numbers were further summarized by thenumber of elk harvested and hunters per square mile.Comparing total harvest or hunter numbers is not always a fair comparison since GMUs vary insize. For example, the average number of elk harvested in a five-year period from 2009-2013during the general modern firearm season in GMUs 681 and 673 was 36 and 116 elk,respectively. That total harvest may seem to indicate much higher density of elk in GMU 673compared to GMU 681. However, examining the number of elk harvested per square mile5 P a g e
(harvested/mi²) provides an estimate of 0.436 harvested/mi2 in GMU 673 and 0.330harvested/mi2 in GMU 681. Expressed as the number of elk harvested per mile, elk numbers areprobably more similar between the two GMUs than total harvest indicates.Each GMU was ranked from 1 to 11 for elk harvested/mi2 (bulls and cows), hunters/mi2, andhunter success rates for the 2009-2013 season. Three ranking values were summed to produce afinal rank sum. GMUs are listed in order of least rank sum to largest. The modern firearmcomparisons are the most straightforward because bag limits and seasons are the same in eachGMU.Archers should consider that antlerless elk seasons are not uniform across all GMUs. Antlerlesselk may be harvested during the general season in six GMUs, and three GMUs are open duringearly and late archery seasons. These differences are important when comparing total harvest orhunter numbers among GMUs. Muzzleloader seasons are not uniform either. Some muzzleloaderseasons are open during the early muzzleloader season, while others are only available during thelate muzzleloader season. Hunters should keep these differences in mind when interpreting theinformation provided in Tables 2 through 4.Table 2. Comparison of modern firearm general elk season total harvest, hunter numbers, and huntersuccess rates using rank sum analysis. Data presented are based on a five-year running average (20092013).MODERN FIREARMHarvestHunter DensityHunter SuccessGMUSize(mi2)TotalHarvestper mi2RankHuntersHuntersper 020.01010640.3023%1022648431170.03984160.9764%9236 P a g e
Table 3. Comparison of muzzleloader general elk season total harvest, hunter numbers, and huntersuccess rates using rank sum analysis. Data presented are based on a five-year running average (20092013). GMU 684 is in bold and open during both early and late season for any elk.* Note: Muzzleloader seasons were recently opened for the 2014 seasons in units 648, 673, 681.MUZZLELOADERHarvestHunter DensityHunter SuccessSize(mi2)TotalHarvest permi2RankHuntersHunters 612%715GMUTable 4. Comparison of archery general elk season total harvest, hunter numbers, and hunter successrates using rank sum analysis. Data presented are based on a five-year running average (2009-2013).GMU 684 is in bold and open during both early and late archery*GMUs with 3-point minimum or antlerless harvest restrictionsARCHERYGMU658Size(mi2)257HarvestTota Harvest perlmi2160.062Rank5Hunter DensityHunters perHunters mi21110.43673*26679699*8681*638672*684*Hunter 1124648431160.03782830.6676%1025WHAT TO EXPECT DURING THE 2019 SEASONElk populations do not vary much from year to year, especially in District 17, which lacks thesevere winter weather conditions that might result in a winter die-off. Consequently, the numberof elk available for harvest is expected to be similar in size to the 2018 season. Elk harvestappeared to be higher in 2018 compared to prior years so, a slight decline in elk harvest wouldn’t7 P a g e
be unexpected. Hunter numbers do not typically change much from one year to the next, butrecent actions by private timber companies to charge for access have reduced hunter numbers inthose areas affected.Weather can be dramatically different from year to year, and has the potential to influenceharvest rates. As an example, 2012 was a hot and dry summer by western Washington standards,which produced extreme fire danger warnings and caused many timber companies to close theirlands to public access during the latter part of the general early archery season and the entireearly muzzleloader season. Since WDFW is not able to predict long-term weather events, thebest predictor of future harvest during general seasons is recent trends in harvest, hunternumbers, and hunter success.Below (Figures 1-6) are detailed charts on historic elk harvest for District 17. These figures areintended to provide hunters with the following information to make an informed decision onwhere to hunt.A. Historic harvest data for the Willapa Hills and Olympic Elk Herd Areas.B. Hunter participation and success rates for the Willapa Hills and Olympic elk herds.C. Hunter success rates for Willapa Hills and Olympic elk herds.AntlerlessBull800# of elk harvested7006005004003002001000YearFigure 1. District 17 Willapa Hills Herd area (GMUs 658-699) elk harvest totals. Total bull (blue) andantlerless (green) elk harvested during general modern firearm, archery, and muzzleloader elk seasonscombined, 2001–2018. Harvest totals do not include tribal harvest.8 P a g e
AntlerlessBull160# of elk harvested140120100806040200YearFigure 2. Olympic herd area (GMUs 618, 638, 642, 648), 2001-2018 total elk harvest. *Note: Onlyincludes elk harvest totals for GMUs inside District 17. Total bull (blue) and antlerless (green) elkharvested during general modern firearm, archery, and muzzleloader elk season s combined, 2001–2018.Totals do not include tribal harvest.Modern 7Figure 3. Total elk hunter participation in the Willapa Hills herd area during general seasons from2001-2018 by weapon type. This includes modern firearm (black), archery (orange), and muzzleloader(red).9 P a g e
Modern FirearmArcheryMuzzleloader25%Hunter 1320152017Figure 4. Elk hunter success rates in the Willapa Hills herd area during general seasons from 20012018 by weapon type. This includes modern firearm (black), archery (orange), and muzzleloader (red).1200Modern FirearmArcheryMuzzleloaderHunter 0152017YearFigure 5. Total elk hunter participation in the Olympic herd area (GMUs 618, 638, 642, 648) duringgeneral seasons from 2006-2018 by weapon type. This includes modern firearm (black),archery(orange), and muzzleloader (green).10 P a g e
18%Modern FirearmArchery20032009Muzzleloader16%Hunter 2017YearFigure 6. Elk hunter success rates in the Olympic herd area (GMUs 618, 638, 642, 648) during generalseasons from 2001-2018 by weapon type. This includes modern firearm (black), archery (orange), andmuzzleloader (green).HOW TO FIND ELKLike most places, when hunting elk in District 17, hunters need to do homework and spend timescouting before the season opens. Predicting where elk are located is especially difficult afterhunting pressure increases. The majority of hunters spend their time focused on clearcuts. Elkoften forage in clearcuts and are highly visible when they do. Those highly visible elk oftenattract other hunters. Consequently, clearcuts can get crowded in a hurry.Many elk (especially bulls) will infrequently visit clearcuts during daylight hours. Instead, theymay spend most of their day in closed canopy forests, swamps, or regeneration stands (alsoknown as reprod stands).Some generalities can be made about the landscape that will increase the odds of locating elk.When going to a new area, hunters are encouraged to cover as much ground as possible. Noteareas where you see sign along roads and landings. Landings are often ungraveled, making iteasy to see fresh tracks. Scouting will reveal which areas hold elk and where to focus moreintensive efforts.After identifying areas with abundant signs of elk, hunters should focus on areas that providecover and are adjacent to clearcuts. During early seasons, when it is warm, these cover areasoften include swamps, creek bottoms, river bottoms, or any place near water. Once the seasonprogresses and temperatures cool, elk are less attracted to water, and locating them becomes11 P a g e
more difficult. Hunting pressure alsocan force elk to use areas thatprovide thicker cover or are moreinaccessible to hunters because oftopography.Later in the season, consult atopographic map and find bencheslocated in steep terrain with thickcover. Elk often use these benches tobed down during the day. Finally,don’t let a locked gate (provided thatnon-motorized access is allowed)keep you from going into an area tosearch for elk. Frequently, theseareas hold elk that have not receivedmuch hunting pressure, making themless skittish and easier to hunt. Apopular approach to hunting behindgates is to use mountain bikes withtrailers. Biking on timber companylands is facilitated by high densities ofmaintained gravel roads.Corey Bronckhorst with elk taken from GMU 673 during the2016 archery season.ELK AREASThere are two Elk Areas in District 17: Elk Area 6010 (Mallis or Raymond) and Elk Area 6064(Quinault Valley). Nearly all permit opportunities in District 17 are antlerless elk hunts and areassociated with these Elk Areas. Elk Area 6010 was established in a location with chronic elkdamage problems, and its primary purpose is to provide antlerless harvest opportunities that helpcontrol the growth rate of herds in localized agricultural areas.Elk Area 6064 was established to resolve problems landowners had with elk hunters. Specialrestrictions apply in each Elk Area. In Elk Area 6064, only Master Hunters are allowed to huntelk during general modern firearm, archery, and muzzleloader seasons.The purpose of Elk Area 6010 is to allevi
Mar 31, 2020 · bulls to 100 cows in the pre-hunting season population and a minimum of 12 bulls to 100 cows in the post-season population. Portions of the district (such as GMU 684) must balance overall herd objectives with the equally important mission to minimize conflicts with people. Elk can