Transcription
12. ANTHROPOGENIC FORCINGS AND ASSOCIATEDCHANGES IN FIRE RISK IN WESTERN NORTH AMERICAAND AUSTRALIA DURING 2015/16Simon F. B. Tett, Alexander Falk, Megan Rogers, Fiona Spuler, Calum Turner, JoshuaWainwright, Oscar Dimdore-Miles, Sam Knight, Nicolas Freychet,Michael J. Mineter, and Caroline E. R. LehmannExtreme vapor pressure deficits (VPD) have been associated with enhanced wildfire risk. Using onemodel, we found for 2015/16 that human influences quintupled the risk of extreme VPD for western NorthAmerica and increased the risk for extratropical Australia.Introduction. In 2016, about 3.6 million hectares ofland burned in the United States and Canada (NIFC2017; NFD 2017). In Canada, a wildfire southwest ofFort McMurray, Alberta, caused the largest wildfireevacuation in Alberta’s history and destroyed 2400homes in 2016 (McConnell 2016). Abatzoglou andWilliams (2016; AP16 from hereon) showed thatanthropogenic climate change has increased forestfire activity in the western United States. This raisesthe question if anthropogenic forcing are increasingthe risk of devastating events outside this region suchas the Canadian Fort McMurray fire.During the Australian summer of 2015/16, thecountry experienced high numbers of bushfires: thesouthwest and southeast of the country were mostaffected with more than 100 000 hectares of vegetationburned in Tasmania (ABC News 2016a). Over thecourse of this summer, 408 residential and 500 nonresidential buildings were destroyed nationwide. Thisfire season was moderately destructive with insuredlosses of about AUD 350 million (ABC News 2016b).AP16 found for the western United States a stronglink between the spring–summer vapor pressuredeficit (VPD) and the annual burned area. In thispaper, we build on this work using monthly averageVPD as a proxy for fire risk during the summer of2016 for extratropical Australia (October–February)and western North America (May–August) thoughAFFILIATIONS: Tett, Rogers, Freychet, Mineter, and Lehmann—School of Geosciences, University of Edinburgh, Edinburgh, UnitedKingdom; Falk, Spuler, Turner, Wainwright, Dimdore-Miles, andKnight—School of Physics, University of Edinburgh, Edinburgh,United Kingdom.DOI:10.1175/BAMS-D-17-0096.1A supplement to this article is available online (10.1175/BAMS-D-17-0096.2)S60 JANUARY 2018this link has not been directly established for eitherregion. VPD is an absolute measure of the state ofatmospheric moisture, specifically the differencebetween the saturation vapor pressure and the actualvapor pressure of the atmosphere (Seagar et al. 2015).Changes in VPD are associated with the drying ofboth live vegetation and litter fuels, and it is onlywhen vegetation and litter fuels are sufficiently drythat fires can both ignite and spread (Bradstock 2010).Methods. To estimate the effect of anthropogenic climate change on VPD in western North America andextratropical Australia, we compared three differentensembles of the HadAM3P atmosphere-only model(Massey et al. 2015), which has a resolution of 1.875 1.25 , with each other and the ERA-Interim (ERAI)reanalysis (Dee et al. 2011). The ensembles are: Hist15–16: Driven by observed sea surfacetemperatures (SST), sea ice coverage (SIC) aswell as current concentrations of greenhousegases and estimates of aerosol emissions (updated from Tett et al. 2013). Nat15–16: Driven by SST, SIC, greenhousegases, and aerosol emissions as they are estimated to have been without human inducedclimate change with natural SST (Fig. ES12.1a)and SIC conditions described in the onlinesupplement. Historical: Ensemble of 5 continuous simulations from December 1959 to November 2009described by Tett et al. (2013).Both Hist15–16 and Nat15–16 have 24 members,each using slightly different initial conditions, starting in December 2014 and ending in August 2016.We analyze the 12-month period September 2015 to
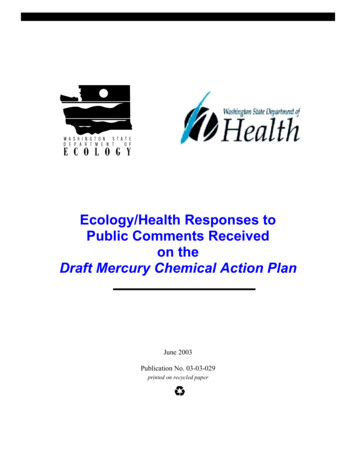
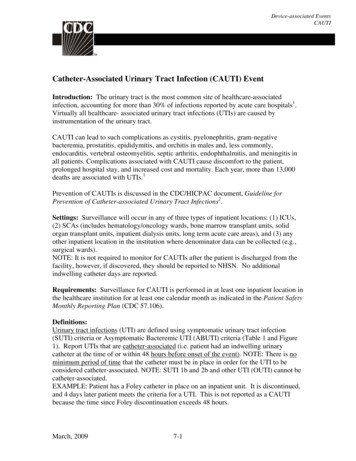
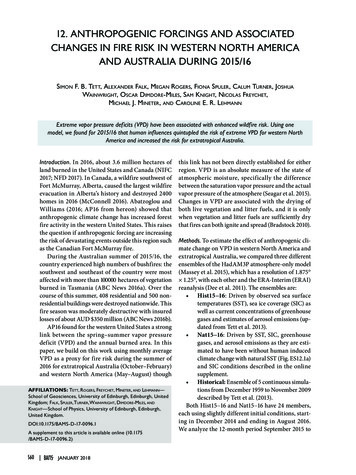
August 2016. VPD is defined as (Seager et al. 2015;Wallace and Hobbs 2006):and, neglecting moisture mass in the atmosphere,can be rewritten as:Eq. (1)where e(es) is the (saturated) vapor pressure, q thespecific humidity, p* the surface pressure, and RH therelative humidity near the surface.We computed VPD in the HadAM3P simulationsand ERAI reanalysis using Eq. (1) applied to gridded monthly mean data neglecting nonlinearity. ForHadAM3P, q and RH were 1.5 meter values while forERAI we interpolated q and RH from monthly meanpressure level data to the surface. We use as a referenceperiod the 30 years 01 December 1979–30 November2009 and VPD, qsat (q/RH), q, and p* were convertedto anomalies against this period from the Historicalor ERAI values.The western North America (WNA) region wasdefined as in Giorgi and Francisco (2000; GF00),while we defined an extratropical Australian region(extAUS) as the GF00 AUS region south of 23.5 S.Fire does not occur in all places in the regions, so wedefined a fire-mask to keep locations in our analysiswhere fire occurs. This mask was constructed fromthe MODIS CMG dataset using Aqua satellite measurements (Giglio et al. 2009) for 2003–16. Each0.5 0.5 grid box and climatological month, wasdefined as a fire grid box if the fraction of pixelswith fire detected for 2003–16 was greater than 10 5(Figs. ES12.1b–e show regions and fraction of firepixels for January and July). The 10 5 is arbitrary andcorresponds to roughly one detected fire pixel permonth. Simulated (and reanalysis) VPD, q, RH, qsat (q/RH), and p* anomalies and normals were bilinearlyinterpolated to this grid from the model/reanalysisgrid, data only kept at fire grid boxes, and then areaFig. 12.1. VPD (Pa) comparison between ERAI (black dot-dashed, squares) and Historical (black lines, circles):(a),(c) 01 Dec 1979–Nov 2009 normals; (b),(d) std. dev. for WNA and extAUS, respectively. Gray shading indicates where reanalysis and Historical std. dev. are consistent (5%–95%). Std. dev for Sep 2105–Aug 2016 fromHist15–16 (red circles, lines) and Nat15–16 (blue triangles, dashed lines) are also shown in (b),(d). The x-axis onall plots shows climatological month (labels on bottom plots only).AMERICAN METEOROLOGICAL SOCIETYJANUARY 2018 S61
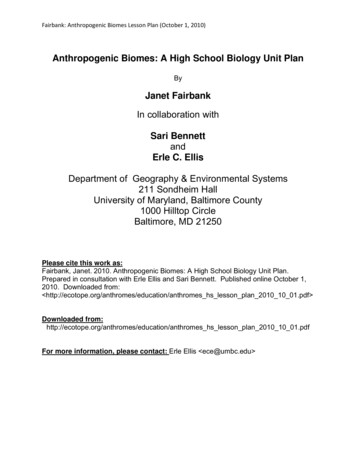
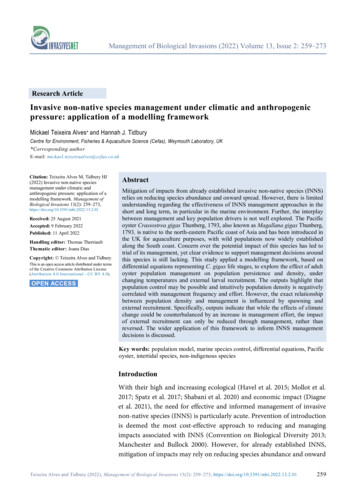
Fig. 12.2. (a) Ensemble-mean VPD anomalies (Pa) from Hist15–16 (circles) and Nat15–16 (triangles) for WNA(red) and extAUS (green). Shading shows 2σ uncertainty. (b) Maximum VPD anomaly (Pa) for each climatological month [thick solid line and year (number) when max occurred] and anomaly for 15/16 (squares) fromERAI. Shading shows 5%–95% ranges from Hist15–16 ensemble with colors as (a). (c) Fraction (%) of Nat15–16(dashed lines, triangles) and Hist15–16 (solid lines, circles) ensembles that exceeded 1979–2009 ERAI maximumVPD value for each month. Thin pale lines show same when anomalies scaled to correct for variance errors.All subplots use same common x-axis [values shown in (c)].averaged over the two regions to produce time series.It is these time series that we subsequently analyze.Uncertainties on ensemble averages were computedby bootstrapping (Efron and Tibshirani 1994) overthe ensemble members.We define as a threshold for extreme events theERAI maximum regional average VPD anomaly, foreach calendar month, from the reference period corresponding to a one-in-30-year event. To compute therisk of exceeding this threshold we compute, for eachmonth, the fraction of the Nat15–16 and Hist15–16anomalies that exceed it. We test sensitivity to variance errors by scaling the Hist15–16 and Nat15–16anomalies by the ratio of the monthly mean standarddeviations from ERAI and Historical anomalies forthe reference period.Results. Model simulations are evaluated by comparingthe Historical ensemble with ERAI. HadAM3P’s VPDbiases are small relative to the annual cycle thoughare negative for most of the year in WNA (Fig. 12.1a)with largest differences in June of 180 Pa. HadAM3PS62 JANUARY 2018VPD variance appears consistent with that of ERAI(Fig. 12.1b) though the model has significantly smallervariance than ERAI for January–March, and there isno strong evidence of an increase in variability dueto human forcings.For extAUS Historical mean, VPD is, apart fromNovember and December, consistent with that fromERAI (Fig. 12.1c). In November and December biasespeak at about 120 Pa. Variability from reanalysis andHadAM3P is broadly consistent though reanalysisvariability during austral summer is generally largerthan simulated in HadAM3P. For most of the year, extAUS has larger variability in Hist15–16 and Historical than in Nat15–16 (Fig. 12.1d). Mean VPD valuespeak in WNA in June–August while in extAUS theyare largest during October–February. It is these components of the annual cycle we subsequently focus on.We now compare ensemble means from Hist15–16with Nat15–16. For WNA, differences between thetwo ensembles are significant throughout most of theyear with largest differences in July and August 2016(Fig. 12.2a). For extAUS the Hist15–16 (Nat15–16)
ensemble has positive (negative) anomalies for mostof the period suggesting that human influences haveincreased VPD. However, during December 2015 andJanuary 2016 Nat15–16 shows positive anomalies.We compare the Hist15–16 ensemble anomalieswith ERAI (Fig. 12.2b). For both regions Hist15–16is broadly consistent with ERAI though extAUS inOctober 2015, and WNA in February 2016 are exceptions to this (Fig. 12.2b). ERAI VPD values forSeptember 2015 to August 2016, though generallylarger than Nat15–16, are not very exceptional withalmost all values being smaller than the maximum1979–2009 VPD value. Maximum ERAI anomaliesoccur throughout the reference period with no obviously preferred year (or decade).We now investigate the probability, for bothensembles, of crossing the 1979–2009 threshold. InextAUS, only in January 2016 do any of the Nat15–16members cross the ERAI threshold (Fig. 12.2c). InWNA, the threshold is exceeded once in each ofSeptember through November 2015. For extAUS,there is an approximate doubling of the probabilityof exceeding the thresholds for October–Februarywith a probability of about 7% (4%) for Hist15–16(Nat15–16). May 2016, when the Fort McMurray firesstarted, has near-zero anomaly for WNA in both ensembles and reanalysis suggesting that this event wasnot strongly linked to continental scale VPD changes,and no ensemble members cross the 30-year threshold(Fig. 12.2c) during this month. However, during June16–August 16, we find several extreme VPD valuesin the Hist15–16 ensemble, and no such events in theNat15–16 ensemble (Fig. 12.2c). The average probability of crossing the threshold during this periodis 19%. Making a relative risk estimate is difficultwhen the probability of events in the natural worldare small. Being very conservative we assume, with24 ensemble members, that the probability of crossingthe threshold in Nat15–16 is 4% (1/24) giving a riskratio of about 5, though larger values are possible.We tested the sensitivity of these results to correcting for variance errors and found little sensitivity inWNA, but the risk for extAUS changed to 12% (3%)for Hist15–16 (Nat15–16) suggesting a risk ratio ofabout 4. Being conservative and taking the risk of 1:30events for Nat15–16 as 4% then the risk of extremeVPD events, in extAUS, has increased by 2–3 times.Our estimation of risk ratios is dependent onHadAM3P and the boundary conditions used. HadAM3P compares well with the ERAI VPD climatology(Fig. 12.1a) and the reanalysis values for September2015–August 2016 are largely contained within theAMERICAN METEOROLOGICAL SOCIETYHist15–16 ensemble (Fig. 12.2a). We decompose thechanges in VPD into changes in saturated humidity,surface pressure, relative humidity, and residual effects (see online supplement and Fig. ES12.2). We findthat changes in saturated humidity (likely dominatedby changes in temperature) and relative humidity(likely model sensitive) are the dominant drivers ofVPD in both regions. In WNA, changes in qsat makethe largest contribution with a small enhancementby reductions in RH. In contrast, for extAUS changesin RH offset changes in qsat suggesting some modelsensitivity in that region. Overall, we conclude that forWNA that human influences have very considerablyincreased the risk of extreme VPD values in June–August 2016, though not for the Fort McMurray fireperiod in May. For extratropical Australia, we find aweaker human influence with a doubling of the riskof extreme VPD. Assuming wildfire in extAUS andWNA, like in the western United States, is relatedto VPD then human influences have considerablyincreased the risk of one-in-30-year wildfire events.ACKNOWLEDGMENTS. SFBT, MJM, and CERLsupported by University of Edinburgh. NF supportedby U.K.–China Research & Innovation PartnershipFund through the Met Office Climate Science for Service Partnership (CSSP) China as part of the NewtonFund. AF, MR, FS, CT, JW, O D-M, and SK carriedout simulations and preliminary analysis as part oftheir coursework for “Introduction to three dimensional climate modelling” at University of Edinburgh.We thank the editor, two anonymous reviewers, andStephanie Herring for comments that improved thepaper, and Dathi Stone (LBL) for providing the Natural SST and SIC datasets. Data and software used inthis paper are available from SFBT.JANUARY 2018 S63
REFERENCESABC News, 2016a: Major bushfires in Australia in2015-2016 summer: Before and after. ABC News[Australia] website, accessed 29 March 2017. [Available online at 4.]—, 2016b: Catastrophic Summer events cost insurersmore than 550 million,Insurance Council of Australia says, ABC News [Australia] website, accessed29 March 2017. [Available online at Abatzoglou, J. T., and A. P. Williams, 2016: Impact ofanthropogenic climate change on wildfire acrosswestern US forests. Proc. Natl. Acad. Sci. USA, 113,11,770–11,775, doi:10.1073/pnas.1607171113.Bradstock, R. A., 2010: A biogeographic model of fireregimes in Australia: Current and future implications. Global Ecol. Biogeogr., 19, 145–158, doi:10.1111/j.1466-8238.2009.00512.x.Dee, D. P., and Coauthors, 2011: The ERA-Interim reanalysis: Configuration and performance of the dataassimilation system. Quart. J. Roy. Meteor. Soc., 137,553–597, doi:10.1002/qj.828.Efron, B., and R. J. Tibshirani, 1994: An Introduction tothe Bootstrap. CRC press, 456 pp.Giglio, L., T. Loboda, D. P. Roy, B. Quayle, and C.O. Justice, 2009: An active-fire based burnedarea mapping algorithm for the MODIS sensor.Remote Sens. Environ., 113, 408–420, doi:10.1016/j.rse.2008.10.006.Giorgi, F., and R. Francisco, 2000: Uncertainties inregional climate change prediction: A regionalanalysis of ensemble simulations with the HADCM2coupled AOGCM. Climate Dyn., 16, 169–192,doi:10.1007/PL00013733.Massey, N., and Coauthors, 2015: weather@home—development and validation of a very large ensemblemodelling system for probabilistic event attribution.Quart. J. Roy. Meteor. Soc., 141, 1528–1545,doi:10.1002/qj.2455.McConnell, R., 2016: Fort McMurray is ‘still alive,’fire chief says — but safety concerns linger. Canadian Broadcasting Corporation News, webstory.[Available at -notley-media-1.3572982, Dateaccessed 2017-03-29.]S64 JANUARY 2018NFD, 2017: National forest and forest managementstatistics. National Forestry Database [Canada],accessed 30 March 2017. [Available online at http://nfdp.ccfm.org/index e.php.]NIFC, [2017]: Total wildland fires and acres. National Interagency Fire Center [U.S.], accessed 29March 2017. [Available at www.nifc.gov/fireInfo/fireInfo stats totalFires.html.]Seager, R., A. Hooks, A. P. Williams, B. Cook, J. Nakamura, and N. Henderson, 2015: Climatology, variability, and trends in the U.S. vapor pressure deficit,an important fire-related meteorological quantity.J. Appl. Meteor. Climatol., 54, 1121–1141, doi:10.1175/JAMC-D-14-0321.1.Tett, S. F. B., K. Deans, E. Mazza and J. Mollard, 2013:Are recent wet northwestern European summers aresponse to sea ice retreat? [in “Explaining ExtremeEvents of 2012 from a Climate Perspective”]. Bull.Amer. Meteor. Soc., 94 (9), S32–S35.Wallace, J., and P. Hobbs, 2006: Atmospheric Science: AnIntroductory Survey. 2nd ed. Academic Press, 483 pp.
defined as a fire grid box if the fraction of pixels with fire detected for 2003-16 was greater than 10 5 (Figs. ES12.1b-e show regions and fraction of fire pixels for January and July). The 10 5 is arbitrary and corresponds to roughly one detected fire pixel per month. Simulated (and reanalysis) VPD, q, RH, q sat (q/