Transcription
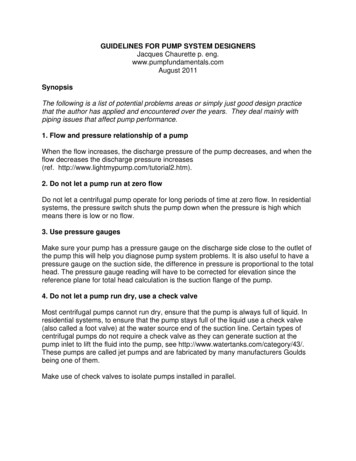
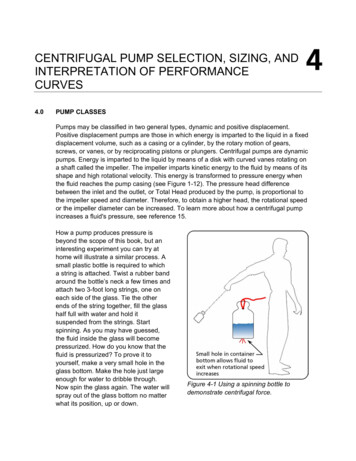
CENTRIFUGAL PUMP SELECTION, SIZING, ANDINTERPRETATION OF PERFORMANCECURVES4.0PUMP CLASSESPumps may be classified in two general types, dynamic and positive displacement.Positive displacement pumps are those in which energy is imparted to the liquid in a fixeddisplacement volume, such as a casing or a cylinder, by the rotary motion of gears,screws, or vanes, or by reciprocating pistons or plungers. Centrifugal pumps are dynamicpumps. Energy is imparted to the liquid by means of a disk with curved vanes rotating ona shaft called the impeller. The impeller imparts kinetic energy to the fluid by means of itsshape and high rotational velocity. This energy is transformed to pressure energy whenthe fluid reaches the pump casing (see Figure 1-12). The pressure head differencebetween the inlet and the outlet, or Total Head produced by the pump, is proportional tothe impeller speed and diameter. Therefore, to obtain a higher head, the rotational speedor the impeller diameter can be increased. To learn more about how a centrifugal pumpincreases a fluid's pressure, see reference 15.How a pump produces pressure isbeyond the scope of this book, but aninteresting experiment you can try athome will illustrate a similar process. Asmall plastic bottle is required to whicha string is attached. Twist a rubber bandaround the bottle’s neck a few times andattach two 3-foot long strings, one oneach side of the glass. Tie the otherends of the string together, fill the glasshalf full with water and hold itsuspended from the strings. Startspinning. As you may have guessed,the fluid inside the glass will becomepressurized. How do you know that thefluid is pressurized? To prove it toyourself, make a very small hole in theglass bottom. Make the hole just largeenough for water to dribble through.Now spin the glass again. The water willspray out of the glass bottom no matterwhat its position, up or down.Figure 4-1 Using a spinning bottle todemonstrate centrifugal force.
4 24.1PUMP SELECTION, SIZING AND INTERPRETATION OF PERFORMANCE CURVESCOVERAGE CHART FOR CENTRIFUGAL PUMPSA coverage chart (see Figure 4-2) makes it possible to do a preliminary pump selection bylooking at a wide range of pump casing sizes for a specific impeller speed. This charthelps narrow down the choice of pumps that will satisfy the system requirements.Figure 4-2 Typical pump capacity coverage chart.4.2PERFORMANCE CURVE CHARTThe following figure shows atypical pump performance chartfor a given model, casing size,and impeller rotational speed. Agreat deal of information iscrammed into one chart and thiscan be confusing at first. Theperformance chart covers arange of impeller sizes, whichare shown in even increments of1/2" from 7 1/2" to 9 1/2".Figure 4-3 Typical pump performance curve.Impellers are manufactured tothe largest size for a given pump casing and machined or "trimmed" to the requireddiameter when the pump is sold.
PUMP SELECTION, SIZING AND INTERPRETATION OF PERFORMANCE CURVES4 3Performance CurveAt some point in the pump selection process, the impeller diameter is selected. For anexisting pump, the diameter of the impeller is known. For a new pump, our calculations ofTotal Head for a given flow rate will have determined the impeller diameter to selectaccording to the performance curve. Figure 4-4 shows only the information relevant to the8 1/2" impeller performance curve.Figure 4-4 Typical performance curve for a specific impeller diameter.A performance curve is a plot of Total Head vs. flow rate for a specific impeller diameterand speed. The plot starts at zero flow. The head at this point corresponds to the shut-offhead of the pump, point A in Figure 4-4 (more about this later). Starting at this point, thehead decreases until it reaches its minimum at point B. This point is sometimes called therun-out point and represents the maximum flow of the pump. Beyond this, the pumpcannot operate. The pump's range of operation is from point A to B.Efficiency CurvesThe pump's efficiency varies throughout its operating range. This information is essentialfor calculating the motor power (see section 4.9).The B.E.P. (best efficiency point) is the point of highest efficiency of the pump. All pointsto the right or left of the B.E.P have a lower efficiency (see Figure 4-4). The impeller issubject to axial and radial forces, which get greater the further away the operating point isfrom the B.E.P. These forces manifest themselves as vibration depending on the speedand construction of the pump. The point where the forces and vibration levels are minimalis at the B.E.P.In selecting a pump, one of the concerns is to optimize pumping efficiency. It is goodpractice to examine several performance charts at different speeds to see if one modelsatisfies the requirements more efficiently than another. Whenever possible the lowestpump speed should be selected, as this will save wear and tear on the rotating parts.
4 4PUMP SELECTION, SIZING AND INTERPRETATION OF PERFORMANCE CURVESNote: The pump performance curves are based on data generated in a test rig using water asthe fluid. These curves are sometimes referred to as water performance curves. The use ofthese curves for fluids with a different viscosity than water can lead to error if the propercorrection factors are not applied. These correction factors are applied to the Total Head, theflow and the efficiency of the pump, and are published in form of curves by the HydraulicInstitute (see Standards book published by the Hydraulic Institute, web site:http://www.pumps.org and for the correction factor charts see the web sitewww.fluidedesign.com).Horsepower CurvesThe horsepower curves are shown on the chart and give the power required to operatethe pump within a certain range. For example (see Figure 4-5), all points on theperformance curve to the left of the 2 hp curve will be attainable with a 2 hp motor. Allpoints to the left of 3 hp curve and to the right of the 2 hp curve will be attainable with a 3hp motor. The horsepower can be calculated with the Total Head, flow and efficiency atthe operating point. (More on horsepower calculations and operating point later). Notethat the horsepower curves shown on the performance curves are valid for water only.Figure 4-5 Coverage area of horsepower curves.N.P.S.H. Requirement CurvesThe pump manufacturer specifies a minimum requirement on the N.P.S.H. in order for thepump to operate at its design capacity. These are the vertical dashed lines in Figure 4-6.The N.P.S.H. required becomes higher as flow increases, and lower as flow decreases.This essentially means that more pressure head is required at the pump suction for highflows than low flows. Keep in mind that N.P.S.H. is a head term and thereforeindependent of the fluid density and is in absolute fluid column height. The N.P.S.H.required for the maximum flow in Figure 4-4 is approximately 4 feet absolute. This is notvery restrictive; most industrial pumping systems will have much more N.P.S.H. available.
PUMP SELECTION, SIZING AND INTERPRETATION OF PERFORMANCE CURVESFigure 4-6 N.P.S.H required curves.4.3IMPELLER DIAMETER SELECTIONQuite often, the operating point is located between two curves on the performance chart.We can calculate the impeller size required by linear interpolation. For example, if theoperating point falls between the 9" and 9 1/2" impeller curve (see Figure 4-7), thefollowing equation will give the correct size: 9.5 9 DOP 9 ( HOP H9) H91/ 2 H9 where DOP : impeller diameter required; HOP : pump total head at the operating point; H9 : pump total head at the intersection of the 9” impeller curve and flow rate; H91/2 : pump total head at the intersection of the 9 1/2” impeller curve and the flowrate.Figure 4-7 Interpolating impeller diameter.4 5
4 6PUMP SELECTION, SIZING AND INTERPRETATION OF PERFORMANCE CURVESIt is good practice to select (when possible) a pump with an impeller that can be increased in size,permitting a future increase in head and capacity. Or alternatively, an impeller which can be reducedin size. As a guide, select a pump with an impeller size no greater than between 1/3 and 2/3 of theimpeller range for that casing with an operating point in the high efficiency area (see Figure 4-8). It isalso important not to go too far right or left from the B.E.P. A guideline is to locate the operatingpoint between 110% and 80% (see reference 16) of the B.E.P. flow rate with an operating point in thedesirable impeller selection area (see Figure 4-8).Figure 4-8 Desirable pump selection area.4.4SYSTEM CURVEThe system curve is a plot of the Total Head vs. the flow for a given system. The higherthe flow, the greater the head required (see Figure 4-9). The shape of the system curvedepends on the type of system being considered. The system curve equation for a typicalsingle outlet system such as in Figure 2-10 is: H P ( q ) H F ( q ) H EQ ( q ) H v ( q ) H TSThe system curve is superimposed on the pump performance chart. The Total Static headis constant and the friction head, equipment head and velocity head are flow dependent.The calculation of Total Head at different flow rates produces a plot of Total Head vs. flowthat is called the system curve.The operating point is the point on the system curve corresponding to the flow and headrequired. It is also the point where the system curve intersects the performance curve.The design system curve is usually calculated with extra flow capacity in mind. It is good
PUMP SELECTION, SIZING AND INTERPRETATION OF PERFORMANCE CURVES4 7practice to plot the system curve for higher flow rates than the design flow rate, since flowdemand may change and extra capacity may be required.Figure 4-9 Superposition of system curveand pump performance curve.4.5OPERATING POINTThe question in example 2.1 has remained unanswered until now. That is: How can weguarantee that the pump will deliver 500 USGPM at 70 feet of head?First, determine the right pump size by using the coverage chart (see Figure 4-2). Locatethe head and flow coordinate (operating point) on the chart. This will identify the casingsize and pump speed. Locate the correct performance curve chart for this pump casingsize and again identify the operating point.Figure 4-10 Location of operating point in example 2.1.
4 8PUMP SELECTION, SIZING AND INTERPRETATION OF PERFORMANCE CURVESDetermine the impeller size. The impeller size will be approximately 8.75". The dashedline represents the performance curve of the pump. The pump can only operate on itsperformance curve. The system can only be run somewhere on the system curve. Theintersection of these two defines the operating point which is the only point that the pumpand system can operate.As is often the case, one question leads to another: How does the pump get to theoperating point from the moment it is switched on?There are two methods which can be used to start a pump. With method 1 the dischargevalve is closed, whereas with method 2 the discharge valve is open. The term dischargevalve refers to the manual valve located close to the pump outlet flange.Method 1 (discharge valve closed)Pumps are often started with the discharge valve closed. Immediately after the pump isstarted, the head rises to point D (see Figure 4-11). The system curve at this moment isvertical. By gradually opening the discharge valve to its full open position, point D willmove down the performance curve to point C, where the discharge valve should be fullyopen. The system curve's shape is progressively modified as the operating point is movedtowards point C. This is a typical way of starting large pumps and should be the preferredmethod for any pump operating at more than 500 USGPM.Figure 4-11 Starting the pump with discharge valve closed.
PUMP SELECTION, SIZING AND INTERPRETATION OF PERFORMANCE CURVES4 9Method 2 (discharge valve open)The alternate method is to start with the discharge valve open. When the pump is juststarting the initial RPM is low; the pump produces little head and flow. As the pumpaccelerates, it will intersect the system curve at point A at 200 RPM, point B at 500 RPMand finally point C at the normal rotational speed of the pump and motor. This happensvery quickly since the motor will reach its full operating speed in a few seconds. Thedisadvantage of starting with this method is that high initial velocity can produce a severewater hammer, shaking pipes and equipment.Figure 4-12 Starting the pump with discharge valveopen.Method 1 is the preferred method of starting a pump. To minimize personnelrequirements, it is the practice in many plants to equip their pumps with remote operatedon-off discharge valves for large pumps (larger than 500 USGPM). The valves are openedautomatically by a control system, thereby providing a smooth start-up.4.6SAFETY FACTOR ON TOTAL HEAD OR CAPACITYBefore finalizing the choice of impeller size, consider whether you should apply an extracapacity factor or not (capacity flow). There are no rules; however, since we normallysize pumps for someone else, it is a good idea to agree on a safety margin with yourclient. Point 1 on impeller curve A (see Figure 4-13) is the operating point (on systemcurve a) before a capacity factor is applied.Safety margin on total headIf we apply a head factor of 10%, we will have to select impeller C. The operating pointwill now be at point 2. This means that there must be a different system curve than curvea, which is curve c. The only explanation for this is that we have underestimated thepressure drops throughout the system. If it turns out that the pressure drop calculationswere right after all, and that we really are operating with curve a, then the operating pointwill shift from point 2 to 3 on impeller curve C (assuming there is sufficient horsepower tooperate at point 3). If we need to get back to the flow corresponding to point 1 for processreasons, then throttling a valve at the pump discharge will change the operating curve tomatch curve c and bring the operating point back to point 2.
4 10PUMP SELECTION, SIZING AND INTERPRETATION OF PERFORMANCE CURVESFigure 4-13 Location of capacity factor.Safety margin on flowIf we apply a capacity factor of say 10%, we will have to select impeller curve B. Thismeans that the system curve is in reality curve d. If in actuality our original flow estimatewas correct, then the operating point will shift from point 4 to 5. To get back to the originalflow, we have to throttle back so that we shift to point 6, and we will operate on a newsystem curve b.Safety margin on total head and flowIf we decide to put on suspenders and a belt (i.e. a head and capacity factor), andassuming that we are operating on system curve a, then we would select impeller curve Cand operate at point 3. If we needed to get back to our original flow at point 1, then wewould throttle back until we reached point 2.This is a similar situation to applying solely a head factor because of the shape of theperformance and system curves. Therefore, applying a head factor only also providesreserve capacity on flow.
PUMP SELECTION, SIZING AND INTERPRETATION OF PERFORMANCE CURVES4.74 11PUMP OPERATION TO THE RIGHT OR LEFT OF THE BEST EFFICIENCY POINT (B.E.P.)The impeller is subjected to axial and radial forces. The level of the radial force depends onthe pressure within the casing and is taken up by the drive shaft bearings.Figure 4-14 The forces on the impeller.There is also a net radial force whose level depends on the pressure level within the casing,and also on the position of the operating point with respect to the B.E.P. This force increasesrapidly the further away the operating point (see Figure 4-15) gets from the B.E.P. of thepump (for more information see reference 16).
4 12PUMP SELECTION, SIZING AND INTERPRETATION OF PERFORMANCE CURVESFigure 4-15 Variation on the magnitude of the radial force on the impelleraccording to the position of the operating point with respect to theB.E.P.(reprinted with permission of McGrawHill).Figure 4-16 Variation in the level of vibration at theoperating point vs. the position of the B.E.P.(reprintedwith permission of the Goulds pump company).
PUMP SELECTION, SIZING AND INTERPRETATION OF PERFORMANCE CURVES4 13What are the consequences of operating to the right or left of the B.E.P.?To the right of the B.E.P., or at high flowsOperating at the far right of the curve, near run-out point of the pump (point B, Figure 4-4)should be avoided. As flow increases, so does the N.P.S.H. required, and thereforecavitation is more likely to occur.To the left of the B.E.P. or at low flowsOperation of centrifugal pumps at reduced capacity leads to a number of unfavorableresults that may take place separately or simultaneously, and should be anticipated andcircumvented. Some of these are: Operating at less than best efficiencyOn occasion, reduced flows may be required by the process. This can beaccommodated by a variable speed drive, or by using several pumps. One ormore pumps can then be shut down to provide the reduced flow. Higher bearing loadIf a pump is of a single volute design, it will be subjected to higher radial thrust,which will increase the load on the radial bearing. Therefore, the bearing lifewould be expected to diminish. Temperature riseAs capacity is reduced, the temperature of the pumped liquid increases. Toavoid exceeding permissible limits, a minimum flow by-pass is required. Internal re-circulationAt certain flows below the best efficiency, all centrifugal pumps are subjectedto internal re-circulation, in both the suction and the discharge area of theimpeller. This can cause hydraulic surging and damage to the impeller metal,similar to that caused by classic cavitation, but taking place in a different areaof the impeller.Figure 4-17 Internal recirculation at low flow (reprintedwith permission of McGraw-Hill).
4 144.8PUMP SELECTION, SIZING AND INTERPRETATION OF PERFORMANCE CURVESPUMP-SHUT-OFF HEADThe shut-off head is the Total Head that the pump can deliver at zero flow (see Figure 419). The shut-off head is important for 2 reasons.1. In certain systems (admittedly unusual), the pump discharge line may have to runat a much higher elevation than the final discharge point. The fluid must first reachthe higher elevation in the system. If the shut-off head is smaller than the statichead corresponding to the high point, then flow will not be established in thesystem.2. During start-up and checkout of the pump, a quick way to determine if the pumphas the potential capacity to deliver the head and flow required, is to measure theshut-off head. This value can be compared to the shut-off head predicted by theperformance curve of the pump.Figure 4-18 Discharge pipe coming froma higher elevation into the dischargetank.
PUMP SELECTION, SIZING AND INTERPRETATION OF PERFORMANCE CURVES4 15Figure 4-19 Location of pump shut-off head on theperformance curve.4.9PUMP POWERA pump's power demand is directly proportional to the difference between the inlet andoutlet pressure and the flow rate.P p P qwhere pP is the difference in pressure at the inlet and the outlet of the pump, and q theflow rate. The above equation expressed in imperial units is:P(hp ) p P ( psi) q (USgal / min)1714.2[4-1] pP is converted to head. From equation [1-5]: p P ( psi ) 1SG H P ( ft of fluid )2.31[4-2]by substituting equation [4-2] into equation [4-1] we obtain:P(hp) SG H P ( ft of fluid) q(USgal / min)3960[4-3]
4 16PUMP SELECTION, SIZING AND INTERPRETATION OF PERFORMANCE CURVESEquation [4-3] would be true if the pump were 100% efficient. Pump efficiency data areavailable from the pump manufacturer. All manufacturers test their pumps for variousflows, heads and impeller sizes. The resulting efficiency data are mapped on the pumpperformance curve. The true power required at the pump shaft is:P(hp) SG H P(ft of fluid) q(USgal/ min)3960 η[4-4]where η is the pump efficiency. If the pump efficiency is 60%, then the value of η is 0.6.It is good practice to design the pump base in such a way that the selected motor willstand on spacer blocks, being high enough that the next largest motor frame can beinstalled when the blocks are removed. This will allow the installation of a larger motorwithout a major disturbance if it should be required.4.9AFFINITY LAWSThe affinity laws are derived from a dimensionless analysis of three important parameters thatdescribe pump performance: flow, total head and power (ref: The Pump Handbook byMcGraw-Hill, chapter 2). The analysis is based on the reduced impeller being geometricallysimilar and operated at dynamically similar conditions or equal specific speed.The affinity laws were developed using the law of similitudes which provide 3 basicrelationships.Flow vs. diameter and speedQ KnD 3or3Q1 n1 D1 Q2 n2 D2 3
4 17PUMP SELECTION, SIZING AND INTERPRETATION OF PERFORMANCE CURVESTotal Head vs. diameter and speedgH Kn2 D2orH 1 n1 D1 H 2 n 2 2 D2 2orP1 n1 D1 P2 n2 3 D2 52235Power vs. diameter and speedPγg Kn3 D5where subscripts 1 and 2 denote the value before and after the change. P is the power, n thespeed, D the impeller diameter, H the total head.If the speed is fixed the affinity laws become:3Q1 D1 Q2 D2 32H 1 D1 H 2 D2 25P1 D1 P2 D2 5If the diameter is fixed the affinity laws become:Q1 n1 Q2 n22H 1 n1 H 2 n2 23P1 n1 P2 n2 3The process of arriving at the affinity laws assumes that the two operating points that arebeing compared are at the same efficiency. The relationship between two operating points,say 1 and 2, depends on the shape of the system curve (see Figure 4-20). The points that lieon system curve A will all be approximately at the same efficiency. Whereas the points that lieon system curve B are not. The affinity laws do not apply to points that belong to systemcurve B. System curve B describes a system with a relatively high static head vs. systemcurve A which has a low static head.
4 18PUMP SELECTION, SIZING AND INTERPRETATION OF PERFORMANCE CURVESFigure 4-20 Limitation on the use of the affinity laws.Diameter reduction To reduce costs pump casings are designed to accommodate severaldifferent impellers. Also, a variety of operating requirements can be met by changing theoutside diameter of a given radial impeller. Euler’s equation shows that the head should beproportional to (nD)2 provided that the exit velocity triangles remain the same before and aftercutting. This is the usual assumption and leads to:Q1 n1 D1 Q2 n2 D222H 1 n1 D1 H 2 n2 2 D2 233P1 n1 D1 P2 n2 3 D2 3Which apply only to a given impeller with altered D and constant efficiency but not ageometrically similar series of impellers.If that is the case then the affinity laws can be used to predict the performance of the pump atdifferent diameters for the same speed or different speed for the same diameter. Since inpractice impellers of different diameters are not geometrically identical, the author's of thesection called Performance Parameters in the Pump Handbook recommend to limit the use ofthis technique to a change of impeller diameter no greater than 10 to 20%. In order to avoidover cutting the impeller, it is recommended that the trimming be done in steps with carefulmeasurement of the results. At each step compare your predicted performance with themeasured one and adjust as necessary.
PUMP SELECTION, SIZING AND INTERPRETATION OF PERFORMANCE CURVES4 19Sizing things up .1. Head is independent of fluid density.2. For fluids other than water, it should be determined if the fluid is Newtonian. Many purefluids are Newtonian (see the table on rheological properties of fluids in Appendix A as astarting point). If the fluid is non-Newtonian, depending on the severity of its departurefrom Newtonian behavior, a centrifugal pump may not be an appropriate pumping device.If the fluid is Newtonian but with a different viscosity than water, apply the correctionfactors to the performance curve suggested by the pump manufacturer (see reference 1and 2).3. Order the pump base with spacer blocks for the motor, allowing the next larger frame tobe installed when the blocks are removed.4. Select a pump size and speed in such a way that the impeller is not close to itsmaximum size (i.e. within 2/3’s of it’s total range) in order to allow for a future increase incapacity. Locate the operating point somewhere between 110% and 80% of the B.E.P.flow.5. During the selection process, if the operating point falls between two performancecurves, by interpolation calculate the exact impeller size required to intersect theoperating point. Impeller size is easily machined down to the correct diameter.6. Determine the total static head corresponding to the highest point of the system andmake sure that it is less than the pump shut-off head.7. Finally, beware using the affinity laws for calculating a new pump diameter or speed forsystems that have a high static head, the affinity laws apply only between two points thatare at the same efficiency.
Figure 4-4 shows only the information relevant to the 8 1/2" impeller performance curve. A performance curve is a plot of Total Head vs. flow rate for a specific impeller diameter and speed. The plot starts at zero flow. The head at this point corresponds to the shut-off head of the pump, point