Transcription
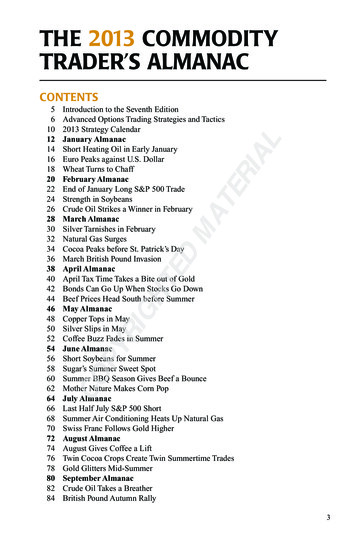
THE 2013 CommoditYTRADER’S ALMANACPYRIGHTEDMATERIIntroduction to the Seventh EditionAdvanced Options Trading Strategies and Tactics2013 Strategy CalendarJanuary AlmanacShort Heating Oil in Early JanuaryEuro Peaks against U.S. DollarWheat Turns to ChaffFebruary AlmanacEnd of January Long S&P 500 TradeStrength in SoybeansCrude Oil Strikes a Winner in FebruaryMarch AlmanacSilver Tarnishes in FebruaryNatural Gas SurgesCocoa Peaks before St. Patrick’s DayMarch British Pound InvasionApril AlmanacApril Tax Time Takes a Bite out of GoldBonds Can Go Up When Stocks Go DownBeef Prices Head South before SummerMay AlmanacCopper Tops in MaySilver Slips in MayCoffee Buzz Fades in SummerJune AlmanacShort Soybeans for SummerSugar’s Summer Sweet SpotSummer BBQ Season Gives Beef a BounceMother Nature Makes Corn PopJuly AlmanacLast Half July S&P 500 ShortSummer Air Conditioning Heats Up Natural GasSwiss Franc Follows Gold HigherAugust AlmanacAugust Gives Coffee a LiftTwin Cocoa Crops Create Twin Summertime TradesGold Glitters Mid-SummerSeptember AlmanacCrude Oil Takes a BreatherBritish Pound Autumn 05254565860626466687072747678808284ALCONTENTS3
41671701731761791821851871904Silver Slumps in OctoberJapanese Yen Dives against the DollarOctober AlmanacPre-Winter Prep Pressures Heating OilSoybean’s Harvest Lows Offer Potential Free MealTwo-Month Yearend Euro RallyNovember AlmanacMassive S&P 500 Gains Halloween to ChristmasLean Hogs Fatten Up before ThanksgivingGold Bugs Get a Treat for the HolidaysBonds Freeze Up in WinterDecember AlmanacEat Your Winter WheatiesCopper Starts to Build a Bullish FoundationBritish Pound Invasion Fades AwaySwiss Franc Trades like Gold2013 Futures And Options Expiration DatesCrack Spread in July Case StudyNOB Spread Case StudySell in May Vertical Bull Call Spread Case StudyPounding the Facts, British Pound Case StudyCommodity Seasonality: Top Percentage PlaysCommodity Seasonality Strategy CalendarCFTC COT Report—Insider’s Look Gives Traders an Edge in the MarketCommodity and Related Securities SpecificationsS&P 500 Cycle, Seasonal Pattern, Trading Guide & Data30-Year Treasury Bond Cycle, Seasonal Pattern, Trading Guide & DataCrude Oil Cycle, Seasonal Pattern, Trading Guide & DataNatural Gas Cycle, Seasonal Pattern, Trading Guide & DataHeating Oil Cycle, Seasonal Pattern, Trading Guide & DataCopper Cycle, Seasonal Pattern, Trading Guide & DataGold Cycle, Seasonal Pattern, Trading Guide & DataSilver Cycle, Seasonal Pattern, Trading Guide & DataCorn Cycle, Seasonal Pattern, Trading Guide & DataSoybeans Cycle, Seasonal Pattern, Trading Guide & DataCBOT Wheat Cycle, Seasonal Pattern, Trading Guide & DataCocoa Cycle, Seasonal Pattern, Trading Guide & DataCoffee Cycle, Seasonal Pattern, Trading Guide & DataSugar Cycle, Seasonal Pattern, Trading Guide & DataLive Cattle Cycle, Seasonal Pattern, Trading Guide & DataLean Hogs Cycle, Seasonal Pattern, Trading Guide & DataBritish Pound Cycle, Seasonal Pattern, Trading Guide & DataEuro Cycle, Seasonal Pattern, Trading Guide & DataSwiss Franc Cycle, Seasonal Pattern, Trading Guide & DataJapanese Yen Cycle, Seasonal Pattern, Trading Guide & Data
JANuary Almanac Stocks AND BondsS&P 500 has shown a tendency to see mild declines after the New Year (page138), as investors sell positions to defer capital gain taxes on profits, but theoverall strength from October can last into April. Traders can look to take advantage of the January break (page 22). This trade has a reliable trend registering a73.3% success rate. 30-year Treasury bond prices have a tendency to continuetheir decline (page 106), as investors are reallocating money into stocks.T F S3 4 510 11 1217 18 1924 25 2631FEBRUARYS M T W T F S1 23 4 5 6 7 8 910 11 12 13 14 15 1617 18 19 20 21 22 2324 25 26 27 28JanuaryStrategyCalendar*TERIJanuary tends to see continued weakness in crude oil (page 143) and in natural gas(page 145) before the typical bottom is posted in February. Traders should preparefor the strongest buy month for oil and natural gas (pages 26, 32, and 124).Heating Oil tends to decline in January into early February 69.7% of the timesince 1980 with the exception of 2011 and 2012 (see pages 14, 124 and 147). MetalsTEDMAGold has a strong history of making a seasonal peak from mid- to lateJanuary into early February. Shorting gold during this time period has resulted in a cumulative profit of 45,480 over the past 38 years (page 124). Silveralso has a tendency to peak in late February and follows gold price weaknessinto March (page 30). Copper tends to respect its seasonal December bottomto show mild strength in January (page 112). GrainsRIGHSoybeans tend to post a low in late January or early February (page 161).Wheat prices tend to see seasonal weakness in January as well (page 18). Infact, this trade boasts a 69.8% success rate, with 30 years up and 13 down.Corn prices tend to buck that trend, as we enter into the new marketing year(page 158). SoftsCOPYCocoa shows signs of strength in January and continues higher until March(page 34). Coffee tends to show a mixed performance in the month of January,giving back some of December’s gains (page 170). Sugar tends to show amixed performance in January, as beet and continued sugar cane harvest in thesoutheast United States and India puts pressure on prices (page 173). MeatsLive cattle prices tend to follow December’s strength (page 176), and hogprices tend to remain under pressure from making any significant moves upuntil March (page 179). CurrenciesThe euro has a short life span since beginning in 1999. However, since inception, it has a stellar trade by going short on the third trading day and holdingfor 24 days. It has been up 11 and registered three losses (page 16). The Swissfranc and the British pound both show a strong seasonal tendency to continuelower from late December. The yen also demonstrates weakness fromDecember into February.12W29162330AL EnergyJANUARYS M T16 7 813 14 1520 21 2227 28 CCLSKCLSSBLSLCLSLHLSBPLSECLSSFLSJYLSME* Graphic representation ofthe Commodity SeasonalityPercentage Plays on pages124–125.L Long Trade, S ShortTrade. See pages 131–137for contract symbols.
DECEMBER 2012/January 2013MONDAY31FN: HG, GC, SI, SLT: HOOf a stock’s move, 31% can be attributed to the general stock market, 12% to the industry influence, 37% to theinfluence of other groupings, and the remaining 20% is peculiar to the one stock.— Benjamin F. King (Market and Industry Factors in Stock Price Behavior, Journal of Business, January 1966)New Years Day (Market Closed)TUESDAY1There’s nothing wrong with cash. It gives you time to think.— Robert Prechter, Jr. (Elliott Wave Theorist)End Long Euro(H) (Oct. 24, 2012)End Long Swiss Franc(H) (Nov. 27, 2012)WEDNESDAY2The principles of successful stock speculation are based on the supposition that people will continue inthe future to make the mistakes that they have made in the past.— Thomas F. Woodlock (Wall Street Journal editor & columnist, quoted in Reminiscences of a StockOperator, 1866–1945)Start Short Heating Oil(J)—69.7% Accuracy Since 1980—End Feb. 15—Page 14THURSDAY3FN: HOOnly those who will risk going too far can possibly find out how far one can go.— T.S. Eliot (English poet, essayist and critic, The Wasteland, 1888–1965)Start Short Euro(H)—78.6% Accuracy Since 1999—End Feb. 8—Page 16Start Short Wheat(N)—69.8% Accuracy Since 1970—End May 8—Page 18FRIDAY4OE: CC, LC, BP, EC, SF, JYWhen I talk to a company that tells me the last analyst showed up three years ago, I can hardly contain my enthusiasm.— Peter Lynch (Fidelity Investments, One Up On Wall Street, b. 1944)SATURDAY5SUNDAY6
Short Heating Oil in Early JanuaryHeating oil prices typically track closely with crude oil prices. After the summer drivingseason is over, refiners focus more on building up inventory levels of heating oil. This drivesboth heating oil and crude oil to a seasonal peak in September followed by a low inDecember. After a brief relief at yearend both oils exhibit weakness in January and February.This sets up a high probability trade. Selling short April heating Oil on the second tradingday of January and holding for 30 days boasts a 69.7% accuracy rate and cumulative gainsof 34,184 dating back to 1980.However, there are times when the byproduct’s pricing decouples from crude oil pricetrends; when inventories for crude oil are inverted due to the demand for the products. Thisoccurs at certain times of the year, typically inJANUARY SHORT HEATING OIL (APRIL)peak heating season, which is defined by the EIATRADING DAY: 2–HOLD: 30 DAYS(U.S. Energy Information Administration) asEntry Exit Profit/October through March.Year Date Close Date Close LossIn fact, this trade did not work in the last twoyears. During both January 2011 and 2012, prices of crude oil declined due to a build in inventories and China’s economy was suspected ofcontracting giving the perception of a decline indemand. At the same time snow storms and frigid temperatures moved into the North East section of the U.S. causing a spike in demand forheating oil.At points A and B in the chart below heatingoil prices spike while crude oil prices movedlower as marked at points B and D. This situationseems to be more of an isolated incidence as ourresearch shows. The lower quadrant of the chartshows the seasonal trend of heating oil, whichshows the typical trend is to decline from Januaryinto mid-February as illustrated at points E and F.The point here is to remember that all years arenot created equal and one still needs to use confirming indicators and risk management whenusing seasonal analysis.1980 1/386.601981 1/6 105.801982 1/591.581983 1/478.691984 1/475.651985 1/368.091986 1/367.311987 1/547.831988 1/548.381989 1/446.671990 1/362.501991 1/365.131992 1/352.751993 1/555.131994 1/445.301995 1/449.331996 1/352.761997 1/365.631998 1/548.381999 1/534.902000 1/562.172001 1/377.212002 1/355.892003 1/382.592004 1/690.292005 1/4 118.912006 1/4 183.192007 1/4 160.862008 1/3 266.662009 1/5 156.252010 1/5 219.962011 1/4 251.532012 1/4 306.482/14 75.502/18 97.852/17 80.962/15 73.132/15 75.642/14 70.662/14 49.002/17 47.642/17 44.822/15 47.232/14 57.262/14 58.302/14 54.152/17 54.462/15 44.162/15 47.022/15 51.912/14 58.832/18 46.102/18 31.562/17 72.172/15 74.102/15 56.102/18 97.322/19 90.132/16 132.352/16 165.352/16 166.652/15 262.492/18 114.142/18 206.222/16 278.092/17 317.7233-Year GainHEATING OIL (HO) BARS AND CRUDE OIL (CL) BARA(Weekly Data August 2010–June 29, 2012)Heating Oil Seasonal Pattern Since 1980Chart courtesy TradeNavigator.com14 4,6623,3394,4602,3354 1,0797,690801,495 2352,2012,869 5882814799703572,8569581,403 4,2001,306 88 6,18767 5,6457,493 2,4321,75117,6865,771 11,155 4,721 34,184
JanuaryMONDAY7Anyone who believes that exponential growth can go on forever in a finite world is either a madman or an economist.— Kenneth Ewart Boulding (Economist, activist, poet, scientist, philosopher, cofounder General Systems Theory, 1910–1993)End Long Wheat(K) (Dec. 7, 2012)TUESDAY8If investing is entertaining, if you’re having fun, you’re probably not making any money. Good investing is boring.— George Soros (Financier, philanthropist, political activist, author and philosopher, b. 1930)WEDNESDAY9No other country can substitute for the U.S. The U.S. is still No. 1 in military, No. 1 in economy, No. 1 inpromoting human rights and No. 1 in idealism. Only the U.S. can lead the world. No other country can.— Senior Korean official (to Thomas L. Friedman NY Times Foreign Affairs columnist, 2/25/2009)THURSDAY10Behold, my son, with what little wisdom the world is ruled.— Count Axel Gustafsson Oxenstierna (1648 letter to his son at conclusion of Thirty Years War, 1583–1654)End Long Corn(N) (Dec. 10, 2012)FRIDAY11OE: KCFor want of a nail, the shoe was lost. For want of a shoe, the horse was lost. For want of a horse, the rider was lost.For want of a rider, the battle was lost. For want of a battle, the kingdom was lost. And all for the want of a nail!— English proverbSATURDAY12SUNDAY13
EURO PEAKS AGAINST U.S. DOLLARThe euro currency was first introduced to the world markets in 1999 and was finally launchedwith bank notes and physical coins in 2002. As of June 2011, the following c ountries use theeuro as their currency: Andorra, Austria, Belgium, Cyprus, Estonia, Finland, France,Germany, Greece, Ireland, Italy, Kosovo, Luxembourg, Malta, Monaco, Montenegro,Netherlands, Portugal, San Marino, Slovakia, Slovenia, Spain, and Vatican City.The European Central Bank dictates monetary policy and puts more emphasis on inflationconcerns rather than on economic contraction.We have seen in the past that the ECB wouldrather maintain steady interest rates than stokethe flames of inflationary pressures. As a result,the ECB is less likely to adjust interest ratescompared to its peers. An ongoing Europeansovereign debt crisis left the ECB with morethan just an interest rate adjustment agenda. Thecrisis has also negatively impacted this trade inthe past two years.JANUARY SHORT EURO (MARCH)TRADING DAY: 3–HOLD: 24 DAYSEntry Exit Profit/Year Date Close Date close Loss1999 1/6 116.422000 1/5 103.692001 1/495.242002 1/489.272003 1/6 104.422004 1/6 127.372005 1/5 132.742006 1/5 121.532007 1/4 131.312008 1/4 147.772009 1/6 134.922010 1/6 144.082011 1/5 131.462012 1/5 127.922/10 113.632/999.452/891.852/887.202/10 107.322/10 126.942/9 127.982/9 119.912/8 130.612/8 144.922/10 128.592/10 137.352/9 137.182/9 132.9014-Year Gain 3,4885,3004,2382,587 3,6255385,9502,0258753,5637,9128,413 7,150 6,225 27,888Despite this wall of worry, seasonallyspeaking, we do see in the 14-year history of theeuro a tendency for prices to head lower against the U.S. dollar on or about the third trading day in January through the first week of February. Theory suggests this has worked inthe past due to the fact that multinational conglomerate corporations based here in theUnited States repatriate funds after the New Year, and this has a tendency to depress pricesin the first quarter.There are several ways to take advantage of this market—in particular, through an ETFthat tracks the euro directly (FXE). By examining the chart below you will see the eurocurrency futures contract mirrors the line chart based on the closing prices of theCurrencyShares euro (FXE). See pages 131–137 for additional correlated trades.Euro (WU) Bars AND CurrencyShares Euro (FXE) Closes(Weekly Data January 2011–june 20, 2012)Euro Seasonal Pattern since 1999Chart courtesy TradeNavigator.com16
JanuaryMONDAY14LT: SAt the age of 24, I began setting clear, written goals for each area of my life. I accomplished more in thefollowing year than I had in the previous 24.— Brian Tracy (Motivational speaker)TUESDAY15OE: SBChance favors the informed mind.— Louis Pasteur (French chemist, founder of microbiology, 1822–1895)WEDNESDAY16OE: CLSmall volume is usually accompanied by a fall in price; large volume by a rise in price.— Charles C. Ying (“Stock Market Prices and Volumes of Sales,” Econometrica, July 1966)THURSDAY17Cooperation is essential to address 21st-century challenges; you can’t fire cruise missiles at the global financial crisis.— Nicholas D. Kristof (NY Times columnist, 10/23/2008)FRIDAY18OE: SPAveraging down in a bear market is tantamount to taking a seat on the down escalator at Macy’s.— Richard Russell (Dow Theory Letters, 1984)SATURDAY19SUNDAY20
WHEAT TURNS TO CHAFFWinter wheat (traded at the CME Group) is typically planted in the September through Octobertime frame. Traders anticipate the crop size, andthis puts pressure on prices. In addition, theSouthern Hemi sphere crops are working throughthe export process, adding new supplies to the market. As the Southern Hemisphere supply is consumed, prices tend to climb until the size and healthof the newly planted crop is known. These eventshelp explain how the seasonal peak is made inJanuary (page 164).Wheat is not a homogeneous crop, due to themany different classes that are grown (i.e. soft redwinter wheat [SRW], hard red spring wheat [HRS],and durum wheat). All have different protein contents and are used for different purposes.SRW has a lower protein content and is usedfor cracker-type products. This is the wheat that isdeliverable through the old CBOT or CME Group.HRS wheat has a higher protein content and is usedin baking products; durum wheat is very high inprotein and is used in pasta and noodles. As winterwheat is planted in the fall, corn is harvested, andwheat that may be used as feed can be substitutedwith less expensive corn, in most years.Traders can look to take advantage of this seasonality by selling on or about January 4 and holding until on or about May 8. This trade has worked30 times in the last 43 years, for a success rate of69.8%. Also consider Ralcorp (RAH), makers ofPost Cereals’ Shredded Wheat and the former“human food” division of Ralston Purina, whichtends to lag the seasonal price swings in Wheat.See pages 131–137 for additional correlated trades.JANUARY SHORT wheat (July)TRADING DAY: 3—HOLD: 85 DAYSEntry Exit Profit/Year Date Close Date Close Loss1970 1/7 138 5/81971 1/6 161 1/81972 1/5 148 1/41973 1/4 235 1/21974 1/4 467 1/21975 1/6 4111976 1/6 355 3/41977 1/5 287 1/41978 1/5 284 1/41979 1/4 313 1/41980 1/4 464 3/41981 1/6 499 3/41982 1/6 412 3/41983 1/5 342 3/41984 1/5 342 3/41985 1/4 330 1/21986 1/6 278 1/41987 1/6 239 1/21988 1/6 319 1/41989 1/5 400 1/41990 1/4 360 1/21991 1/4 271 1/41992 1/6 341 1/21993 1/6 3181994 1/5 342 1/21995 1/5 347 1/41996 1/4 4411997 1/6 346 3/41998 1/6 339 1/21999 1/6 307 1/22000 1/5 2712001 1/4 305 3/42002 1/4 2982003 1/6 311 3/42004 1/6 382 1/42005 1/5 3142006 1/5 358 3/42007 1/5 4772008 1/4 817 1/42009 1/6 6682010 1/6 589 1/22011 1/5 846 1/42012 1/5 664 3/45/08 137 3/8 6350/7 151 3/84885/05 1442135/08 233 1/81195/08 3525,7755/07 312 1/24,9255/06 339 3/48005/09 253 1/21,6885/08 300 1/4 8005/07 356 1/2 2,1635/08 4321,6385/07 433 3/43,3005/07 358 1/22,7135/06 362 3/4 1,0005/07 341 1/2635/07 324 3/42885/07 273 1/42505/07 290 1/2 2,5505/06 307 1/25885/08 418 1/2 9135/07 352 3/43885/07 288 1/4 8505/08 369 3/4 1,4135/07 2931,2505/09 325 1/28505/08 356 3/4 4755/06 556 1/2 5,7755/07 404 1/4 2,8755/08 312 1/41,3635/10 2642,1755/08 268 3/41135/08 266 3/41,9505/08 272 1/41,2885/08 298 1/26635/07 403 1,0385/09 313 1/2255/09 384 3/4 1,30050/9 482 2505/07 807 1/24885/08 5913,8505/10 492 3/44,8385/09 790 1/22,7885/09 6003,23843-Year Gain 26,769cbot wheat (W) bars AND RALCORP (RAH) CLOSES(Weekly Data January 2011–June 20, 2012)Wheat Seasonal Pattern since 1968Chart courtesy TradeNavigator.com18
JanuaryMartin Luther King Jr. Day (Market Closed)MONDAY21You may not have started out life in the best of circumstances. But if you can find a mission in life worthworking for and believe in yourself, nothing can stop you from achieving success.— Kemmons Wilson (Holiday Inn founder)TUESDAY22LT: CLIf there is something you really want to do, make your plan and do it. Otherwise, you’ll just regret it forever.— Richard Rocco (PostNet franchisee, Entrepreneur Magazine 12/2006, b. 1946)Start Long S&P 500(H)—73.3% Accuracy Since 1983—End Feb. 1—Page 22WEDNESDAY23Based on my own personal experience—both as an investor in recent years and an expert witness inyears past—rarely do more than three or four variables really count. Everything else is noise.— Martin J. Whitman (Founder Third Avenue Funds, b. 1924)THURSDAY24FN: CLHistory must repeat itself because we pay such little attention to it the first time.— Blackie Sherrod (Sportswriter, b. 1919)FRIDAY25OE: US, C, S, WNo one ever claimed that managed care was either managed or cared.— AnonymousSATURDAY26SUNDAY27
February Almanac Stocks AND BondsS&P 500 has shown a tendency to decline before Presidents’ Day weekendholiday, and as our seasonal pattern shows (page 138), the S&P 500 tends tocontinue that decline into March in recent years. 30-year Treasury bond prices have a tendency to continue their decline in February, as we hold a shortposition from November (page 106). EnergyCrude oil makes a strong seasonal bottom, registering a whopping 82.8%success rate with 24 gains in 29 years (pages 26 and 126). February markedthe annual low in 2009 and a seasonal low in 2010 and 2011 (page 143).Natural gas also generates a stellar trade from its mid-winter bottom with a72.7% success rate, gaining 16 out of the last 22 years (page 32). Cover ShortHeating Oil from January and look to enter long position on the 8th tradingday headed into mid-April through peak heating season. This trade boasts a78.8% success rate since 1980. MetalsfebruaryS M T W T F S1 23 4 5 6 7 8 910 11 12 13 14 15 1617 18 19 20 21 22 2324 25 26 27 28marchS M T W T F S1 23 4 5 6 7 8 910 11 12 13 14 15 1617 18 19 20 21 22 2324 25 26 27 28 29 3031februaryStrategyCalendar*BSymbolSPLSUSLSGold has demonstrated a tradable seasonal downturn from late February tomid-March (page 124). In 2009, gold peaked at 1013 on February 20 andtraded towards 870 by April 6. Silver tends to make price declines insympathy with gold’s seasonal declines. In the past 40 years, silver hasdeclined 30 years for a 75.0% success rate (page 30). Copper prices tend tomove in the opposite direction of gold and silver. However, the best tradefrom December suggests exiting longs on strength during February on orabout the 25th of the month (page 112).CLLSNGLSHOLSHGLS SSFLSJYLSSoybeans register a recovery rally from January’s break that lasts into the Maypeak. Soybeans have seen price advances from mid-February to late May, 24 outof the last 44 years, for a 54.5% success rate (page 24). Corn has a tendency tomove higher in sympathy with soybeans (page 158). Wheat marches to a different beat and generally sees price declines during February (pages 18 and 164). SoftsCocoa prices tend to pause in February before advancing and peaking out inMarch (page 34). Coffee prices see average gains in February lasting thoughmid- to end of May (page 52). Sugar prices tend to peak in mid-month,triggering a 57.5% win statistic with 23 years out of 40 performing well,including four of the last five years (pages 124 and 173). MeatsLive cattle prices have a tendency to see further price gains following January’sstrength. However, March is a tough month for beef prices. Buyers beware asthe bottom generally does not come until June (page 60). Lean hog prices tendto move lower in February and into March, which is the time when one wantsto be long headed toward Memorial Day weekend (page 179). CurrenciesThe euro tends to be flat during February, but we do see the market correctfrom January’s decline. Our best trade short position is covered on or aboutthe 8th of the month (page 16). The Swiss franc also sees price corrections,and this is the time to cover short positions from the December best trade onor about February 28 (page 116). The British pound tends to remain in adowntrend until mid-March (page 36). Look for continued weakness inFebruary (page 182). The yen posts a secondary low in February, creating along opportunity on or about February 8 through early May (page 124).20ME* Graphic representation ofthe Commodity SeasonalityPercentage Plays on pages124–125.L Long Trade, S ShortTrade. See pages 131–137for contract symbols.
January/FebruaryMONDAY28OE: HO, NG, HG, GC, SITake care of your employees and they’ll take care of your customers.— John W. Marriott (Founder Marriott International, 1900–1985)TUESDAY29LT: NG, HG, GC, SIBut how do we know when irrational exuberance has unduly escalated asset values, which then becomesubject to unexpected and prolonged contractions as they have in Japan over the past decade?— Alan Greenspan (Fed Chairman 1987–2006, 12/5/96 speech to American Enterprise Institute, b. 1926)WEDNESDAY30FN: NGBuy a stock the way you would buy a house. Understand and like it such that you’d be content to own itin the absence of any market.— Warren Buffett (CEO Berkshire Hathaway, investor and philanthropist, b. 1930)THURSDAY31FN: HG, GC, SILT: HOToday’s Ponzi-style acute fragility and speculative dynamics dictate that he who panics first panics best.— Doug Noland (Prudent Bear Funds, Credit Bubble Bulletin, 10/26/07)End Long S&P 500(H) (Jan. 23)FRIDAY1OE: CC, LCThe only function of economic forecasting is to make astrology look respectable.— John Kenneth Galbraith (Canadian/American economist and diplomat, 1908–2006)SATURDAY2SUNDAY3
End of january long S&P 500 tradeThe best six months for owning stocks beginsin November and runs until April. However,after the first trading day in January, the markettends to take a breather. It is at this time that wetend to see some profit taking for tax defermentpurposes.By the third week of the month, we have hadmajor economic reports, such as the employmentsituation and inflation figures; and traders andinvestors have had a chance to regain a celebratory mood, as the Martin Luther King holidayweekend comes to a close. Traders come backfeeling rejuvenated and see the dip in the marketas an opportunity to put money back to work.Buying this “January Dip” has a 73.3% success rate, registering 22 gains with only 8 lossesin its 30-year history. The key is to enter a longposition on or about January 23 and exit on orabout February 1.Even in early 2009, during the worst bearmarket since the Great Depression, this tradegained 2,000. More surprising is the fact thatthis trade’s best performance came in 2008, justas the bear market was beginning in earnest.JANUARY LONG S&P 500 (MARCH)TRADING DAY: 15–HOLD: 7 DAYSentry exit Profit/Year Date Close Date close Loss1983 1/21 143.901984 1/23 167.001985 1/22 177.151986 1/22 202.801987 1/22 276.401988 1/22 248.101989 1/23 286.851990 1/22 331.401991 1/22 329.851992 1/22 419.251993 1/22 436.651994 1/21 473.601995 1/23 468.101996 1/22 613.701997 1/22 791.601998 1/23 964.401999 1/25 1243.502000 1/24 1411.802001 1/23 1366.002002 1/23 1129.002003 1/23 883.002004 1/23 1140.202005 1/24 1166.202006 1/24 1270.402007 1/24 1446.202008 1/23 1341.502009 1/23 823.502010 1/25 1092.602011 1/24 1288.502012 1/24 1311.402/01 143.252/01 165.101/31 180.451/31 213.052/02 277.352/02 255.852/01 299.001/31 330.501/31 344.651/31 408.602/02 443.052/01 479.902/01 471.901/31 637.951/31 787.502/03 1010.702/03 1278.502/02 1415.502/01 1382.502/01 1123.402/03 858.502/03 1133.002/02 1193.202/02 1271.902/02 1453.102/01 1397.102/03 831.502/03 1096.402/02 1300.002/02 1322.7030-Year Gain 163 4758252,5632381,9383,037 2253,700 2,6621,6001,5759506,063 1,02511,5758,7509254,125 1,400 6,125 1,8006,7503751,72513,9002,0009502,8752,825 65,388There are several ways to take advantage ofthis “January Dip”. One is through the futuresmarkets traded at the CME. Stock traders may wish to explore trading the SPDR S&P500 exchange-traded fund (SPY), which allows one to use options. The chart below displays the direct correlation of the front-month S&P 500 futures contract to SPY. Seepages 131–137 for additional correlated trades.s&P 500 (sp) bars AND spdr S&P 500 (SPY) closes(Weekly Data January 2011–june 20, 2012)S&P 500 Seasonal Pattern since 1982Chart courtesy TradeNavigator.com22
FebruaryMONDAY4FN: HO, LCIn the stock market those who expect history to repeat itself exactly are doomed to failure.— Yale Hirsch (Creator of Stock Trader’s Almanac, b. 1923)Start Short 30-Year Bond(M)—65.7% Accuracy Since 1978—End Apr. 10—Page 124TUESDAY5The worst mistake investors make is taking their profits too soon, and their losses too long.— Michael Price (Mutual Shares Fund)WEDNESDAY6The man who can master his time can master nearly anything.— Winston Churchill (British statesman, 1874–1965)End Long Cattle(J) (Jun. 20, 2012)End Short Yen(H) (Oct. 16, 2012)THURSDAY7Try to surround yourself with people who can give you a little happiness, because you can only passthrough this life once, Jack. You don’t come back for an encore.— Elvis Presley (1935–1977)End Short Euro(H) (Jan. 4)Start Long Yen(M)—55.6% Accuracy Since 1977—End May 9—Page 124FRIDAY8OE: KC, BP, EC, SF, JYAn economist is someone who sees something happen, and then wonders if it would work in theory.— Ronald Reagan (40th U.S. President, 1911–2004)SATURDAY9SUNDAY10
STRENGTH IN SOYBEANSSoybeans have seen price advances from midFebruary to the end of May, 24 out of the last 44 years,for a 54.5% success rate. Generally, we have heavierlivestock demand, as animals consume more food during cold winter months. It is well after harvest, andinventories have started to decline. After the New Year,export business begins to pick up again.It is usually after the January crop productionreport that traders get a better indication of what supply estimates are. Transportation during harsh wintermonths can hinder deliveries, causing price spikes. Inaddition, supplies from the Southern Hemisphereregions are at their lowest levels.Another event that can and has weighed in on ourexport business is the value of the U.S. dollar. Sincethe U.S. dollar has been on a massive decline afterreaching a peak in 2002, our exports have been strong.However, sluggish global growth could damper U.S.soybean exports.Soy meal is used as an animal feed and is not astorable commodity. Therefore demand for soy beansto crush into meal is strong during this period.Demand lasts well into May, as we go through theplanting process and potential delays from wet spring.South American harvest gets underway and puts pressure on prices in late May, which is why our exit periodis on or about May 30.Stock traders can consider Bunge Ltd. (BG), oneof the world’s largest soybean crushers, buyers, sellers, transporters, and commercial hedgers, as it trackssoybeans well. See pages 131–137 for add
THE 2013 CommodiTY TRAdER’S ALmANAC CoNTENTS 5 Introduction to the Seventh Edition 6 Advanced Options Trading Strategies and Tactics 10 2013 Strategy Calendar 12 January Almanac 14 Short Heating Oil in Early January 16 Euro Peaks against U.S. Dollar 18 Wheat Turns to Chaff 20 February