Transcription
INVESTINGPraise forHIRSCHCOMMODITY TRADER’S ALMANAC“The Commodity Trader’s Almanac is the best way I know to hit pay dirt while keepingyour hands clean. It’s a unique source of commodity trading history.”— SAM STOVALL, Chief Investment Strategist,Standard & Poor’s Equity Research“Nearly everyone realizes the impact commodities have on our lives, but very few reallyunderstand how seasonality affects pricing. The Commodity Trader’s Almanac helps evena novice understand how commodity pricing works and offers great insight into investingand making money with oil, corn, and wheat. An invaluable tool.”— JON NAJARIAN, cofounder, OptionMONSTER.com“The Commodity Trader’s Almanac is the one source for traders that can both suggestopportunities and also keep them out of trouble. Any seasoned market veteran knows thatevents tend to occur again and again, maybe not exactly as they did before but close enoughso that knowing about them in advance provides an edge. This book is that edge.”— MICHAEL KAHN, CMT, columnist, Barron’s Online, andeditor, Quick Takes Pro newsletter“I’m delighted that the publishers of the Stock Trader’s Almanac have applied their winningformula to the Commodity Trader’s Almanac. I have always maintained that commoditiesdeserve more attention as a separate asset class, and they finally appear to be getting it.Given the tremendous interest in commodity markets in recent years, this book couldn’t bemore timely. I highly recommend it.”— JOHN MURPHY, author of Intermarket Analysis andThe Visual InvestorCover Illustration: Jupiter Images 39.95 USA/ 47.95 CANCOMMODITY TRADER’S ALMANAC 2O11“Whether you’re a struggling novice or a seasoned pro, the Commodity Trader’s Almanacshould be a required read. Pairs traders, basis geeks, and intra-day scalpers will allbenefit from the knowledge collected here by John Person, Jeff Hirsch, and the HirschOrganization—I did!”— TOM SOSNOFF, founder and President, thinkorswimPERSONCOM MODIT YTRADER’SA L M A N A C2O11For Active Traders of Futures,Forex, Stocks, and ETFs
c01 CTA 2011 pgs 12-119 c01 cta 2011 pgs 12-119 7/21/10 2:02 PM Page 1
ffirs CTA 2011 pgs 1-2 ffirs CTA 2011 pgs 1-2 7/19/10 5:04 PM Page 1COMMODITYTRADER’SA L M A N A C2O1Jeffrey A. Hirsch and John L. PersonJohn Wiley & Sons, Inc.1
ffirs CTA 2011 pgs 1-2 ffirs CTA 2011 pgs 1-2 7/19/10 5:04 PM Page 2Copyright 2011 by John Wiley & Sons, Inc. All rights reserved.Published by John Wiley & Sons, Inc., Hoboken, New JerseyPublished simultaneously in CanadaEditorContributing EditorDirector of ResearchGraphic DesignCharts, Data & ResearchAdditional DataAdditional Charts & ResearchJeffrey A. Hirsch, stocktradersalmanac.comJohn L. Person, nationalfutures.comChristopher MistalDarlene Dion mNo part of this publication may be reproduced, stored in a retrieval system, ortransmitted in any form or by any means, electronic, mechanical, photocopying,recording, scanning, or otherwise, except as permitted under Section 107 or 108 of the 1976United States Copyright Act, without either the prior written permission of the Publisher, orauthorization through payment of the appropriate per-copy fee to the Copyright ClearanceCenter, 222 Rosewood Drive, Danvers, MA 01923, 978-750-8400, fax 978-646-8600, or onthe Web at www.copyright.com. Requests to the Publisher for permission should beaddressed to the Permissions Department, John Wiley & Sons, Inc., 111 River Street,Hoboken, NJ 07030, 201-748-6011, fax 201-748-6008.Limit of Liability/Disclaimer of Warranty: While the publisher and the author have used theirbest efforts in preparing this book, they make no representations or warranties with respect tothe accuracy or completeness of the contents of this book and specificallydisclaim any implied warranties of merchantability or fitness for a particular purpose. Nowarranty may be created or extended by sales representatives or written sales materials. Theadvice and strategies contained herein may not be suitable for your situation. You shouldconsult with a professional where appropriate. Neither the publisher nor the author shall beliable for any loss of profit or any other commercial damages, including but not limited tospecial, incidental, consequential, or other damages.Additionally, the risk of loss in trading futures and options can be substantial; therefore,only genuine risk funds should be used. Futures and options may not be suitableinvestments for all individuals, and individuals should carefully consider their financialcondition in deciding whether to trade. For information on the CFTC Disclosure of Riskor the CFTC Consumer A dvisory on Seasonality visit http://www.CFTC.gov htm.For general information about our other products and services, please contact our CustomerCare Department within the United States at 800-762-2974, outside the United States at317-572-3993 or fax 317-572-4002.Wiley also publishes its books in a variety of electronic formats. Some content that appearsin print may not be available in electronic books.For more information about Wiley products, visit our Web site at www.wiley.com. Also visitwww.stocktradersalmanac.com for information about the Commodity Trader’s Almanacand other market data.ISBN 13 978-0-470-55745-7ISBN 10 0-470-55745-110 9 8 7 6 5 4 3 2 1Printed in China2
ftoc CTA 2011 pgs 3-4 ftoc CTA 2011 pgs 3-4 7/19/10 5:05 PM Page 3THE 2011 COMMODITYTRADER’S ction to the Fifth EditionPattern Recognition Improves Trading Results2011 Strategy CalendarJanuary AlmanacShort S&P Into Early January StrengthEuro Peaks against U.S. DollarWheat Turns to ChaffSweet End of January Long S&P 500 TradeFebruary AlmanacStrength in SoybeansCrude Oil Strikes a Winner in AprilSilver Tarnishes in FebruaryMarch AlmanacNatural Gas SurgesCocoa Peaks before St. Patrick’s DayMarch British Pound InvasionApril AlmanacApril Tax Time Takes a Bite out of GoldBonds Can Go Up When Stocks Go DownBeef Prices Head South before SummerMay AlmanacCopper Tops in MaySilver Slips in MayCoffee Buzz Fades in SummerShort Soybeans for SummerJune AlmanacSugar’s Summer Sweet SpotSummer BBQ Season Gives Beef a BounceMother Nature Makes Corn PopJuly AlmanacLast-Half July S&P 500 ShortSummer Air Conditioning Heats Up Natural GasSwiss Franc Follows Gold HigherAugust Gives Coffee a LiftAugust AlmanacTwin Cocoa Crops Create Twin Summertime TradesGold Glitters Mid-SummerCrude Oil Takes a BreatherSeptember AlmanacBritish Pound Autumn Rally3
ftoc CTA 2011 pgs 3-4 ftoc CTA 2011 pgs 3-4 7/19/10 5:05 PM Page 581611641671701731761791821851871904Silver Slumps in OctoberJapanese Yen Dives against the DollarOctober AlmanacSoybean's Harvest Lows Offer Potential Free MealTwo-Month Year-end Euro RallyMassive S&P 500 Gains Halloween to ChristmasCorn Harvest Lows Feed Bulls All Winter and SpringNovember AlmanacLean Hogs Fatten Up before ThanksgivingGold Bugs Get a Treat for the HolidaysBonds Freeze Up in WinterDecember AlmanacEat Your Winter WheatiesCopper Starts to Build a Bullish FoundationBritish Pound Invasion Fades AwaySwiss Franc Trades like Gold2012 Strategy CalendarDirectory of Trading Patterns & DatabankJanuary S&P 500 Break Case StudyJanuary-March Short Euro Case StudyFebruary Long Crude Oil Case StudyMarch Long British Pound Case StudyMay Short Silver Case StudyCommodity Seasonality: Top Percentage PlaysCommodity Seasonality Strategy CalendarCFTC COT Report—Insider’s Look, Trader’s EdgeCommodity and Related Securities SpecificationsSelect Commodity, Currency, and Stock Index ETFsS&P 500 Cycle, Seasonal Pattern, Trading Guide & Data30-Year Treasury Bond Cycle, Seasonal Pattern, Trading Guide & DataCrude Oil Cycle, Seasonal Pattern, Trading Guide & DataNatural Gas Cycle, Seasonal Pattern, Trading Guide & DataCopper Cycle, Seasonal Pattern, Trading Guide & DataGold Cycle, Seasonal Pattern, Trading Guide & DataSilver Cycle, Seasonal Pattern, Trading Guide & DataCorn Cycle, Seasonal Pattern, Trading Guide & DataSoybeans Cycle, Seasonal Pattern, Trading Guide & DataCBOT Wheat Cycle, Seasonal Pattern, Trading Guide & DataCocoa Cycle, Seasonal Pattern, Trading Guide & DataCoffee Cycle, Seasonal Pattern, Trading Guide & DataSugar Cycle, Seasonal Pattern, Trading Guide & DataLive Cattle Cycle, Seasonal Pattern, Trading Guide & DataLean Hogs Cycle, Seasonal Pattern, Trading Guide & DataBritish Pound Cycle, Seasonal Pattern, Trading Guide & DataEuro Cycle, Seasonal Pattern, Trading Guide & DataSwiss Franc Cycle, Seasonal Pattern, Trading Guide & DataJapanese Yen Cycle, Seasonal Pattern, Trading Guide & Data
fbetw CTA 2011 pgs 5-9 fbetw CTA 2011 pgs 5-9 7/19/10 5:03 PM Page 5INTRODUCTION TO THE FIFTH EDITIONWe are especially proud and excited to present the fifth edition of the Commodity Trader’sAlmanac. The research put forth in 2010 had proven to be a valuable resource, and armedwith this book, we are eagerly awaiting the trading opportunities that lie ahead in 2011.Working together we have further improved this book, creating a better tool for helpingtraders and investors become educated and prepared.Inside the Almanac you will find:nSeasonal tendencies and the respective potential risks and rewards.nDetailed statistical data on past market price action.nInsight to several top technical tools to help time your trades.nThe nuances of trading the various aspects of related markets.nAnnual highs and lows for the top commodity markets.nReminder alerts on trades on the calendar pages.nFirst Notice, Last Trade, and Options Expiration on the calendar pages.The Almanac provides a monthly overview of pertinent statistics and highlights theseasonal tendencies of each particular futures market. In total, the Almanac is designed to helppoint traders and investors in the general direction of the normal, natural supply/demandcycle of the market. It highlights specific strategies you may wish to employ, monthly overviews, and historical statistics.Why is a book like this so important? Markets can turn on a dime. A case in point is themarket action in 2010; what a difference a year makes. Look where the stock market was in2009. Most traders and most economists were blindsided by the magnitude of the financialcrisis. But by March 2009, the stock market was rebounding powerfully off the lows of theworst bear market since the 1930s; and by summer, the U.S. economy was recovering fromthe longest and largest contraction since the Great Depression. The Great Recession arguablyended in July 2009 after 20 months.The theme during the first half of 2010 was “Volatility Reigns Supreme.” Case in point,by late April, the S&P 500 stock index was up 9.2% year-to-date. Two weeks later, it wasdown 8.7% from the late April high and negative for the year! One great example is ournew Sugar trade featured on page 58. This just goes to show that traders need to be diversified in commodities or stocks that are correlated to the futures markets. Our mantrathroughout the Almanac is to show readers how to accomplish this.New government regulations may help give stability, but at a cost in lost businessopportunities. This may mute the business environment for 2011 and, perhaps, affect the way thecommodity markets behave. We still expect a volatile ride in the stock, currency, commodity,and financial markets for the next few years.As a result of the government bailouts and increased spending, there is a potential riskfor a rise in the inflation rate. A round of monetary tightening within the next year would notbe surprising. As a result, this could help support the dollar and, at the same time, put pressureon Treasury bond prices.(continued on next page)5
fbetw CTA 2011 pgs 5-9 fbetw CTA 2011 pgs 5-9 7/19/10 5:03 PM Page 6INTRODUCTION TO THE FIFTH EDITION(continued from previous page)Despite the massive rally and volatility in the equity markets, the most amazing thingwas that we did see many of the markets behave within their seasonal supply/demandcycles, as detailed in the 2010 Almanac. Many of the markets we cover, such as S&P’s,crude oil, foreign currencies, grains, softs, and the meat complex, all behaved, relativelyspeaking, amazingly well within their seasonal price moves. We have highlighted some newcase studies on pages 121–125, which will help you to learn how this A lmanac, combinedwith our favorite technical tools, may help you to improve your trade selections for 2011.The 2011 Commodity Trader’s Almanac brings to you several new features. Last year weadded two markets, the S&P 500 stock index futures and the 30-year Treasury bonds.Hopefully, this year’s A lmanac will give you even better guidance on how to invest in theseasset classes.The contract specifications table, which also contains a listing of high-correlating stocksand exchange-traded funds (ETFs) for each commodity on pages 133–138, has beenexpanded to six pages to make room for the additional stocks and ETFs added this year.This should help futures traders and stock traders capitalize on these seasonal tendencies byusing various securities based on the many different patterns and strategies presentedherewith. On page 139, we have refined the selection of ETFs for potential trades in themarkets covered in these pages.The 2011 Almanac provides the statistical information on the seasonal tendencies ofvarious markets and identifies specific trading dates and holding days for each trade.Furthermore, we are sharing some more research from John’s book, Forex Conquered: HighProbability Systems and Strategies for Active Traders, John Wiley & Sons, 2007. On pages 7–9we reveal some of John’s favorite chart pattern recognition techniques that he uses to helpdetermine trade entries, risk, and stop placement.We have also employed some charts and indicators from www.TradeStation.com thisyear. Case studies on pages 121–125 feature TradeStation charts embedded with John’sproprietary indicators. On pages 130–132 our explanation of how traders can gain an edgeusing the COT report is enhanced by a TradeStation chart with John’s own COT indicator.Finally, at the behest of many readers, we have added First Notice, Last Trade, andstandard Option Expiration Days for all 19 markets included in this tome. On the weeklycalendar pages under the date, you will see FN (First Notice), LT (Last Trade), andOE (Option Expiration) followed by the applicable futures contract codes. For example,“FN: HG(U),” is the First Notice Day of the September Copper contract, i.e. “HG” forcopper and “U” for September. Please refer to the contract specification table on pages133–138 for an explanation of all the trading symbols and contract month codes.It is important to remember to use the 2011 Commodity Trader’s Almanac as areference guide and to compare current events against history. We have included the datanecessary to distinguish which years had predominantly bigger price moves and wherecurrent prices and trends are against past historic data.We wish you a healthy and prosperous 2011!John L. Person and Jeffrey A. Hirsch6
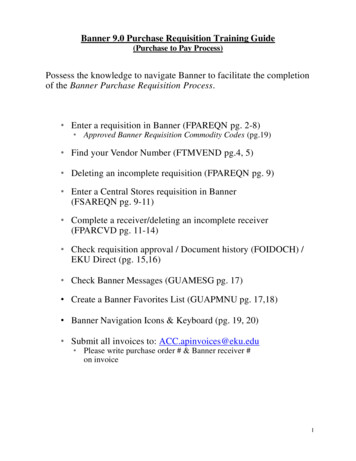
fbetw CTA 2011 pgs 5-9 fbetw CTA 2011 pgs 5-9 7/19/10 5:03 PM Page 7PATTERN RECOGNITIONIMPROVES TRADING RESULTSThere are several chart patterns to follow that can be helpful in determining entryand risk or stop placement. Much of John’s extensive research regarding chartpatterns is taught at private seminars, and in particular, the patterns discussed onthese pages can be found in his third book, Forex Conquered: High ProbabilitySystems and Strategies for A ctive Traders, John Wiley & Sons, 2007. We feel thesepatterns are so effective and vital in helping traders time their entries and exits onpositions that we decided to include them in this year’s A lmanac.PATTERN RECOGNITION TECHNIQUESThe two most basic yet highly effective patterns are the bullish “W” bottom formation and the bearish “M” top formation. You want to be sensitive to these chart patterns due to the higher frequency of occurrences and reliability of their meanings.“W” BOTTOM PATTERNOR 1-2-3 SWING BOTTOM FORMATIONLet us examine the “W” bottom pattern. It is also known as a double bottom with ahigher right side breakout; and, of course, it is similarly dubbed a 1-2-3 swing bottom formation, as shown in Figure 1.The basic premise is that after a period ofdescending prices, the market bounces higherand then “re-tests” the primary low or point 1.Then the market rallies establishing a swinghigh, labeled point 2. Typically after a period oftime, the market sells off making a secondaryhigher low, labeled point 3.FIGURE 1Once the market penetrates the high of point2, this action gives a trader confirmation of atrigger to go long. A general rule I like to teachstudents is you place your sell stop initiallybelow point 3.In Figure 2, we have a 15 minute chart onthe Japanese yen futures contract displaying atypical 1-2-3 bottom pattern. Notice the swing high, labeled Point 2, acts as a resistance. However, once the high has been penetrated just before the 9:00 AM timeframe, the market trades higher.Between 9:00 and 10:00 AM, see how prices react near that price level. The oldhigh established by Point 2 now acts as support. Entering to go long just above thehigh of point 2 and setting your stop below the low of point 3 gave an excellenttrade with a defined risk level.(continued on next page)7
fbetw CTA 2011 pgs 5-9 fbetw CTA 2011 pgs 5-9 7/19/10 5:03 PM Page 8PATTERN RECOGNITION IMPROVES TRADING RESULTS(continued from previous page)FIGURE 2Chart used with permission of TradeStation.com“M” TOP PATTERNOR 1-2-3 SWING TOP FORMATIONThe “M” top is known as a double-top pattern, as illustrated in Figure 3. Generallyafter a prolonged period of rising prices, the market peaks out forming the swinghigh, labeled point 1. Then we see a decline posting a swing low, labeled point 2. Themarket tends to retest the highs but makes a secondary lower high, labeled point 3.Once the market breaks below the low ofpoint 2 that is the trigger to liquidate longs orsell short. For active traders looking to sell shorton this set-up, stops are placed above the high ofpoint 3.Now look at Figure 4. This is a 15 minutechart on the E-mini S&P 500 futures contract.See the prolonged run-up in value that startedin the European session that lasted through theU.S. open. As you can see it was a nice 25.00plus move, with the high established by a shooting star candle pattern or the swing high labeledpoint 1.8FIGURE 3
fbetw CTA 2011 pgs 5-9 fbetw CTA 2011 pgs 5-9 7/19/10 5:03 PM Page 9Then as profit taking and short sellers emerged, the market declined. As themomentum stalled, we formed a swing low at point 2. Now the market starts to rallyto retest the highs and fails, posting a secondary lower high, labeled point 3. Oncethe lows of point 2 are taken out, this is where a trader can sell short using the highabove point 3 as the buy stop loss point or risk level.FIGURE 4Chart used with permission of TradeStation.comThis year’s Almanac includes some new case studies on pages 121–125, usingthese and several other timing tools from last year’s A lmanac and John’s otherbooks. These case studies should give you a better a grasp of how using thepredictive power of timing tools and pattern recognition techniques to determine amarket’s potential high or resistance, or swing high, can help you better time apotential seasonal peak in a particular commodity. Likewise, a predetermined Pivotcalculated support target, or swing low, can help you uncover hidden support for amarket entering a historically seasonal strong period.For more information on timing tools and chart pattern trading techniques,may we suggest you visit John’s website at www.nationalfutures.com, where hehas a Pivot Calculator and further educational material available for free tothe general public. “Commodity Corner Investor Alerts” on Jeff ’s website,www.stocktradersalmanac.com, feature select trades from John and the CommodityTrader’s Almanac.9
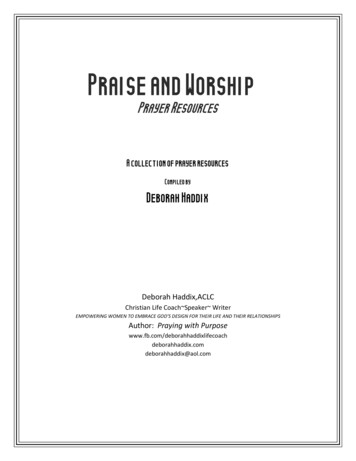
flast CTA 2011 pgs 10-11 flast CTA 2011 pgs 10-11 7/19/10 5:05 PM Page 102011 STRATEGY NDAY293031JANUARY1 New2Yearʼs Day3456789101112131415161718Martin Luther King 1718192021Presidentsʼ Day 22232425262723456101112Saving13DaylightTime Begins18192026272391016172324 14151617181920212223242526MARCHPassoverAsh Wednesday St. Patrickʼs DayJUNEAPRILTax DeadlineGood FridayMarket closed on shaded weekdays; closes early when half-shaded.10SATURDAY28Memorial DayJUNETUESDAY WEDNESDAY THURSDAY27EasterMAYMotherʼs DayFatherʼs Day
flast CTA 2011 pgs 10-11 flast CTA 2011 pgs 10-11 7/19/10 5:05 PM Page 112011 STRATEGY CALENDARMONDAYTUESDAY WEDNESDAY 2131415161718192021222324252627282930311 SEPTEMBER h Hashanah 031123456789101112131415161718192021222324 Thanksgiving 2526272829301 DECEMBER 2345678910111213141516171819202122232425 Christmas2627282930311 NewJANUARYYearʼs DayIndependence Day1AUGUSTElection DayDaylight SavingTime EndsDECEMBERChanukahVeteransʼ Day9NOVEMBERNOVEMBERYom Kippur2OCTOBERColumbus DayOCTOBERSEPTEMBERLabor DayAUGUST5JULYJULY2711
c01 CTA 2011 pgs 12-119 c01 cta 2011 pgs 12-119 7/21/10 2:02 PM Page 11
c01 CTA 2011 pgs 12-119 c01 cta 2011 pgs 12-119 7/21/10 2:02 PM Page 12JANUARY ALMANACu STOCKS AND BONDSLast year we introduced the S&P 500’s tendency to see mild declines afterthe New Year, as investors often sell positions to defer capital gain taxes onprofits, though overall strength from October can last into April. This yearwe introduce the short trade (page 14). Traders can look to take advantageof the January break on the long side (page 20). This trade has a reliabletrend, registering a 71.4% success rate. See January Break Case Study onpage 121. 30-year Treasury bond prices have a tendency to continue theirdecline (page 106), as investors are reallocating money into stocks.u ENERGYJanuary tends to see continued weakness in crude oil (page 145) and in naturalgas (page 147) before the typical bottom is posted in February. Traders shouldprepare for the strongest buy month for oil and natural gas (pages 26 and 32).u METALSGold has a strong history of making a seasonal peak from mid- to lateJanuary into early February. Shorting gold during this time period hasresulted in a cumulative profit of 36,350 over the past 36 years (page 126).Silver also has a tendency to peak in late February and follows gold priceweakness into March (page 28). Copper tends to respect its seasonalDecember bottom to show mild strength in January (page 112).u GRAINSSoybeans tend to post a low in late January or early February (page 161). Wheatprices tend to see seasonal weakness in January as well (page 18). In fact, thistrade boasts a 68.3% success rate, with 28 years up and 13 down. Corn pricestend to buck that trend, as we enter into the new marketing year (page 158).u SOFTSCocoa shows signs of strength in January and continues higher until March(page 34). Coffee tends to show a mixed performance in the month of January,giving back some of December’s gains (page 170). Sugar tends to show amixed performance in January, as beet and continued sugar cane harvest inthe southeast United States and India puts pressure on prices (page 173).u MEATSLive cattle prices tend to follow December’s strength (page 176), and hogprices tend to remain under pressure from making any significant moves upuntil March (page 179).u CURRENCIESThe euro has a short life span since beginning in 1999. However, sinceinception, it has a stellar trade by going short on the third trading day andholding for 24 days. It has been up 11 and only registered one loss (pages 16and 122). The Swiss franc and the British pound both show a strongseasonal tendency to continue lower from late December. The yen alsodemonstrates weakness from December into February.12JANUARYS29162330MT W T F S13 4 5 6 7 810 11 12 13 14 1517 18 19 20 21 2224 25 26 27 28 2931FEBRUARYS MT W T F S1 2 3 4 56 7 8 9 10 11 1213 14 15 16 17 18 1920 21 22 23 24 25 2627 SJYLSBME* Graphic representation ofthe Commodity SeasonalityPercentage Plays on pages126–127.L Long Trade, S ShortTrade. See pages 133–138for contract symbols.
c01 CTA 2011 pgs 12-119 c01 cta 2011 pgs 12-119 7/21/10 2:02 PM Page 13DECEMBER/JANUARY 2011MONDAY27OE: NG(F)Selling a soybean contract short is worth two years at the Harvard Business School.— Robert Stovall (Managing director, Wood Asset Management, b. 1926)TUESDAY28LT: NG(F)OE: HG(F), SI(F)A day will come when all nations on our continent will form a European brotherhood A day will come when we shall see the United States of Europe reaching out for each other across the seas.— Victor Hugo (French novelist, playwright, Hunchback of Notre Dame and Les Misérables, 1802–1885)WEDNESDAY29FN: NG(F)LT: HG(Z), GC(Z), SI(Z)Only those who will risk going too far can possibly find out how far one can go.— T.S. Eliot (English poet, essayist, and critic, The Wasteland, 1888–1965)THURSDAY30FN: S(F)By the law of nature the father continues master of his child no longer than the child stands in need of his assistance;after that term they become equal, and then the son entirely independent of the father, owes him no obedience, but only respect.— Jean-Jacques Rousseau (Swiss philosopher, The Social Contract, 1712–1778)FRIDAY31FN: HG(F), SI(F)LT: LC(Z)A ll great truths begin as blasphemies. — George Bernard Shaw (Irish dramatist, 1856–1950)New Yearʼs Day (Market Closed)SATURDAY1SUNDAY2
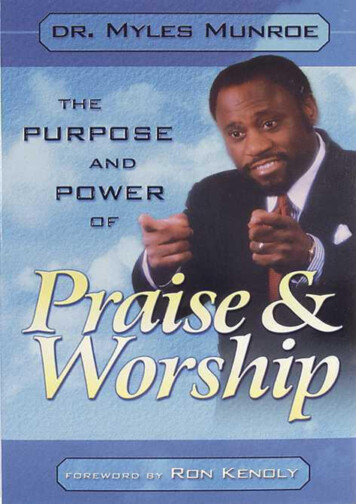
c01 CTA 2011 pgs 12-119 c01 cta 2011 pgs 12-119 7/21/10 2:02 PM Page 14SHORT S&P INTO EARLY JANUARY STRENGTHLast year we first introduced two new products to the Commodity Trader’s A lmanac: the30-year Treasury bond and the S&P 500 stock index futures contracts. The S&P’s were firstlaunched in mid-1982 at the Chicago Mercantile Exchange and have been the premierequity futures contract since. Traders have electronic access to trade what is known as theE-mini S&P 500 contracts (ES), which is the most popular and highly liquid of all the stockindex futures contracts. Since we have such vast research capacity for the overall markets,and since there tends to be a strong seasonal correlation with the overall stock market, wewant to explore a seasonal opportunity to start the year off.Typically the stock market has demonstrated a tendency to retreat after the first of the newyear, especially when there has been a strongfourth quarter gain. Once the new year begins,JANUARY SHORT S&P MARCH (MARCH)we often see a profit taking correction. TheTRADING DAY: 2—HOLD: 12 DAYSpremise for this occurrence is based on the factENTRYEXITPROFIT/LOSSthat investors tend to sell stocks to lock in profits YEAR DATE CLOSE DATE CLOSEin order to defer taxes from capital gains after the 1983 1/4 142.50 1/20 147.65 – 1,288212new year begins. Even though the best time to be 1984 1/4 168.90 1/20 168.05–2,6501/3 167.051/21 177.65long, the overall equity markets lasts from October 19851986 1/3 212.951/21 205.551,850through late April, this January break can certainly 1987 1/5 253.25 1/21 268.90 –3,9123,800give short term traders a nice return. The last three 1988 1/5 259.80 1/21 244.60years have given above average returns. In fact, 1989 1/4 282.90 1/20 288.75 –1,4631990 1/3 361.701/19 342.204,875the two highest historical returns on this trade 1991 1/3 324.15 1/21 332.95 –2,200occurred in 2008 and in 2009.1992 1/3 420.251/21 414.451,450–4251/5 434.601/21 436.30Selling on or about the second trading day of 19931994 1/4 467.501/20 475.30–1,950the New Year and holding for twelve trading ses- 1995 1/4 463.75 1/20 467.30–8883,200sions has provided a spectacular cumulative gain, 1996 1/3 626.95 1/19 614.15since 1983, of 86,300. This trade has worked 16 1997 1/3 757.20 1/21 786.95 –7,4381/5 986.901/22 966.305,150out of the last 28 years, for a success rate of 57.1%. 19981999 1/5 1253.201/22 1232.005,300The graph below is a weekly continuous futures 2000 1/4 1411.80 1/21 1453.70 –10,475175chart of the “big” S&P 500 contract with the 2001 1/3 1359.20 1/22 1358.50E-mini overlaid; the seasonal chart in the bottom 2002 1/3 1166.40 1/22 1121.30 11,2751/3 909.901/22 877.508,100section, showing last year’s price move with the 2003–6,0002004 1/5 1120.001/22 1144.00typical historic price moves, clearly defines the 2005 1/4 1191.00 1/21 1168.605,6002,825January break. Just remember whatever goes up 2006 1/4 1280.50 1/23 1269.20 1,97520071/41427.501/231435.40does not always come down, but the odds do2008 1/3 1458.701/22 1309.3037,350favor a January break after a significant fourth 2009 1/5 927.40 1/22 825.50 25,475quarter rally. See pages 133–138 for additional 2010 1/5 1132.30 1/22 1091.00 10,32528-Year Gain 86,300correlated trades.S&P 500 (SP) BARS AND E-MINI S&P 500 (ES) CLOSES(WEEKLY DATA JANUARY 2009–MAY 2010)S&P Seasonal Pattern since 1982Chart courtesy TradeNavigator.com14
c01 CTA 2011 pgs 12-119 c01 cta 2011 pgs 12-119 7/21/10 2:02 PM Page 15JANUARYMONDAYEnd Long Euro(H) (Oct. 26, 2010)3We were fairly arrogant, until we realized the Japanese were selling quality products for what it cost us to make them.— Paul A. Allaire (Former Chairman of Xerox)Start Short S&P 500(H)—57.1% Accuracy Since 1983—End Jan. 21—Page 14TUESDAY4It is better to be out wishing you were in, than in wishing you were out.
The Commodity Trader’s Almanac helps even a novice understand how commodity pricing works and offers great insight into investing and making money with oil, corn, and wheat. An invaluable tool.” — JON NAJARIAN, cofounder, OptionMONSTER.com “The Commodity Trader’s Almanac is the one