Transcription
Performance Indicators of the Companies QualityManagement Systems with ISO 9001 CertificationLordsleem, A. Jr.(Department of Civil Engineering, Polytechnic School, University of Pernambuco)(email: acasado@upe.poli.br)Duarte, C.(Department of Civil Engineering, Polytechnic School, University of Pernambuco)(email: carol-md@uol.com.br)Barkokébas, B. Jr.(Department of Civil Engineering, Polytechnic School, University of Pernambuco)(email: bedalsht@poli.upe.br)AbstractThe performance measurement has been identified as a key issue for quality management. However,despite the need of controlling and monitoring the processes of quality management systems in orderto attend the normative requirements of certification, the use of indicators is not carried throughsystematically in most construction companies. This article aims to present the results of a researchthat has investigated how the construction companies are measuring their performance and what isthe development stage of the indicators system used by them. The study was conducted with 20certified companies in the Brazilian state Pernambuco, from which it was possible to identify theprocesses belonging to the quality management system and the goals, targets and indicators thatsupport the activities developed by the companies. The research also identified a set of 173 indicatorsdivided into 10 different processes. Other important establishments of the research are associated tomonitoring indicators by the company's direction, the dissemination of results and the use ofindicators. There are still a series of problems involving the process of performance measurement,particularly regarding the definition of indicators and establishment of appropriate targets for them.Keywords: performance measurement, indicators, quality management system567
1. IntroductionThe civil construction industry faces a period of changes. According to Lordsleem Jr, Franco andBezerra (2007), there are new forms of organization and performance in the industry, stronglymarked by the increase of market share, geographical expansion and diversification throughpartnerships, joint ventures, perspectives of public investments in habitation, increase in home loansby banks and entrance of foreign capital.In face of this scene, the companies aim to improve their processes and products as a competitivedifferential. As consequence, it is noticed a greater interest in monitoring the performance ofconstruction firms through the implementation of indicators systems, both by the many participantagents of the enterprise, but also by other stakeholders.There is also an important movement in countries around the world for the accomplishment ofinitiatives in order to compare the performance between companies for the implementation ofbenchmarking. The process of benchmarking is identified as a mechanism that aims support theimplementation of the performance measurement, allowing the evaluation of the company'sperformance comparing to the standards achieved by others, and setting new challenges forcontinuous improvement. Moreover, the indicators directed toward benchmarking make possible thegeneration of values of reference for the sector (COSTA et al., 2005)Given the above, this article aims to describe the research carried out through the data collection froma total of 20 (twenty) construction firms with the certification standards NBR ISO 9001:2000 andConformity Assessment System of Civil Construction Services and Works (SiAC) of the BrazilianProgram for Quality and Productivity in the Habitat - PBQP-H (level A), in the State of Pernambuco.2. Theoretical reviewThe measurement of performance has been identified as a key issue for Quality Management. Severalauthors (LORDSLEEM JR., 2002; LANTELME; FORMOSO, 2003; SOUZA, 2005) emphasize theimportance of measuring performance through indicators for achieving efficiency and effectivenessin the various processes that constitute the production system of the companies.The interest for the implementation of systems of measurement in the civil construction wasintensified with the quality programs based on the requirements of the ISO 9000 standards, as well asthe Brazilian Program of Quality and Productivity in the Habitat (PBQP-H). Particularly, the goals ofquality measured and quantified through indicators, allow to express the evolution of a process,product or business of the company, being basic for monitoring the Quality Management System QMS and, consequently, for the progress of the company.Souza et al. (2005) defines indicators as quantitative expressions that represent specific information,from the measurement and evaluation of a production structure, it processes and/or the resultant568
products.A system of indicators can provide a view of the current performance of a company; for that it mustshow its strengths or weaknesses, or call the attention for its shortcomings. This type of evaluationallows establishing priorities, indicating which sectors of the organization are more important toundergo interventions (Cavalcanti, 2004).The indicators need to have credibility, to be well defined, properly disseminated and systematicallyanalyzed so that can be accepted and become valuable subsidies for decision making. They must beestablished in order to measure not only specific stages of a process, but also to evaluate the overallcompany performance.According Lantelme and Formoso (2003), the civil construction sector in Brazil, already recognizesthe importance of implementing systems for measuring performance. However, the use ofperformance indicators in the construction business has been limited due to many factors, such as:difficulty in establishing and clarifying goals, use of inappropriate measures, and degree ofcommitment of the company to improve the quality, among others.3. Research methodologyThe research methodology used for the achievement of this research was divided into 03 distinctstages, which is:development of operational element (questionnaire) for the identification of performanceindicators and the methodology of data collection inserted in the quality management systemsof the certified construction companies;accomplishment of research with the application of the questionnaire developed in 20construction companies;analysis of the gotten results and assessment of existing indicators.For the initial development of the research, it was carried out to select bibliography of reference forthe necessary theoretical concepts to the subject.4. Data analysis and interpretationThe study involved an investigation using data collection from a total of 20 (twenty) constructionfirms certified under the standards ISO 9001:2000 and Conformity Assessment System of CivilConstruction Services and Works (SiAC) of the Brazilian Program for Quality and Productivity in theHabitat - PBQP-H (level A), in the State of Pernambuco.The analysis of the collected data was sub-divided into three different stages:569
1 – Analysis of Quality Management System (QMS) processes;2 – Indicator management;3 – Objectives, indicators and goals of the Quality Management System.The requirements were to complete a questionnaire for data collection; a macro-flow of thecompanies’ processes; the matrix worksheet of indicators, objectives and goals, and some resultsfrom measuring the indicators.The specific analysis of the indicators was undertaken based on the provision of such information. Itshould be stressed that the majority of the firms did not have all the data necessary for the detailedstudy of the indicators, and five firms - corresponding to 25% of the sample studied - had no data atall.The construction firms participating in the study operate in the construction and incorporation ofbuildings; 100% are certified under the ISO 9001:2000 standard; while 90% have the PBQP-Hcertification awarded by SiAC. The companies without the SiAC certification did not renew theirPBQP-H certification, the earlier version of which was called SiQ-C.4.1 Quality management system processesTable 1 lists what are considered to be the main processes in the macro-flows comprising the QMS ofconstruction firms participating in the research.Table 1: Processes identified in macro-flows of companiesProcessesIndicators by processCommercial38Human resources9Production chnical assistance19Training5570
In general it was possible to identify 173 indicators, stressing the quantity of 62 indicators relating tothe works process and 38 indicators to the commercial process, the processes being most consideredas indicators.It was also possible to ascertain from the results of the study that two firms had indicators for thesafety and environment management process included in the performance measurement system of thequality management system.This aspect demonstrates, albeit incipiently, the concern of these firms to use the methodologyadopted in the QMS for collecting indicator data for overall business management.Among the companies studied, 20% said that they had unidentified processes in their macro-flows.These processes are shown in Table 2, stressing that all processes unidentified in the macro-flows areconsidered by the companies as support processes, and only four are monitored using performanceindicators.Table 2: Processes unidentified in macro-flows of companiesUnidentified process in the macro-flowsProcess monitored byperformance eXControl of quality documents, data and recordsXFinanceXInternal auditXTreasuryXAccountingXReformsXSome processes in Table 2 had already been listed by other companies, as shown in Table 01, asfollows: supplies, training and finance.The following justifications were listed by the companies for not including them in these processesidentified in the macro-flow of their QMS:the processes only attend to the main processes indicated in the macro-flow;the processes were associated with all other processes;571
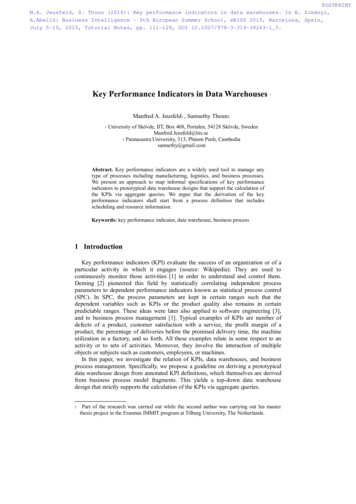
the processes were not processes directly linked to quality.In the general analysis about processes of the quality management system, it is worth mentioning: thehigh quantity of indicators for monitoring some processes (works and commercial) in detriment toother processes (namely, the design process); the difficulty of companies to rate the process as a mainor support process, and the existence of indicators for processes considered by the companies assupport.4.2 Management of quality management system indicators4.2.1 Follow-up of indicators by company administrationConcerning the administration’s follow-up of the results of the indicators, 55% of the firmsparticipating in the survey stated that all indicators are periodically accompanied by theadministration. However, 20% of the firms mentioned that only some indicators are accompanied bythe management.Figure 1 shows the percentage of follow-up frequency of indicators by the administration of thecompanies.Figure 1: Follow-up frequency of indicators by company administrationThe results in Figure 1 demonstrate that the hierarchy of following up the indicators by the companyadministration is as follows: every month, every six months and weekly/quarterly/annually.4.2.2 Disseminating the construction firm resultsThe main forms of disseminating indicator results by the companies to the collaborators of eachprocess are listed below:monthly meetings with office employees and onsite administration team;e-mailing monthly reports, when in the office, and onsite by fixing them to a wall panel forthe indicators;572
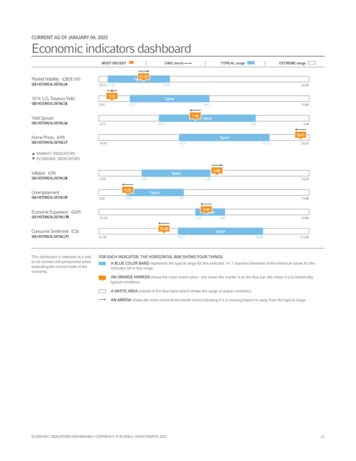
e-mailing the results;weekly issue of report to each collaborator;use of the quality wall panel;networking availability (intranet);holding weekly and/or monthly meetings.The above indicated alternatives reveal which media are mainly used by the companies for internalcommunication of the indicators.In general, it is apparent that the companies are concerned with disseminating the indicator results,making them more accessible to the collaborators.4.2.3 Use of indicators by construction firmsThe study with regard to the use of performance indicators by the companies showed that 15% ofthem already use indicators even before adopting a Quality Management System. The absolutemajority of the firms, that is, 75%, only began using indicators after adopting the QMS.In terms of comparing the results, Figure 2 shows the percentage values of the alternatives relating tothe comparative analysis of the indicators by the companies.Figure 2: Comparative analysis of indicators by companiesThe graph in Figure 2 shows that most companies (55%) compared the results of their indicators withtheir own company’s historic indicators and indicators available in the market, while 40% of thecompanies compared them only with the results existing in their own company.573
4.2.4 Decisions based on indicatorsThe company administrations took the following decisions as a result of monitoring the resultsobtained using the indicators:change in procedures in order to reduce waste;technical staff enhancement;periodical monitoring of appropriations;need to create new indicators and change in collection methodology of existing indicators;marketing actions based on the result of the Sales Velocity Indicator (SVI);alteration in designs to make improvements;change suppliers.The decisions relate to the different processes identified in the firms’ macro-flow. It should bepointed out that the decisions were taken within a context experienced by the construction firm at acertain time, and this must be understood in order to be adopted as a benchmark for other companies.As a general analysis on the management of indicators of the companies’ quality managementsystem, emphasis is given to analyzing the compatibility of the indicator’s speed of response with thedecision taken by the administration, the relevance of the indicators to the administration, and eventhe need for monitoring them by the companies.4.2.5 Objectives, indicators and goals by processes of quality management systemFrom data provided by the companies participating in the study, the results relating to the objectives,indicators and goals were organized by processes in order to synthesize the collected information. Itshould be mentioned that the data was provided by a group of 15 out of the 20 companiesparticipating in the survey.We found that some companies do not define their indicators by process. Therefore, it was necessaryto undertake a specific analysis of each macro-flow provided in order to properly fit these indicatorsto one of the processes relating to the quality management systems of the companies.A total of 173 indicators in 10 different processes were identified, and the structured collected datastructured closely to those provided by the participating construction firms.Chart 01 shows some objectives, goals and indicators of the works process, organized and set out foreasier analysis of the indicators.574
Chart 1: Objectives, goals and indicators of the works processNºObjectiveIndicatorGoal1To reduce future problems withFinal works inspectiontechnical assistanceSeven (7) defective itemsper unit in inspectionperiod2To reduce waste in the worksand increase productivityChecking sub-floor thicknessTo reach averagethickness of 3 cm3To reduce waste in works andincreased productivityChecking thickness of externalcoating in a single massTo reach averagethickness of 4 cm4To minimize mortarconsumption per m² and checkbrick consumption per m²Checking bricklaying servicesMortar consumption (toreach 12 kg/m²); brickconsumption (to reach 25bricks per m²)5To create a better workingenvironmentEmployee satisfaction levelTo achieve an internalsatisfaction rate of 80%6To add new technologyNumber of new technologies 1 per year7To reduce ratio betweennumber of errors found andnumber of items inspected inchecking services of thoseperformed by bricklayers(Number of items rejected/number of items inspected) * 100To achieve a 10% ratio orless8To reduce waste of structuralconcreteTotal volume used in paving/totalvolume calculated in blueprintTo reduce by half waste ofstructural concrete inworks in the pastChart 1 presents a sample of eight indicators identified in this work. It was possible to observe someaspects:some indicators do not meet the goals they were set, as is the case for indicators 2 and 3,which aims to reduce waste in the construction and increase productivity. Both the indicatorand the target were defined only for measuring the thickness, so not measuring productivity;in some cases, the targets presented are broad, or even defined. This is the case of indicator 7presented in Chart 1, which aims to monitor the productivity of services through the RUP Unitary Reason of Production, however without a goal set.575
Chart 2: Objectives, goals and indicators of the Supplies processNºObjectiveIndicatorGoal1Control number of nonAnalysis of non-conformitiesconformities found in materials verified in the Materials receivedper monthformKeep directors informedmonthly2Getting a better qualification ofSuppliers EvaluationsuppliersOnly 5% of the suppliersevaluation consideredunsatisfactory3Reduce the amount ofpurchased materials[(R total budgeted - R totalpurchased)x100]/Total budgetedReduce 5%4Deadlines purchaseCheck the time table supplyNo delay5Control the number ofequipment repaired in themonth-Keep directors informedmonthly6-Number of requests out of date /number of requests in the monthRequest for 95% of thematerials within the timelimitsChart 2 presents some goals, indicators and targets of the suppliers process. Some flaws in themeasuring performance systems could be also identified, for example:there is no target set appropriately for the indicator 1, which aims to control the number ofnon-conformities found in materials in a month;there is also an inadequate characterization of some indicators, including the failure to defineit (goal 5 of Chart 2);indicators defined without a specific goal, such as the indicator 6 (number of requests out ofdate / number of requests in the month).In the same way, it was ordered and subsequently analyzed all 173 indicators divided in the tenprocess identified by the survey. Chart 1 and 2 show a small sample of all indicators examined,depicting important aspects identified in the whole sample of indicators.It is important to note that the full details of this survey will be available in the document beingedited by the Union of Construction Industry in the State of Pernambuco (Sinduscon / PE).5. ConclusionThe article herein shows the results of the survey designed to discover how civil construction firmsare measuring their performance. From this study it was possible to collect and process key data576
relating to the performance indicators used by certified construction firms in the State ofPernambuco.From the detailed analysis of the collected indicators, it was possible to ascertain that mostcompanies in the study are concerned to establish indicators for each process relating to their qualitymanagement systems. We also found that there was an initiative, albeit by the minority of thecompanies under study, to use indicators defined in specific bibliographies and reference values forcomparing performance.Some problems were found in the performance measurement systems analyzed, such as, for example,problems in aligning indicators with their objectives and fitting them properly in their processes.One of the main failures in the indicator systems under analysis concerns the inadequatecharacterization of the indicator itself. In many cases, not only was there a lack of definition inperiodicity for collection but also of clear goals.The following aspects were found in an overall analysis relating to the collected indicators:the existence of similar indicators included in different processes. On the other hand, thereare also similar objectives, but with different indicators;it is necessary to analyze the suitability of some indicators to the objectives, since they didnot reflect the set purpose;some very open goals which need to be more clearly demarcated.Lastly, it is worth mentioning that the research was able to collect, process and organize key datarelating to the indicators used by certified construction firms in the State of Pernambuco. After beinganalyzed and properly used, the result will be a modification (quantitative or qualitative) in theunderstanding of the information system of the companies.6. ReferencesCAVALCANTI, R.F.V. (2004) Uma investigação sobre medidas de desempenho utilizadas pelasempresas de construção civil, subsetor edificações, na região metropolitana de Recife. Dissertação(Mestrado) - Programa multiinstitucional e inter-regional de Pós-Graduação em Ciências Contábeis,UnB, UFPB, UFPE, URFN, BrazilCOSTA, D.B. et al. (2005) Sistema de Indicadores para benchmarking na construção civil: manualde utilização. Federal University of Rio Grande do Sul, Brazil.LANTELME, E. M. V., FORMOSO, C.T. (2003) Conceitos, princípios e práticas da medição dedesempenho no setor da construção civil. In: FORMOSO, C. T.; INO A. (ed.) Inovação, gestão da577
qualidade & produtividade e disseminação do conhecimento na construção habitacional. Rio deJaneiro, ANTAC, v.2: 255–281.LORDSLEEM JR., A.C (2002) Metodologia para capacitação gerencial de empresassubempreiteiras. Tese (Doutorado) - Escola Politécnica, University of São Paulo, Brazil.LORDSLEEM JR., A.C.; FRANCO, L.S.; BEZERRA, N.M. (2007) Tecnologia construtiva daalvenaria de vedação em edifícios de múltiplos pavimentos: avaliação e análise de resultados.Recife, Brazilian Portland Cement Association (ABCP).SOUZA, R.; MEKBEKIAN, G.; SILVA, M.A.C.; LEITÃO, A.C.M.T.; SANTOS, M.M. (1995)Sistema de gestão da qualidade para empresas construtoras. São Paulo, Editora Pini.SOUZA, U.E.L. (2005) Como reduzir perdas nos canteiros. São Paulo, Editora Pini.578
Performance Indicators of the Companies Quality Management Systems with ISO 9001 Certification . Lordsleem, A. Jr. (Department of Civil Engineering, Polytechnic School, University of Pernambuco) (email: acasado@upe.poli.br) Duarte, C. (Department of Civil Engineering, Polytechnic Schoo