Transcription
Technical Analysis MasterClass Cheat-SheetTECHNICAL INDICATORSThe study of Technical analysis is done with the help of Technical Indicators, There are manyindicators in the market which can be used to indicate the momentum, the trend, volatility etc. ofthe market.Technical indicators are based on mathematical equations that produce a value that is then plottedon your chart. Technical indicators are the interpreters of the market. They look at price informationand translate it into simple, easy-to-read signals that can help you determine when to buy and whento sell.Each technical indicator provides unique information and one can use as many indicators incombination as they can but too many indicators when used in combination can generateambiguous signals, So we should focus on handful of indicators in combination and keep checkingother’s as and when one wants to.Technical indicators look at historical price data, they are not guaranteed to know anything definiteabout the future.Technical indicators are divided into the following categories:1.Lagging Indicators: Lagging Indicators lag the prices and are also known as trend followingindicators as they follow the price action. They are designed to keep traders in and keep them in tillthe trend is intact. They work best in trending markets and are not effective in sideways markets.2.Leading Indicators: Leading Indicators lead the prices and price follow the movement in suchindicators. They generate early entry and exit signals and allow more opportunities to trade.Jyoti Bansal - Certified Technical Analyst ( NCFM ), Investment Advisor ( NISM )11
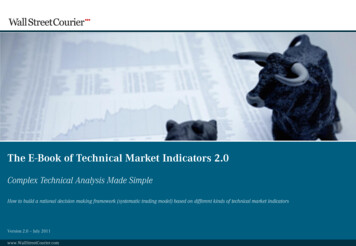
Technical Analysis MasterClass Cheat-SheetMOVING AVERAGEMoving averages are the most basic trending indicator. Moving average show what direction theprice is going and where the levels of support and resistance may be. Moving averages themselvescan serve as both support and resistance.Simple Moving averages (SMA) are calculated by finding the average closing price of an asset at anygiven time and then plotting the points on a price chart. The volatility of a moving average can beadjusted by adjusting the time frame of the indicator.An N-day Simple Moving Average is calculated by calculating the average of N most recent pricesCalculations:When to use SMA smoothens the price movements and hence is more helpful to identify trends. Short term SMAsreact faster to prices than longer term SMAs. When short-term moving average crosses above thelonger term moving average it gives a buying signal and indicates the beginning of an uptrend andvice versa.Jyoti Bansal - Certified Technical Analyst ( NCFM ), Investment Advisor ( NISM )22
Technical Analysis MasterClass Cheat-SheetEXPONENTIAL MOVING AVERAGE (EMA)The exponential moving average is very similar to Simple Moving Average. But it assigns moreimportance to latest data and reduce the lag. Exponential moving average can be calculated byassigning weights to the data points under considerations, such that a more recent data point getsan exponentially higher weight than older data pointsCalculations:When to use Exponential Moving Average is used in the same way as the Simple Moving Average, but being thatEMA reacts faster to recent price values than the simple moving average. Which moving average youuse will depend on your trading and investing style. EMA is also used for calculation of many otherindicators, like Moving Average Convergence Divergence (MACD) etc.Jyoti Bansal - Certified Technical Analyst ( NCFM ), Investment Advisor ( NISM )33
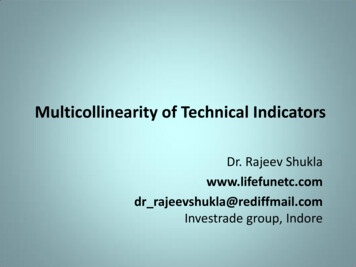
Technical Analysis MasterClass Cheat-SheetMOVING AVERAGE CONVERGENCE DIVERGENCE (MACD)The moving average convergence divergence (MACD) is a trend following momentum indicator andit is a lagging indicator that can show you when trading momentum changes from being bullish tobearish and from being bearish to bullish. The MACD also tells when traders are becomingoverextended, which usually results in a trend reversal.Moving Average Convergence Divergence (MACD) is the difference between a fast and a slowexponential moving average. Typically, 12 and 26 days EMAs are used. MACD is the differencebetween the values of these two EMAs. A signal line is formed by calculating the EMA (typically9day) of the MACD. The difference between MACD and the signal line is calculated and plotted as ahistogram.Calculations:When to use The most common signal is MACD crossing over the signal line. A buy signal is generated whenMACD crosses above the signal line, whereas a sell signal is generated when it crosses down throughthe signal line. Since the histogram is the difference between the MACD and the signal line, it helpsyou identifying this crossover. Buy/Sell signals are also generated by divergences (A divergence issaid to exist if the price and the indicator moves in opposite direction). A positive divergence ariseswhen the price makes a low or moves sideways, but the MACD move in upward direction. You canchange the settings of MACD as per the set of moving average combination that you want to use.Jyoti Bansal - Certified Technical Analyst ( NCFM ), Investment Advisor ( NISM )44
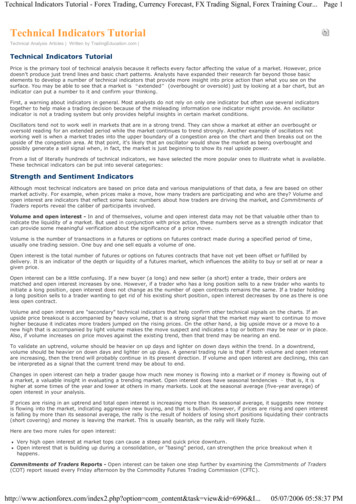
Technical Analysis MasterClass Cheat-SheetRELATIVE STRENGTH INDEX (RSI)RSI is a price following oscillator, whose value oscillates between 0-100 and calculated based onrelative strength. It is a measure of momentum. An N-period relative strength is the ratio of gains inthe price in last N days, divided by the losses in last N days.Calculations:When to use When RSI crosses above the level of 50 it is a bullish signal and vice versa, when RSI crosses above70 in uptrend it can stay there for extended period and When RSI crosses below 30 negativemomentum gets stronger. Higher values of RSI indicate overbought market; whereas low valuesindicate oversold market. 30 and 70 are usually set as thresholds for a buy and sell signalrespectively. Buy/Sell signals are also generated by observing divergence between security andindicator (A divergence is said to exist if the price and the indicator moves in opposite direction).Underlying security usually reverses the direction and follows the direction of the indicator.Jyoti Bansal - Certified Technical Analyst ( NCFM ), Investment Advisor ( NISM )55
Technical Analysis MasterClass Cheat-SheetSTOCHASTICThe stochastic oscillator is a momentum indicator developed by George Lane that can show youwhen investor’s sentiment changes from being bullish to bearish and from being bearish to bullish. Itmeasures price momentum to identify overbought/oversold conditions, which gives entry or exitdecisions. When stoicism forms narrow top, it indicates weakness bulls and when it forms a narrowbottom it indicates a weakness bear.The stochastic indicator is plotted as two lines, %K and %D. The range of the stochastic oscillator isbetween 0 and 100. The lower reversal zone is the area of the indicator that is below 20. When %K isabove 80, it shows the prices may be overbought and may be reversing trend shortly. When %K isbelow 20, it shows the prices may be oversold and may be reversing trend shortly. When %K linecrosses above %D line , buy signal is generated and When %K line crosses below %D line , a sell signalis generated.Calculations:% K 100 [{C - L (n)} / {H (n) - L (n)}] where C is the current close,L (n) is the low of the (n) period, and H (n) is the high of the (n) day period.% D a moving average of % K for the specified period.When to use Stochastic can be used with several interpretations: among them are divergences, crossovers, andoverbought/oversold. Signals of stochastic are to be used in conjunction with trend followingindicator. In a strong trending market stochastic can fail completely. When the %K line rises abovethe %D line it is considered bullish, and when the %K line falls below the %D line, it is consideredbearish. A buy signal is generated when either line dips below and then rises above 20, or a bearishsignal is generated when either line rises above and then dips below 80.You can eliminate some false signals by using only the signals that correspond to the direction of theintermediate- to long-term trends.Jyoti Bansal - Certified Technical Analyst ( NCFM ), Investment Advisor ( NISM )66
Technical Analysis MasterClass Cheat-SheetFIBONACCI RETRACEMENT (FR)Fibonacci retracement levels are used as support or resistance levels and they are computed usingthe Fibonacci ratio. Fibonacci ratios derived from Fibonacci series (0, 1,1,2,3,5,8,13 .). The variousFibonacci ratios are 0.236, 0.382, 0.500, 0.618, etc. It Plots percentage retracement lines based uponthe mathematical relationship within the Fibonacci sequence. These retracement levels providemultiple support and resistance levels that can be used to target price objectives.Based upon the number sequence, a set of percentage retracements have been developed thatidentify important support or resistance areas. These are 23.6%, 38.2%, 50%, 61.8%, 76.4%, and100%. Applying these percentages to the difference between the high and low price for the periodselected generates a set of price objectives with regard to each retracement level. The theory ofFibonacci retracements states that after a period of market movement in one direction (up ordown), prices retrace a significant portion of the previous trend before resuming the move in theoriginal direction. These countertrend moves tend to fall into certain predictable parameters, whichare often the Fibonacci Retracement levels.When to use Prices tends to stop frequently at Fibonacci Retracement Levels, each of the retracement levelspresent themselves as possible reversal points. Traditionally 50% was used for retracements, but the38.2 and 61.8 Fibonacci levels, which many equate to 33% (1/3rd) and 67% (2/3rds), are also theimportant levels and are seen very often in the markets. These levels can best be used in conjunctionwith other technical signals. For i.e. selling a bounce in a strong downtrend that rallies up to aFibonacci Retracement Level at the same time that the market becomes overbought and is alsotouching its near-term downtrend line.Jyoti Bansal - Certified Technical Analyst ( NCFM ), Investment Advisor ( NISM )77
Technical Analysis MasterClass Cheat-SheetBOLLINGER BANDSBollinger bands is commonly used volume indicator, created by John Bollinger, that can show younot only what direction prices are going but also how volatile the price movement is. Bollinger bandsconsist of two bands—an upper band and a lower band—and a moving average that are generallyplotted on the price movement of a chart.Bollinger bands are typically based on a 20-period moving average. This moving average runsthrough the middle of the two bands. The upper band is plotted 2 standard deviations above the20period moving average. The lower band is plotted 2 standard deviations below the 20periodmoving average.When to use 1) Sharp price changes tend to occur after the bands tighten, as volatility lessens.2) When prices move outside the bands, a continuation of the current trend is implied.3) Bottoms and tops made outside the bands followed by bottoms and tops made inside the bandscall for reversals in the trend.Jyoti Bansal - Certified Technical Analyst ( NCFM ), Investment Advisor ( NISM )88
Technical Analysis MasterClass Cheat-SheetACCUMULATION / DISTRIBUTION (AD)It is a momentum indicator that tracks the relationship between price and volume and acts as aleading indicator. It attempts to gauge supply and demand by determining whether investors aregenerally "accumulating" (buying) or "distributing" (selling) a certain stock by identifying divergencesbetween stock price and volume flow.Calculations:"Close Location Value" or CLV is a value based on the location of the close, relative to the range forthe period. The CLV ranges from plus one to minus one with the center point at zero.The CLV is then multiplied by the corresponding period's volume and the cumulative total forms theAccumulation/Distribution Line.When to use A bullish signal is given when the Accumulation/Distribution Line forms a positive divergence and abearish signal is considered when it forms a negative divergence. Stop loss should be placed belowthe most recent low or high respective to the trade.Jyoti Bansal - Certified Technical Analyst ( NCFM ), Investment Advisor ( NISM )99
Technical Analysis MasterClass Cheat-SheetCHAIKIN OSCILLATORThe Chaikin Oscillator was developed by Marc Chaikin. It is based on the assumption that volumeand price normally rise and fall together. When this relationship changes, a possible change in theprice trend may result.The Chaikin Oscillator is calculated as follows:Chaikin Oscillator (3 day simple moving average of the ADL) - (10 day simple moving averageof the ADL)ADL [(close - low) - (high - close)] * Volume) Where ADL Accumulation/Distribution line(high - low)When to use 1.There are two ways in which the Chaikin Oscillator is used. The most important signal isdivergence between prices and the oscillator: when prices reach a new high or low in a trend andthe oscillator fails to exceed its previous extreme reading and then reverses direction.2.A second way to use the oscillator is to note changes in direction. BUY signals are givenwhen the price of the security is above its 14-day moving average, the Oscillator turns upward froma negative value. SELL signals are given when the price of the security is below its 14-day movingaverage, the Oscillator turns downwards and the value of the Oscillator is positive.Jyoti Bansal - Certified Technical Analyst ( NCFM ), Investment Advisor ( NISM )1010
Technical Analysis MasterClass Cheat-SheetPARABOLIC SAR (PSAR)Parabolic SAR (PSAR) was developed by J. Welles Wilder Jr. and helps in determining the entry andexit points. SAR stands for Stop and Reverse. SAR computes stop loss levels using previous day’sdata.Some of the concepts in PSAR computation are:Extreme price: This is the highest price recorded to date d
Technical indicators look at historical price data, they are not guaranteed to know anything definite about the future. Technical indicators are divided into the following categories: 1. Lagging Indicators : Lagging Indicators lag the prices and are also known as trend following indicators as they follow the price action. They are designed to keep traders in and keep them in till the trend is .