Transcription
POSTPRINTM.A. Jeusfeld, S. Thoun (2016): Key performance indicators in data warehouses. In E. Zimányi,A.Abelló: Business Intelligence - 5th European Summer School, eBISS 2015, Barcelona, Spain,July 5-10, 2015, Tutorial Notes, pp. 111-129, DOI 10.1007/978-3-319-39243-1 5.Key Performance Indicators in Data Warehouses1Manfred A. Jeusfeld1 , Samsethy Thoun21University of Skövde, IIT, Box 408, Portalen, 54128 Skövde, SwedenManfred.Jeusfeld@his.se2 Pannasastra University, 313, Phnom Penh, Cambodiasamsethy@gmail.comAbstract. Key performance indicators are a widely used tool to manage anytype of processes including manufacturing, logistics, and business processes.We present an approach to map informal specifications of key performanceindicators to prototypical data warehouse designs that support the calculation ofthe KPIs via aggregate queries. We argue that the derivation of the keyperformance indicators shall start from a process definition that includesscheduling and resource information.Keywords: key performance indicator, data warehouse, business process1 IntroductionKey performance indicators (KPI) evaluate the success of an organization or of aparticular activity in which it engages (source: Wikipedia). They are used tocontinuously monitor those activities [1] in order to understand and control them.Deming [2] pioneered this field by statistically correlating independent processparameters to dependent performance indicators known as statistical process control(SPC). In SPC, the process parameters are kept in certain ranges such that thedependent variables such as KPIs or the product quality also remains in certainpredictable ranges. These ideas were later also applied to software engineering [3],and to business process management [1]. Typical examples of KPIs are number ofdefects of a product, customer satisfaction with a service, the profit margin of aproduct, the percentage of deliveries before the promised delivery time, the machineutilization in a factory, and so forth. All these examples relate in some respect to anactivity or to sets of activities. Moreover, they involve the interaction of multipleobjects or subjects such as customers, employees, or machines.In this paper, we investigate the relation of KPIs, data warehouses, and businessprocess management. Specifically, we propose a guideline on deriving a prototypicaldata warehouse design from annotated KPI definitions, which themselves are derivedfrom business process model fragments. This yields a top-down data warehousedesign that strictly supports the calculation of the KPIs via aggregate queries.1Part of the research was carried out while the second author was carrying out his masterthesis project in the Erasmus IMMIT program at Tilburg University, The Netherlands.
A data warehouse consists of multi-dimensional facts representing measurableobservations about subjects in time and space. The subjects, time and space areforming the dimensions, and the measures are representing the observations about theparticipating subjects. A data warehouse is essentially a large collection ofmeasurements covering a certain part of the reality. In practically all instances, themeasurements are about processes. If it were not, it would only provide a staticaccount of objects in the reality. The key problem of this paper is how to design thedata warehouse from annotated KPI definitions such that the KPIs can be calculatedby aggregate queries on the data warehouse.Another angle to KPIs is their summarizing nature. A KPI is not based on a singlearbitrary observation but it aggregates a large number of observations about the sameentities (or activities) to be statistically meaningful. The concept of an observation isthe atomic building block of KPIs. Once the common properties of observations areset, one can start to collect such observations systematically and create the KPI on topof them. Different types of observations lead to different KPIs. So, given thedefinition of a KPI, what is the type of observations belonging to this KPI? KPIs canalso be formed as expressions over other more simple KPIs. For example, theproductivity of a process can be measured the division of a KPI on the output of theprocess divided by a KPI on the resources used for producing the output. Such KPIsare called derived KPIs. Since their computation is simple once the part KPIs arecomputed, we shall focus on simple KPIs that are not defined in terms of other KPIsbut that are defined in terms of sets of atomic observations of the same type.
2Related WorkKey performance indicators are a technique to quantify the performance of anorganization or of its processes to achieve business objectives. In this chapter we viewKPIs as used in conceptual modeling, in particular business process modeling, and indata warehousing.2.1 Key performance indicators in conceptual modelingWetzstein et al. [1] investigate the definition of KPIs in the context of businessprocess models, in particular from a service-oriented architecture perspective. SimpleKPIs (called process performance metrics, PPMs) are the basis of more sophisticated,context-specific KPIs such as determining whether a customer has received thepromised quality of service QoS (e.g. response time) can depend on the customerclass and further parameters that we can view as dimensions of the KPI measurement.In their view a KPI is based on PPMs, a QoS definition, and a decision tree thatdetermines whether a PPM measurement fulfills the QoS definition.Strategic business modeling based on the Business Intelligence Model BIM [4]extends the goal modeling language i* by metrics linked to i* goals on the one sideand tasks on the other side. The goals are monitored by the metrics and the tasks arethe measures to achieve the goals. The metric interval is decomposed intoperformance regions (target, threshold/acceptable, worst value). The approachreminds of balance scorecards but extends it to the rich goal modeling language i*.In software engineering, KPIs were introduced to manage the softwaredevelopment process [22], in particular in combination with the capability andmaturity model CMMI [23]. Measurements such as the defect density in source codeare used to control the software development process. Oivo and Basili s goalquestion-metric (GQM) approach [24] provides an informal guideline on whichmetrics need to be monitored in order to assess that a certain goal (like improving thesoftware quality) is reached. A quality goal is decomposed in a set of qualityquestions, which is itself decomposed into a set of quality metrics. The metrics arecomparable to KPIs. Hence, the GQM approach allows to group KPIs by the goals ofstakeholders. An agreement on goals allows to focus only on those KPIs that areneeded to assess to which extent the goals have been reached. The GQM approachhighlights that metrics (and thus KPIs) should not be mixed up with goals.Nevertheless, quality goals are often formulated in terms of KPIs such as the averagecycle time of a certain process must be below a certain threshold.
Statistical process control (SPC) [25] was introduced by Deming [2] and othersinto the manufacturing domain as a tool to monitor the production and productquality. Specifically, it measures parameters and establishes statistical correlationsbetween the parameters (called variables in statistics). The correlations betweenvariables are translated into a set of equations for predicting values for dependentvariables from independent variables. The idea is to control the independent variables(such as the quality of input materials) at early stages of the production process inorder to guarantee that the dependent variables (such as product quality parameters)are within a desired interval. The variables in SPC are comparable to KPIs.
2.2 Data Warehouse Design and KPIsA central issue in data warehousing is to design appropriate multi-dimensional datamodels to support querying, exploring, reporting, and analysis as required byorganizational decision making. DW design has received considerable researchattention. However, there are different methodological approaches proposed by theliterature. Some approaches are data-driven in the sense that they aim at deriving factsand dimensions from the structures of operational sources that are usually representedas Entity Relationship Diagrams (ERD) or Unified Modeling Language (UML)diagrams. The outcome of this approach is a set of candidate facts or even dataschemas, among which only relevant ones are selected to include in DW systems. Forinstance, Golfarelli et al. [5] proposed the DW design approach based on E/R scheme.Golfarelli and Rizzi [6] also developed a data-driven method for DW design based onDimensional Fact Model.Song, Khare, and Dai [7] developed the SAMSTAR method that is a semi-automatedapproach to generating star schema from operational source ERD. Although, theauthors mentioned that the SAMSTAR method was both data-driven and goal-driven,this method is primarily data-driven because it derives star schema based on thestructures and semantic of operational sources. Zepeda, Celma, and Zatarain [8]proposed a conceptual design approach consisting of two stages. The first stage is togenerate multidimensional data structures from UML-based enterprise schema. Thesecond stage is to use user requirements to select relevant schema. Moreover, thealgorithm for automatic conceptual schema development and evaluation based onMultidimensional Entity Relationship Model (M/ER) was invented by Phipps andDavis [9]. Similarly, Moody and Kortink [10] proposed a methodology for designingDW schema based on enterprise models.On the other hand, a goal-driven approach gives more relevance to user requirementsin designing DW. Prakash and Gosain [11] present a requirement-driven datawarehouse development based on the goal-decision-information model. In addition,Giorgini, Rizzi, and Garzetti [12] propose a goal-oriented requirement analysis forDW design in which the organizational goals are made explicit and decomposed intosub-goals and then the relationships among sub-goals and actors are identified andanalyzed. Their method starts with identification of corporate goals (i.e., userrequirements) and actors involved. The actor can be either a responsible persons orresources that are needed to accomplish the goal.
We focus on the conceptual design phase to provide a blueprint for lower level logicaldesign that is consistent with the KPI definitions from which we start. Tryfona,Busborg, and Christiansen [13] developed the starER model for conceptual design ofData Warehouses and argued that DW design should be exposed to higher level sothat it becomes more understandable, and easier to identify conceptually what areingredients are actually needed in the DW. In addition, it is advisable not to usecomputer metaphors such as ‘table’ or ‘field’Jones and Song [14] developed Dimensional Design Pattern (DDP) that assistsdesigners to effectively determine commonly used DW dimensions. In this sense, theDDP framework consist of six classes of dimension domain, from which DWdesigner can choose specific dimension and attributes during the mapping process.Moreover, an important issue in designing DW schema is additivity of facts. A fact isadditive relative to a dimension if it is summarizable along that dimension. Theimportance of summarizability is discussed by Shoshani [15]. Horner, Song, and Chen[16] present a taxonomy of summary constraints that can be used for this purpose.The other issue in designing DW schema is the choice between the various types ofmultidimensional data models, among which star schema and snowflake schema aremost common in data warehouses. However, the most data warehouses use starschema for two important reasons. First, it is the most efficient design because lessjoint operations are required due to denormalized tables. Second, the star schema issupported by most query optimizers for creating an access plan that use efficient starjoin operations [17].A study of data warehouse in connection with KPIs can be found in the triple-drivendata modeling methodology presented by Guo et al [18]. This methodology consistsof four major stages: (1) goal driven stage, (2) data driven stage, (3) user driven stage,and (4) combination stage. During the first stage, business goals and KPIs areidentified according to business subject area. The second stage is to obtain a dataschema that supports the KPIs from the operational data sources. The third stage is tointerview users in order to identify important business questions. The fourth stage isto check if the business KPIs can be calculated and questions can be answered by theobtained data schema. As indicated by its second stage, this methodology is primarilydata-driven because the operational sources impose total constraints on thecomputation of KPIs. Moreover, the first stage is where KPIs have to be identifiedand the attributes needed to support these KPIs have to be determined. However, thismethodology does not specify how to determine those required attributes as part ofthe DW data models. In other words, the practical steps to analyze the KPI structuraldefinition are not provided. In addition, the generation of star schema is based on thedata-driven method that was developed by Moody and Kortink [10].Vaisman and Zimány [21] propose a classification of KPIs along severaldimensions. First KPIs are classified wrt. to the time span of observations (past,
present, future). Second, they distinguish KPIs on inputs needed for a business resultsfrom KPIs about the business result and performance. Further, there are operationalvs. strategic KPIs and qualitative (obtained by surveys etc.) vs. quantitative. Theymultidimensional expressions (MDX) to relate a KPI value to a KPI goal (expressedas thresholds or intervals).In the sequel, we develop an informal guideline on how to create a data warehouseschema out of patterns found in business process models. The multi-dimensionalcharacter of the KPIs is excerpted from the products serving as inputs and outputs ofthe processes, the resources used in the processes, and time and location information.We also shall review the role of plans and schedules (compare to targets in BIM) informulating KPIs.3Data Warehouses for Structuring ObservationsA data warehouse manages multi-dimensional facts, where each fact constitutes anobservation about the domain of interest, e.g. an enterprise. The structure of anobservation is a tuple(d1, d2 , , dk, m)where di are dimension entities represented by their identifier and m is ameasurement value, typically a number. The measurement value attribute isfunctionally dependent from the combination of dimension entities. As an exampleassume that we have the dimensions car, location, and time and the measurementattribute ‘speed’ for representing car speed observations. Then, the observation factswould look like(‘Marys ohns car’,‘Barcelona’,2013-03-12T21:07:47,145)As functional expressions, these observations can be represented as equationsspeed(‘Marys car’,‘Skövde’,2013-09-28T10:31:19) 385
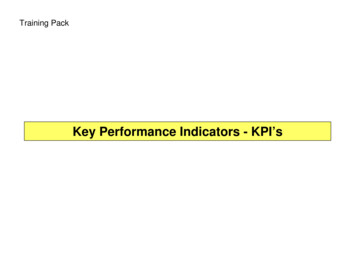
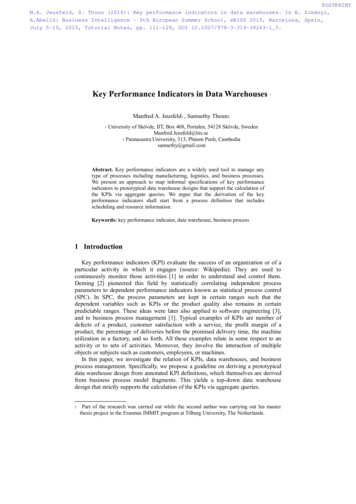
speed(‘Johns car’,‘Barcelona’,2013-03-12T21:07:47) 145We learn from this example that the dimensions of the observation determine thecircumstances under which the speed observation was made. The car parameter isrepresenting an entity participating in the observation. Location and time aredimension entities that frequently occur in observations. Other than the car, they arenot entities/objects of the real world but we can reify them to be entities. Thisreification is common in data warehouses by creating dimension tables wheretemporal and special dimension values get surrogate identifiers. The goal of this paperis to derive the dimensions for a simple KPI from a high-level specification for thisKPI.AnalystManagementKPI specificationKPI queryrequiredDW schemaDWETLEnterpriseFig. 1. Workflow of creating DW schemas from KPI definitionsThe general steps for realizing the KPI are1.2.3.Specify the KPI including its measurement context. The measurementcontext is defined by a combination of entities (customers, products,time, location, etc) that were present when the observation was made.Create the supporting data warehouse schema. We limit ourselves in thispaper mostly on the fact table.Code the queries computing the KPI on top of the created schema.Natural language KPI definitions found in practice are usually rather ambiguous bynature. Take for example the average speed of cars as a KPI for the traffic process.What is the context of the underlying observations? It can be the time of the
measurement, the location, and the car involved in the measurement. However, itcould also include the car driver. Some of the relevant context may be difficult todetermine such as the car driver. This can limit the utility of the KPI for decisionmaking or for understanding the process underlying the observations.3.1 The process nature of observationsAn observation is a statement made by agent (the observation) about an object in thereality, possibly involving other objects. Lenz and Shoshani [19] differentiate flowand stock observations. A flow observation is about recording a state change of theobject recorded wrt. some time interval, a stock observation is a record about theobject’s state. As a third category, they list value-per-unit observations, such as theprice of a product. Assume we would only record stock observations. If there are nochanges, then the observations of an object would also not change. This is like listingthe specific weights of elementary substances. If there are changes, then the states ofobjects vary over time and shall yield different observations. The reasons for changesare processes taking place in the reality. These processes can be natural like theradioactive decay or they are man-made, such as production processes. Consider theexample of an oil refinery that stores oil in large tanks. Each tank has a fill level.There are two processes that can change the fill level: adding oil to the tank andremoving oil. These processes are embedded in more complex processes taking placeat the oil refinery. Flow observations about the oil tank record how much the state ofan object has changed between two points of time. For example, how many liters ofoil have been added and how many have been removed in the last month. If the stateis known at the start of the time period, then the state at the end of the time period canbe calculated by applying the additions and subtractions of the flow observations. Thethird observation type, value-per-unit break down stock or flow observations to smallunits, such as the oil price per liter. Assume that the oil refinery buys quantities of oilon the market at different prices and then stores the oil in the tank. Then each liter ofoil stored in a tank virtually carries its unit price with it. The total value of the oil inthe tank is then the sum of all oil liter unit prices of oil liters stored in the tank.The lesson learned from this argumentation is that state changes require thepresence of processes. If the processes are natural, then human influence on them islimited. For example, the water cycle on earth is driven by the sun and leads tovarying levels of water in the river systems. Still, it makes perfect sense to recordobservations about the water cycle in order to predict the water levels of certain riversat certain locations, e.g., to prepare for flooding. An organization with man-madeprocesses has an interest in managing the processes to achieve its goals, e.g. toincrease the profit or to raise customer satisfaction. The management includeschanging the parameters of process steps (e.g. their scheduling), adapting theresources (e.g. the machines used in production steps), changing the inputs of process
steps (e.g. replacing a part by another part), or cha
Key performance indicators are a widely used tool to manage any type of processes including manufacturing, logistics, and business processes. We present an approach to map informal specifications of key performance indicators to prototypical data warehouse designs that s