Transcription
MQL4 Language for Newbies. Custom IndicatorsAuthor: Antoniuk OlegTypes of IndicatorsNow I will show you, what kinds of indicators exist. Of course, you have seen a lot of them, butnow I would like to draw your attention to features and parameters of indicators, thus we willmake a small classification of features and parameters. It will then help you to write customindicators. So, the first simple indicator:This is Moving Average, MA, a widely used technical indicator. Pay attention to the followingimportant facts: the indicator is drawn in the chart windowthe indicator shows only one valuethe range of the indicator values is unlimited and depends on the current pricesthe line is drawn with a certain color, width and style (solid line)Now let us view another indicator:
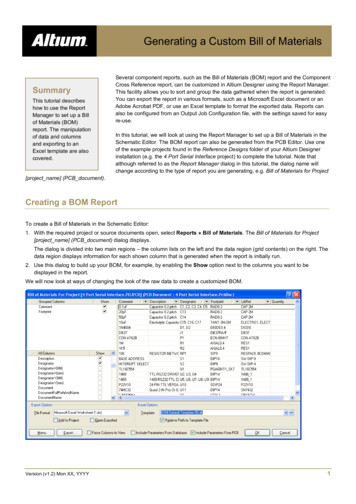
It is Williams’ Percent Range, %R. Pay attention to the following important facts: the indicator is drawn in a separate subwindowlike in the previous case, the indicator shows only one valuethe range of the indicator values is strictly limitedthe drawn line has another style, color and widthThus, the following indicator properties exist: the indicator is drawn: in a chart window or in a separate subwindow. Now let us try tounderstand, why Moving Average is drawn on the chart, and Williams’ Percent Range,%R is drawn in a separate window. The difference is in the range of the shown values.Note, that the second indicator shows values in the range from 0 to -100. Now imaginethat we show these values in a chart window. And what would happen? You would notsee this line, because the price has a much narrower range. In our case it is from 0.6805to 0.7495. But it is not all. Actually, prices are positive numbers, and our value isnegative. Indicators are drawn in a separate subwindow if their values are outside theprice range of the active chart. And if the range is almost the same (for example, differentkinds of moving averages), an indicator is drawn in a chart window. In future set thisindicator parameter according to this simple logics. Here is a picture:
an indicator that is drawn in a separate subwindow may be limited to a strict range. Itmeans the terminal sets a fixed scale for showing indicator values; and even if valuesexceed the range, you will not see them. If you disable this parameter, the terminalautomatically will change the scale so that it contains all values of an indicator. See thepicture:
an indicator may show its values using different colors, styles and width. You have seenit quite often when setting up the drawing of indicators in the terminal. Here is onerestriction: if you use a line width more than 1, you may use only one style - solid line.Here is one more indicator:
As you see, the indicator Volumes is drawn in the form of a histogram. So, there are severaltypes of showing indicator values. Here is an example of another type:
The indicator Fractals is drawn in the form of special symbols. Now look at the followingindicator:
This is Alligator. Note, the indicator simultaneously draws three values (balance lines). Howdoes it work? Actually, any indicator (there are some exceptions, but we will talk about themlater) uses data buffers when showing values.Data buffer is almost a simple array. Its peculiarity is in the fact that this array is partiallymanaged by the terminal. The terminal changes the array so, that at the receipt of each new bar, ashift takes place. It is done for the purpose that each array element corresponds to a certain bar.The maximal number of shown data buffers in one indicator is 8. It may seem strange now, butsoon you will understand that it could not be otherwise. Just remember that there is a separatedata buffer for each line in Alligator. Each data buffer has its own parameters, according towhich the terminal draws them. In our case there are 3 buffers that can be described in thefollowing way:1. The first buffer is drawn by a solid green line at a width 3.2. The second buffer is drawn by a dashed line of red color and width 1.3. The third buffer is drawn by a solid blue line at a width 2.It is not necessary for an indicator to draw a buffer. It can be used for intermediary calculations.That is why the number of buffers may be larger than you see. But the most important propertyof data buffer is that each buffer element should correspond to a certain bar on a chart. Justremember this. Soon you will see how this works in a code.Now let us draw a conclusion of our small excursion. Any indicator has the following
parameters: one or more data buffers (though not necessarily) for showing its values or forintermediary calculations. Each buffer, in its turn has its own parameters that define howit will be drawn and whether it will be drawn. For example: draw the value in the formof a histogram, symbol or line; what color and style;where the indicator should be drawn (in a chart window or in a subwindow);if the indicator is drawn in a subwindow, should we limit the range or should the scalingbe automatic.Make sure that you clearly understand all these parameters. Now we will use a Wizard forcreating a custom indicator.Creating a Custom IndicatorStart MetaEditor, select File- New:Then we see a window Expert Advisor Wizard, select Custom Indicator, click Next:
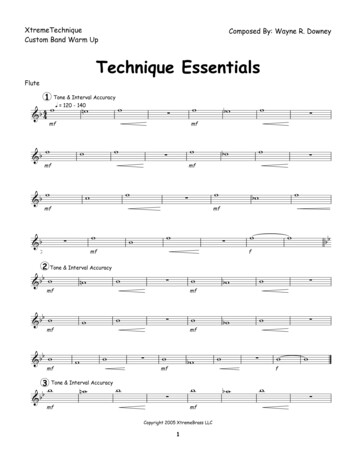
Fill in fields Name, Author and Link. Everything is as usual here, but now you may addparameters. What is this?Parameters are common variables that can be set by a user. And what is important, thesevariables may be used in an indicator code. The application of parameters is obvious - youenable users to set up some aspects of the indicator operation. This can be anything you wish.For example, timeframe to use, operating mode, number of bars for averaging etc.As an example let us try to add a parameter that will show the number of bars processed for thecalculation of the indicator values. Where can it be used? Imagine that your indicator seriouslyloads your processor because of too many calculations. And you often change the timeframe ofthe chart and view only the last 100-200 bars. Then you do not need other calculations that wastetime. This parameter will help you in such a situation. Of course, there will be nothing difficultin our indicator that can waste the computer resources. This is only a variant of using indicatorparameters.So, for adding a parameter click Add (1). After that you may change a variable name (2). In ourcase we substitute it for barsToProcess. You may also change the initial value (3), i.e. defaultvalue. Change it into 100. Besides you may change the variable type, but in our case we do notneed to change anything, because type int suits perfectly to our purposes. After all necessarychanges are made, click Next:
It is almost ready. Now indicate how the indicator should be drawn: in a separate window or ina chart window. You may also limit the range. Check Indicator in separate window. Belowis an empty field Indexes (data buffers). Here you may add the necessary number of data buffers(maximum 8). Besides, you may always add or delete a buffer later, changing the code. ClickAdd for adding a buffer. Now you may change the way the buffer will be drawn: line,histogram, section, arrow. We will not change anything, so our type is Line. Set up the colorand click OK.Finally, your first indicator is ready! Well, it does not draw anything, but it is a code! The filewith the source code is in the folder with indicators: MetaTrader4\experts\indicators.Let us Analyze Each LineNow let us see, what Meta Editor has created:// ---------------- // myFirstIndicator.mq4 // Your name // web address // ---------------- As usual the head consisting of one-line comments includes the information you have written
earlier. Next:#property copyright "Antonuk Oleg"Do you still remember the preprocessor directive #define from the second article? We used it fordeclaring constants. So, here is one more directive used for denoting specific properties of anindicator. In our case it is used for indicating authorship. Please note that is starts with thespecial sign #, then goes the key word property (without a space). Then comes a concreteproperty that we want to set, in our case it is copyright, and then the value of this property. Inour case it is a line with your name. Using the directive #property you may set up many specificaspects of the indicator. You will see it now. All these properties will be set up by default. Let usgo further:#property link"banderass@i.ua"This directive shows, how to contact the author. You may ask where this information (theauthor's name and contact information) is, because it is not shown anywhere. But it is includedinto the executable file. And if you view the executable file as a common text, you will see thisinformation:Next:#property indicator separate windowThis directive shows, that the indicator must be drawn in a separate subwindow. As you see,there are no additional parameters, as distinct from the previous directive.#property indicator buffers 1This directive indicates, how many data buffers will be used by the indicator. You may havenoticed that directives are in some way similar to common functions: they also accept someparameters and do something in response. But there is an important difference: they are executedin the first instance (before compilation).#property indicator color1 DarkOrchidIndicate default color for the first buffer. Note that buffer numeration starts from one, not fromzero. Try to remember it, so that you have no confusion in future. The color is indicated usingone of many predetermined names. You may see key words for all available colors in the help:MQL4 Reference - Standard Constants - Web-Colors. Similarly you may indicate thecolor for other buffers, simply change the buffer number.extern intbarsToProcess 100;This is our parameter of the indicator. We have set it in the Wizard. Note that the only
difference from a common variable is the key word extern before the variable type. This is howthe parameter will look like for a user at the indicator start:Next:double ExtMapBuffer1[];This is a usual array. But the dimensionality is not indicated and initialization is not performed.This array will later be set up as a data buffer.Then we declare and describe functions. As distinct from a usual script, each indicator has 3functions, not 1: init() - this function is called by the terminal only once, when we start the indicator. Itspurpose is to prepare the indicator for operation, set up data buffers, check parameters(what a user has written) and other preparatory actions. This function is not obligatory. Ifyou do not perform a code in it, you may delete it.deinit() - this function is also called only once, when you delete an indicator from a chart.You should prepare the indicator for the termination of its operation. For example, closeopened files, delete graphical objects from the file (do not worry, you will learn how todo it). This function is also not obligatory.start() - as distinct from scripts, in indicators this function is called at each tick. I.e. whennew quotes appear from the currency pair, to the chart of which you have attached theindicator, this function is called. Besides, this function is called at the indicator start, i.e.after the function init().Let us see what happens in each function:int init(){
SetIndexStyle(0,DRAW ere we see the calling of two important functions for setting a data buffer:SetIndexStyle(0,DRAW LINE);This function sets how to draw the data buffer. The first parameter indicates, to what bufferthe change should be applied. Please note, that in this function (and similar functions) the buffernumeration starts from zero, not from one like in directives. It is an important moment, so becareful. The second parameter indicates, how to draw the chosen buffer. In our case we usethe constant DRAW LINE, which shows that the buffer will be drawn as a line. Of course, thereare other constants, but we will talk about them later.SetIndexBuffer(0,ExtMapBuffer1);This function "binds" an array to a buffer number. I.e. it shows that the buffer with the indicatednumber will use the indicated array for storing data. So, changing the elements of this array youwill change the value of the buffer. Actually an array is a data buffer. The first argument is thename of the array that should be bound.return(0);End of the function, return zero - the initialization was successful.int deinit(){//---//---return(0);}The function of deinitialization is empty by default.int start(){int counted bars IndicatorCounted();//---//---return(0);}Now comes the most important function - the main code is located here. Pay attention: thevariable counted bars is declared beforehand, it is initialized by the functionIndicatorCounted(). This variable is usually used for the optimization and speedup of the
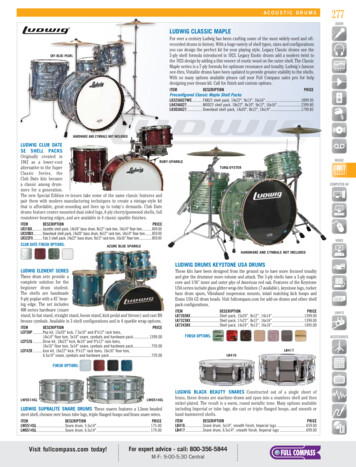
indicator operation, this will be analyzed later. And now let us draw something in the indicatorwindow.Finishing the IndicatorLet us decide what should be displayed. What will the indicator show us? Something simple.First let's draw random numbers. Why not? This guarantees 50% of profit signals.Let's write in our function init() a code for the initialization of the generator of random numbers:int init(){SetIndexStyle(0,DRAW LINE);SetIndexBuffer(0,ExtMapBuffer1);// initialization of the generator of random numbersMathSrand(TimeLocal());return(0);}The initialization is ready, now comes the function start():int start(){int counted bars IndicatorCounted();for(int i 0;i Bars;i ){ExtMapBuffer1[i] MathRand()%1001;}}return(0);Compile - F7. Start the terminal, find the panel Navigator, select the section Custom Indicatorsand double-click the name of our indicator:
The indicator will be attached to the active chart:
Y
MQL4 Language for Newbies. Custom Indicators . Author: Antoniuk Oleg . Types of Indicators : Now I will show you, what kinds of indicators exist. Of course, you have seen a lot of them, but now I would like to draw your attention to : features : and : parameters: of indicators, thus we will make a small : classification of features and parameters. It will then help you to write custom .